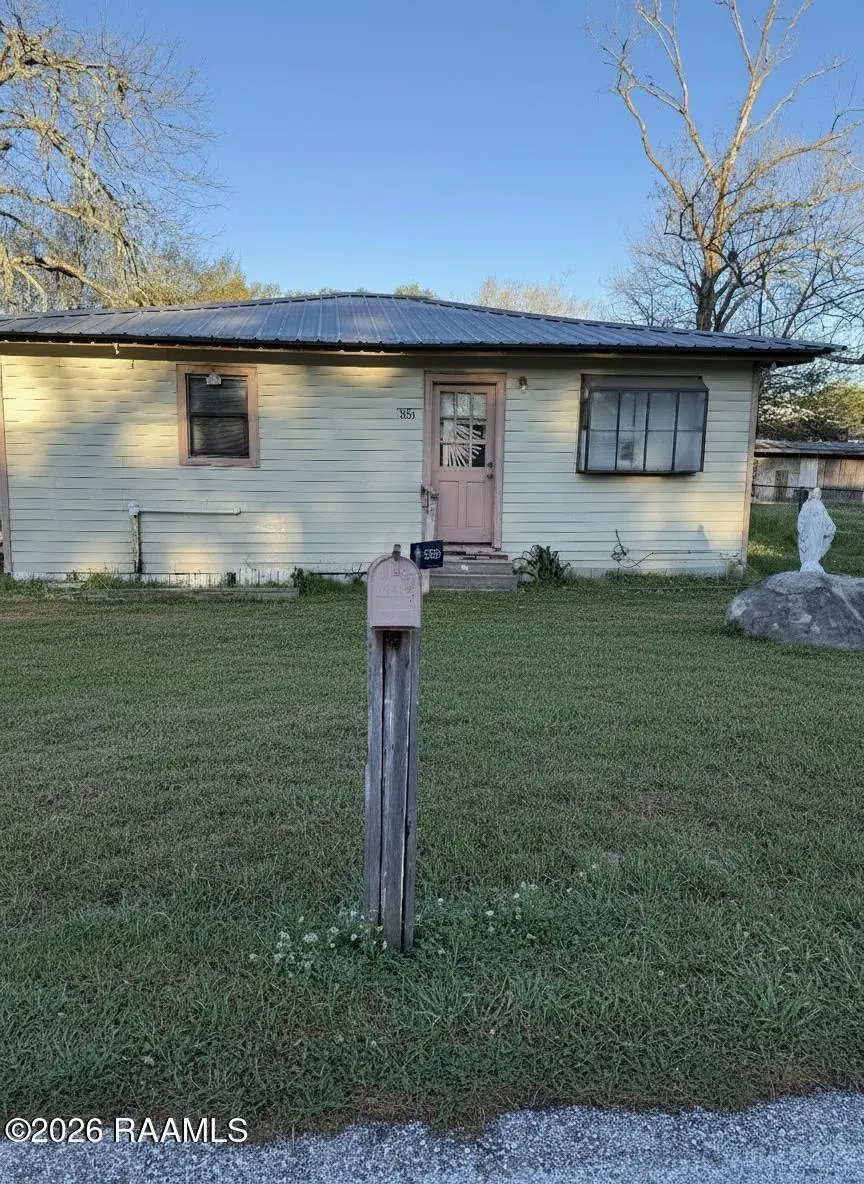
135 Whitney St · Lafayette, LA
Flood risk 6/10 · Moderate
- FEMA flood zone
- AE
- Chance of flooding over 30 yrs
- 0.7%
- Est. flood insurance / yr
- $1,737 – $8,500
Fire risk 3/10 · Minor
- Est. fire insurance / yr
- $1,269 – $2,357
Heat risk 9/10 · Severe
- Hot days now (above 109°F)
- 7 days/yr
- Hot days in 30 yrs
- 21 days/yr
Wind risk 9/10 · Severe
- Chance of severe wind over 30 yrs
- 99.0%
Air-quality risk 2/10 · Minimal
- Unhealthy air days now
- 0 days/yr
- Unhealthy air days in 30 yrs
- 1 days/yr
Risk factors via First Street. Map © Google.
Why this score? — see what drove the D+ grade
The composite is a weighted blend of 9 inputs, each scored 0–100. Each bar is that input's sub-score; the figure is the points it added to the 100-point composite (weight × sub-score).
- Cash flow +16.4/30.0
- ARV discount +10.2/15.0
- DSCR +5.1/10.0
- Rent growth +4.3/5.0
- Schools +3.6/10.0
- Livability +3.5/5.0
- 1% rule +3.1/10.0
- Condition / age +2.5/5.0
- Appreciation +0.0/10.0
$180,000
🖨 Deal sheet (PDF) 📄 Offer letter ✓ Due diligence
Listing remarks MLS
Unlock a rare multi-property investment opportunity featuring four homes across two thriving markets--two in Lafayette and two in Opelousas. This package deal offers the perfect blend of immediate income and value-add potential. Two properties are currently leased, providing steady cash flow from day one, while the remaining two are vacant and ready for renovation. With some TLC and vision, the upside here is undeniable. Whether you're looking to expand your rental portfolio, tackle a flip project, or create long-term equity, this opportunity delivers flexibility and strong potential returns. Opportunities like this don't come around often--priced to move and ideal for investors ready to capitalize.
Key facts
- 0.23 acre lot
- Listed 81 days
Neighborhood map
What this means for you Summary
Snapshot
- This is a 12-bed/4.8-bath single-family listed at $180k.
Deal economics
- At list price, monthly cash flow is $-326 ($-4k/yr) — negative.
- To cash-flow at today's rent, offer at most $122k (32.0% below list).
- To meet the 1% rule (rent ≥ 1% of price), the offer needs to be $146k (19.1% below list).
- Recommended offer: $122k (32.0% below list) — sets the bar for cash-flow.
- Cap rate 7.0% vs local median 4.7% in Lafayette — top-decile yield for the area; either an underpriced asset or a hidden risk that comps aren't pricing in. Stress-test before assuming the spread holds.
Location & tenants
- Location reads 70/100 on livability (#63 in LA) — a middle-class / working-renter tenant base. Strengths: cost of living A+, housing A+, health & safety A+; Watch: amenities C-, employment C-, crime F.
- Lafayette Parish (urban): math 38% / reading 46% proficiency, ranked #19 of 98 in LA (top 19%) — families likely to look elsewhere, expect single-tenant / working-renter base with shorter leases.
- Zoned schools: J. Wallace James Elementary School (math 46% / reading 49%, grade D, #147 of 646 statewide, top 23%, 939 students, 64% FRL); Lafayette Middle School (math 12% / reading 29%, grade F, #161 of 218 statewide, top 76%, 369 students, 83% FRL); Lafayette High School (math 57% / reading 51%, grade C-, #28 of 265 statewide, top 11%, 1,852 students, 52% FRL).
- Market conditions: Rents rising fast (+7.3%/yr); 247 active listings in the ZIP; lower-income renter base — watch delinquency; 1,585 units permitted in Lafayette Parish in 2024 (10 in 5+ unit buildings).
- At $1,456/mo this rent would consume 52% of the median local household income ($33k/yr) (locally 2089% of renters already pay >50% of income on rent) — very limited rent-growth headroom before tenants either downsize or default.
Forward outlook
- Local home prices are declining (-3.0%/yr); year-one equity from $1k of loan paydown is wiped out by about $5k of value loss. Plan a longer hold.
- Lafayette County population projected at +34% by 2050 — long-run rental-demand tailwind backs the buy-and-hold thesis.
Negotiation context
- It's been on market 81 days — a 6% lower offer ($169k) is reasonable based on typical stale-listing flexibility.
- 3 sale attempts since 11y ago with the ask held roughly flat each time — persistent listings suggest the price (not the market) is what's stuck; bring a comps-based counter.
Risks & watch-outs
- Watch-outs: flood insurance adds $427/mo.
- Climate carrying-cost: in FEMA flood zone AE (mandatory federal flood insurance); severe wind risk, 99% chance of damaging wind over 30y; extreme-heat days projected 7→21/yr by 2055 (HVAC capex compounding) — expect insurance premiums to compound above CPI over the hold.
Questions for the listing agent
- What do current leases actually rent for vs. the listed asking? Can we see a recent rent roll and the last 12 months of T-12 income?
- It's been on market 81 days. Have you received any prior offers? Is the seller open to a 32% concession, seller financing, or rate buy-down credit?
- Built in 1975 — when were the roof, HVAC, electrical panel, plumbing, and water heater last replaced?
- What's the actual annual flood-insurance premium (NFIP or private), and is the property in a SFHA with mandatory coverage?
- Why hasn't it sold? Are there any deal-killer items the seller is aware of (foundation, flood, title, zoning, code violations)?
- Is there a deadline driving the sale (1031 exchange, divorce, estate, relocation)? That informs how much negotiation room exists.
- Schools are B-rated — typically a magnet for longer-tenancy family renters. What's the average tenant stay here, and is there a school-zone premium baked into asking?
- Crime grade is F in this area — have there been break-ins, vandalism, or insurance claims at this property in the last 3 years? What carrier currently insures it and at what premium?
- The area grade is low — what's the realistic commute time and amenity access for the typical tenant pool here? Any planned neighborhood developments (good or bad) we should know about?
- What's the average days-on-market for RENTAL listings here right now (not sales)? A rising rental-DOM trend means longer vacancies and softer asking-rent achievability than the comps imply.
- What's the recent tenant-quality profile in this submarket — average credit score on applications, eviction rate, late-payment / NSF rate, and stable-employment percentage? A property-management company in the area should have these aggregated.
- How much new for-sale + rental construction is in the pipeline within 1–3 miles? Heavy new supply typically softens prices + rents 12–24 months out; constrained supply supports both.
Investment metrics
- 1% rule
- 0.81% ✗
- Cap rate
- 6.96%
- Cash-on-cash
- 2.39%
- DSCR
- 1.11
- GRM
- 10.3
CMA / ARV
- ARV (median comp)
- $191,365
- List price
- $180,000
- Delta
- -5.94%
- Verdict
- FAIR
- Comps
- 5 within 1.0 mi
Projected returns pro-forma
-3.0% appreciation · 7.35% rent growth · sell at horizon
- IRR
- -24.0%
- Equity multiple
- 0.14×
- Total profit
- $-43,115
- Equity at exit
- $26,839
- IRR
- -8.8%
- Equity multiple
- 0.33×
- Total profit
- $-33,747
- Equity at exit
- $15,563
Cash invested: $50,400 (down + closing). Projections, not guarantees.
Landlord ↔ Tenant lean methodology
- Overall (STATE)
- 90 Strongly Landlord-Friendly
- State Louisiana
- 90 Strongly Landlord-Friendly · R+12
- County
- — inherits STATE
- City
- — inherits STATE
ZIP-level market 70501
- Rents YoY
- 7.3%
- Active inventory
- 247
- Price-to-rent
- 10.3×
Monthly cashflow live
- Estimated rent
- $1,456 medium interval (Pro) →
- Mortgage (P&I)
- −$944
- Tax from tax record
- −$31 /mo · $371/yr
- Insurance
- −$75
- Flood insurance flood zone
- −$427 /mo · $5,118/yr
- HOA
- −$0
- Vacancy / Maint / Mgmt
- −$306
- Net cashflow
- $-326
Break-even live
Sensitivity live
| Price | -10% $-224 | -5% $-275 | +0% $-326 | +5% $-582 | +10% $-644 |
|---|---|---|---|---|---|
| Rent | -10% $-441 | -5% $-384 | +0% $-326 | +5% $-269 | +10% $-211 |
| Rate | -1.0pp $-235 | -0.5pp $-280 | base $-326 | +0.5pp $-373 | +1.0pp $-420 |
UW: 25.0% down · 7.5% · 30yr · 1.5% tax · 5.0% vac · 8.0% maint · 8.0% mgmt
Financing live
Cash to close
- Down payment
- $45,000
- Closing costs
- $5,400
- Reserves months
- —
- Total cash needed
- —
Loan-product check · same deal, 3 products live
Conventional
25% down · 7.5% · 30yr
- Down + closing
- —
- Monthly P&I
- —
- Monthly cashflow
- —
- DSCR
- —
- Eligible?
- —
Personal DTI + credit; lowest rate.
DSCR
20% down · 8.5% · 30yr
- Down + closing
- —
- Monthly P&I
- —
- Monthly cashflow
- —
- DSCR
- —
- Eligible?
- —
No personal income docs; deal must DSCR.
Hard money
10% down · 12.0% · 12mo
- Down + closing
- —
- Monthly P&I
- —
- Monthly cashflow
- —
- DSCR
- —
- Eligible?
- —
Short-term bridge; refi at stabilization.
Listing history 20 events
-
2026-06-21days on market $180,000 Active 81 DOM
-
2026-06-18days on market $180,000 Active 78 DOM
-
2026-06-17days on market $180,000 Active 77 DOM
-
2026-06-16days on market $180,000 Active 76 DOM
-
2026-06-15days on market $180,000 Active 75 DOM
-
2026-06-14days on market $180,000 Active 73 DOM
-
2026-06-13days on market $180,000 Active 72 DOM
-
2026-06-10days on market $180,000 Active 70 DOM
-
2026-06-09days on market $180,000 Active 69 DOM
-
2026-06-08days on market $180,000 Active 68 DOM
-
2026-06-07days on market $180,000 Active 67 DOM
-
2026-06-05days on market $180,000 Active 64 DOM
-
2026-06-03days on market $180,000 Active 63 DOM
-
2026-06-02days on market $180,000 Active 62 DOM
-
2026-06-01days on market $180,000 Active 61 DOM
-
2026-05-31days on market $180,000 Active 60 DOM
-
2026-05-30days on market $180,000 Active 59 DOM
-
2026-03-31$180,000 Active 708-char remark
Show marketing remark (708 chars)
Unlock a rare multi-property investment opportunity featuring four homes across two thriving markets--two in Lafayette and two in Opelousas. This package deal offers the perfect blend of immediate income and value-add potential. Two properties are currently leased, providing steady cash flow from day one, while the remaining two are vacant and ready for renovation. With some TLC and vision, the upside here is undeniable. Whether you're looking to expand your rental portfolio, tackle a flip project, or create long-term equity, this opportunity delivers flexibility and strong potential returns. Opportunities like this don't come around often--priced to move and ideal for investors ready to capitalize.
-
2016-05-16$45,000
-
2015-11-30$45,000
ⓘ Source: listings_history table (triggers on properties + properties_extension) + one-shot
backfill from property_details.listing_events for pre-trigger history.
Tax reassessment forecast LA · Resets to sale price
- Current annual tax
- $371 · $31/mo
- Projected year-2 tax
- $990 · $82/mo
- Expected delta
- +$619/yr (+$52/mo · 166.7%)
ⓘ Screening estimate from a state-policy table — verify with the county assessor before closing.
Climate risk First Street
- Flood 6/10 Major FEMA zone AE · 70% chance over 30 yrs
- Wildfire 3/10 Moderate
- Heat 9/10 Extreme 7 d/yr ≥109°F today · 21 d/yr by 30 yrs out
- Wind 9/10 Extreme 99% chance of damaging wind over 30 yrs
- Air quality 2/10 Low 0 unhealthy d/yr today · 1 by 30 yrs out
Nearby sold comps map
Loading sold comps map…
Walkable amenities ~0.75 mi
Loading nearby amenities…
Taxation est. · year 1
- Rental income
- $17,474
- − Mortgage interest
- −$10,083
- − Property taxes
- −$371
- − Insurance
- −$6,018
- − Repairs & maintenance
- −$1,398
- − Management
- −$1,398
- − Depreciation
- −$5,236
- Taxable loss
- −$7,031
- Est. tax savings @ 24.0%
- +$1,687
- After-tax cash flow
- $-2,225/yr
For passive investors: Depreciation is non-cash, so a rental often shows a tax loss while cash-flowing — sheltering income. Rental losses are passive: they offset passive income freely, and up to $25,000/yr can offset ordinary (W-2) income if you actively participate and your MAGI is under $100k (phasing out to $0 by $150k); unused losses carry forward. On sale, claimed depreciation is recaptured at up to 25%, and gains may owe capital-gains tax (a 1031 exchange can defer both). Figures are a year-1 estimate at your 24.0% rate — not tax advice; consult a CPA.
Schools (NCES district)
- District
- Lafayette Parish
- NCES district ID
- 2200870
- Math proficiency
- 38% ▼ -32.00%
- Reading proficiency
- 46% ▼ -24.00%
- Median HH income
- $50,238
- Composite
- 36.15/100
- National rank
- #4741
- State rank
- #19 of 98 in LA
Livability — Lafayette
- Score
- 70/100
- State rank
- #63
- US rank
- #8133
Category grades
Schools grade is shown separately in the Schools card above.
Census & demographics
- Census place
- Lafayette, LA
- County
- Lafayette Parish · 207,544 people
- City population
- 158,114
- Metro
- Lafayette, LA
- Population (ZIP)
- 26,465
- Household income
- $33,365
- Rent vs Own
- Severe rent burden
- 2089.0
Population outlook (Lafayette County) Hauer SSP2
- Today (2025)
- 280,930 people
- By 2030
- 301,092 · +7.2%
- By 2040
- 339,456 · +20.8%
- By 2050
- 375,156 · +33.5%
- By 2075
- 451,672 · +60.8%
- By 2100
- 497,203 · +77.0%
Race, ethnicity, and origin ACS 2023
- Neighborhood character
- Predominantly Black (73%)
- Race & ethnicity
- Black 73% White 18% Two or more races 6% Hispanic / Latino 4%
- Common ancestry
- Lithuanian 4%
- Foreign-born
- 2% · Canada
- Languages at home
- 95% English-only · Spanish 3% French/Haitian/Cajun 2%
Political lean MEDSL · Lafayette
- 2024 margin
- Solid R (+31.4) · D 33.5% · R 64.8% · Other 1.7%
- 2008→2024 swing
- -0.1pp no change · 2008: -31.3pp · 2024: -31.4pp
- All cycles
- 2024: R+31.4 2020: R+28.7 2016: R+33.6 2012: R+33.7 2008: R+31.3
Not yet ingested
- Civics
- —
Market trends
- HPI YoY
- ▼ -108.63%
- Current HPI
- 81.2963
- Rent YoY
- ▲ 7.35%
- Metro
- Lafayette, LA
- State GDP YoY
- ▲ 3.29%
- F500 in state
- 10
Industry mix (Fortune 500 HQ in LA)
| Industry | F500 HQs | Revenue |
|---|---|---|
| Telecommunications | 2 | $23B |
|
||
| Utilities | 1 | $12B |
|
||
| Wholesale / Distribution | 1 | $5B |
|
||
| Advertising | 1 | $2B |
|
||
Price history
+300.0% since first listed3 events — show timeline
- 2026-03-31 Listed $180,000 AcadianaMLS
- 2016-05-16 Listed $45,000 AcadianaMLS
- 2015-11-30 Listed $45,000 AcadianaMLS
Property tax history
+3.0%/yrLatest (2025): $371 · -1.1% YoY. Source: county tax records.
Cash-flow waterfall
monthlySold comps — $/sqft
last 12 mo · ≤1 miLoading sold comps…