2723 Queen Ave N · Minneapolis, MN
Flood risk 1/10 · Minimal
- FEMA flood zone
- X (unshaded)
- Chance of flooding over 30 yrs
- 0.0%
- Est. flood insurance / yr
- $473 – $860
Fire risk 1/10 · Minimal
- Est. fire insurance / yr
- $888 – $1,650
Heat risk 2/10 · Minimal
- Hot days now (above 99°F)
- 7 days/yr
- Hot days in 30 yrs
- 14 days/yr
Wind risk 2/10 · Minimal
- Chance of severe wind over 30 yrs
- —
Air-quality risk 2/10 · Minimal
- Unhealthy air days now
- 1 days/yr
- Unhealthy air days in 30 yrs
- 1 days/yr
Risk factors via First Street. Map © Google.
Why this score? — see what drove the D+ grade
The composite is a weighted blend of 9 inputs, each scored 0–100. Each bar is that input's sub-score; the figure is the points it added to the 100-point composite (weight × sub-score).
- Cash flow +14.1/30.0
- ARV discount +11.8/15.0
- DSCR +4.3/10.0
- Rent growth +4.3/5.0
- Livability +3.9/5.0
- 1% rule +3.7/10.0
- Schools +3.5/10.0
- Condition / age +2.5/5.0
- Appreciation +0.0/10.0
$239,000
🖨 Deal sheet (PDF) 📄 Offer letter ✓ Due diligence
Listing remarks
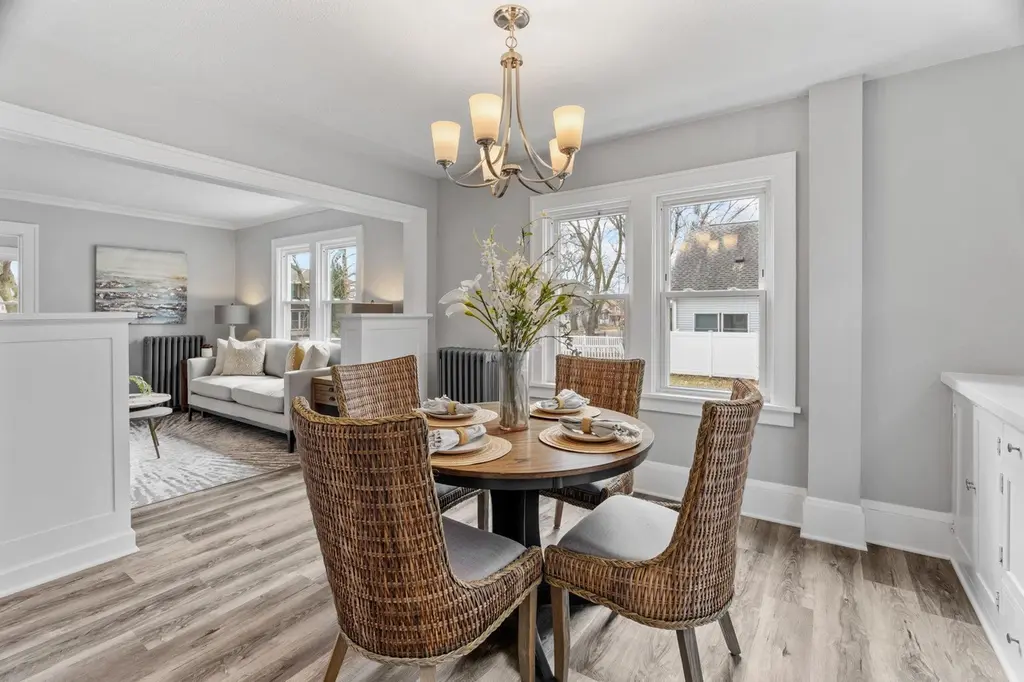
* * * Rare Second Opportunity! This highly sought-after home — which received multiple offers — is back on market due solely to a buyer preference change unrelated to the property. Act fast; this one won't last! * * * Incredible 1921 Two-Story in Jordan – 3 Beds + Office, Fully Updated, Steps from Theodore Wirth Regional Park! This extensively updated 1,384-square-foot home in Minneapolis's vibrant Near North community packs in everything today's buyer wants: three bedrooms plus a main floor office/sunroom, a beautifully renovated kitchen with brand new cabinetry, granite countertops, and all new stainless steel appliances including a gas stove, gorgeous new LVP f
Key facts
- Updated kitchen
- New lvp flooring
- Granite countertops
Tags
Neighborhood map
What this means for you Summary
Snapshot
- This is a 3-bed/1.0-bath single-family listed at $239k.
Deal economics
- At list price, monthly cash flow is $34 ($414/yr) — positive.
- The deal already cash-flows at list — no discount required.
- To meet the 1% rule (rent ≥ 1% of price), the offer needs to be $207k (13.3% below list).
- Recommended offer: $207k (13.3% below list) — sets the bar for 1% rule.
- Cap rate 6.5% vs local median 3.1% in Minneapolis — top-decile yield for the area; either an underpriced asset or a hidden risk that comps aren't pricing in. Stress-test before assuming the spread holds.
Location & tenants
- Location reads 78/100 on livability (#110 in MN, #2,525 nationally) — a middle-class / working-renter tenant base. Strengths: amenities A+, commute A+, housing A+; Watch: cost of living C-, crime F.
- Minneapolis Public School District (urban): math 35% / reading 46% proficiency, ranked #217 of 301 in MN (top 72%) — families likely to look elsewhere, expect single-tenant / working-renter base with shorter leases.
- Zoned schools: Lucy Laney Elementary (math 8% / reading 17%, grade F, #800 of 857 statewide, top 95%, 339 students, 89% FRL); Franklin Middle (math 2% / reading 8%, grade F, #255 of 258 statewide, top 100%, 287 students, 89% FRL); Henry High (reading 70%, 858 students, 80% FRL) — zoned schools average 86% FRL vs 58% district-wide (28 pts higher); higher-poverty schools than district average — tighter screening recommended.
- Zoned-school proficiency averages 9% at this address vs 40% district-wide (-32 pts) — the specific schools serving this property underperform the Minneapolis Public School District average; the district grade overstates school quality for this exact location.
- Market conditions: Rents rising fast (+7.3%/yr); 133 active listings in the ZIP; 33 comparable units currently listed for rent nearby; rentals at typical pace (median 17d on market — plan ~3-4 weeks tenant-placement turnaround); 4,651 units permitted in Hennepin County in 2024 (2,443 in 5+ unit buildings).
- This rent runs 41% of the median local income ($60k/yr) — at the standard rent-burdened threshold; future hikes will face affordability resistance.
Forward outlook
- Local home prices are declining (-3.0%/yr); year-one equity from $2k of loan paydown is wiped out by about $7k of value loss. Plan a longer hold.
- Hennepin County population projected at +30% by 2050 — long-run rental-demand tailwind backs the buy-and-hold thesis.
Negotiation context
- Only 10 days on market — expect competitive offers; lowballing is unlikely to land.
- 5 sale attempts since 30y ago with the ask held roughly flat each time — persistent listings suggest the price (not the market) is what's stuck; bring a comps-based counter.
- Current owner paid $90k; list at $239k implies a 166% gain — meaningful room to come down on a strong offer.
Risks & watch-outs
- Watch-outs: built in 1921 — expect roof / HVAC / electrical / plumbing capex.
Questions for the listing agent
- Built in 1921 — when were the roof, HVAC, electrical panel, plumbing, and water heater last replaced?
- Is there a deadline driving the sale (1031 exchange, divorce, estate, relocation)? That informs how much negotiation room exists.
- Crime grade is F in this area — have there been break-ins, vandalism, or insurance claims at this property in the last 3 years? What carrier currently insures it and at what premium?
- The area grade is low — what's the realistic commute time and amenity access for the typical tenant pool here? Any planned neighborhood developments (good or bad) we should know about?
- What's the average days-on-market for RENTAL listings here right now (not sales)? A rising rental-DOM trend means longer vacancies and softer asking-rent achievability than the comps imply.
- What's the recent tenant-quality profile in this submarket — average credit score on applications, eviction rate, late-payment / NSF rate, and stable-employment percentage? A property-management company in the area should have these aggregated.
- How much new for-sale + rental construction is in the pipeline within 1–3 miles? Heavy new supply typically softens prices + rents 12–24 months out; constrained supply supports both.
Investment metrics
- 1% rule
- 0.87% ✗
- Cap rate
- 6.47%
- Cash-on-cash
- 0.62%
- DSCR
- 1.03
- GRM
- 9.6
CMA / ARV
- ARV (on-the-fly)
- $264,120
- Comps found
- 1
Show comp detail 1 sale within ~0.75 mi
| Address | Dist | Beds/Ba | Sqft | Sold | Price | $/sf | Match |
|---|---|---|---|---|---|---|---|
| 2123 Queen Ave N | 0.50mi | 2/1.0 (-1) | 1,486 (-13%) | 10mo | $230,000 | $155 | 42 |
Match score weights: distance 35% · size 25% · config 20% · recency 20%. Top-matched comps best support the ARV.
Projected returns pro-forma
-3.0% appreciation · 7.35% rent growth · sell at horizon
- IRR
- -10.7%
- Equity multiple
- 0.60×
- Total profit
- $-27,068
- Equity at exit
- $35,636
- IRR
- 3.8%
- Equity multiple
- 1.32×
- Total profit
- $21,747
- Equity at exit
- $20,664
Cash invested: $66,920 (down + closing). Projections, not guarantees.
Landlord ↔ Tenant lean methodology
- Overall (CITY)
- 34 Tenant-Leaning
- State Minnesota
- 46 Balanced · D+2
- County
- — inherits STATE
- City Minneapolis
- 34 Tenant-Leaning · D+50
ZIP-level market 55411
- Home prices YoY
- -8.7%
- Rents YoY
- 7.3%
- Active inventory
- 133
- Price-to-rent
- 9.6×
Monthly cashflow live
- Estimated rent
- $2,072 high interval (Pro) →
- Mortgage (P&I)
- −$1,253
- Tax from tax record
- −$249 /mo · $2,990/yr
- Insurance
- −$100
- HOA
- −$0
- Vacancy / Maint / Mgmt
- −$435
- Net cashflow
- $34
Break-even live
Sensitivity live
| Price | -10% $170 | -5% $102 | +0% $34 | +5% $-33 | +10% $-101 |
|---|---|---|---|---|---|
| Rent | -10% $-129 | -5% $-47 | +0% $34 | +5% $116 | +10% $198 |
| Rate | -1.0pp $155 | -0.5pp $95 | base $34 | +0.5pp $-27 | +1.0pp $-90 |
UW: 25.0% down · 7.5% · 30yr · 1.5% tax · 5.0% vac · 8.0% maint · 8.0% mgmt
Financing live
Cash to close
- Down payment
- $59,750
- Closing costs
- $7,170
- Reserves months
- —
- Total cash needed
- —
Loan-product check · same deal, 3 products live
Conventional
25% down · 7.5% · 30yr
- Down + closing
- —
- Monthly P&I
- —
- Monthly cashflow
- —
- DSCR
- —
- Eligible?
- —
Personal DTI + credit; lowest rate.
DSCR
20% down · 8.5% · 30yr
- Down + closing
- —
- Monthly P&I
- —
- Monthly cashflow
- —
- DSCR
- —
- Eligible?
- —
No personal income docs; deal must DSCR.
Hard money
10% down · 12.0% · 12mo
- Down + closing
- —
- Monthly P&I
- —
- Monthly cashflow
- —
- DSCR
- —
- Eligible?
- —
Short-term bridge; refi at stabilization.
Rent comps 33 comps
| Address | Beds | Baths | Sqft | Rent | $/sqft | DOM | Units | Dist |
|---|---|---|---|---|---|---|---|---|
| 2323 26th Ave N Minneapolis, MN | 2.0 | 1.0 | 807 | $1,717 | $2.13 | 16d | 3 | 0.25mi |
| 2947 Morgan Ave N Minneapolis, MN | 2.0 | 1.0 | 1106 | $1,950 | $1.76 | 1d | 1 | 0.30mi |
| 2947 Morgan Ave N Minneapolis, MN | 2.0 | 1.0 | 1106 | $1,950 | $1.76 | 15d | 1 | 0.30mi |
| 3114 Morgan Ave N Minneapolis, MN | 4.0 | 2.0 | 1362 | $2,000 | $1.47 | 16d | 1 | 0.38mi |
| 2324 Logan Ave N Minneapolis, MN | 4.0 | 1.5 | 1400 | $2,300 | $1.64 | 46d | 1 | 0.48mi |
| 2703 Humboldt Ave N Minneapolis, MN | 3.0 | 1.0 | 1218 | $1,450 | $1.19 | 23d | 1 | 0.57mi |
| 3315 James Ave N Minneapolis, MN | 4.0 | 1.0 | 1400 | $2,100 | $1.50 | 5d | 1 | 0.63mi |
| 2330 N Irving Ave Minneapolis, MN | 2.0 | 1.0 | 1600 | $1,375 | $0.86 | 9d | 1 | 0.66mi |
| 3105 N Girard Ave Unit 2 Minneapolis, MN | 4.0 | 1.0 | 1250 | $2,300 | $1.84 | 26d | 1 | 0.67mi |
| 1510 N 22nd Ave #1 Minneapolis, MN | 3.0 | 1.0 | 1500 | $1,875 | $1.25 | 5d | 1 | 0.70mi |
| 1510 N 22nd Ave #1 Minneapolis, MN | 3.0 | 1.0 | 1500 | $1,875 | $1.25 | 23d | 1 | 0.70mi |
| 2411 Golden Valley Rd Unit 2 Minneapolis, MN | 4.0 | 2.0 | 1200 | $2,395 | $2.00 | 16d | 1 | 0.72mi |
| 2646 Dupont Ave N Unit 2 Minneapolis, MN | 4.0 | 1.0 | 1514 | $2,245 | $1.48 | 45d | 1 | 0.85mi |
| 1816 Zephyr Pl Minneapolis, MN | 3.0 | 1.0 | 1120 | $2,050 | $1.83 | 45d | 1 | 0.88mi |
| 3342 Fremont Ave N Unit 2 Minneapolis, MN | 4.0 | 2.0 | 2000 | $2,200 | $1.10 | 26d | 1 | 0.88mi |
| 2124 Fremont Ave N Minneapolis, MN | 2.0 | 1.0 | 1050 | $1,580 | $1.50 | 3d | 1 | 0.90mi |
| 2900 N Colfax Ave Unit 2 Minneapolis, MN | 2.0 | 1.0 | 1200 | $1,345 | $1.12 | 26d | 1 | 0.91mi |
| 2600 France Ave N Unit 2600 Minneapolis, MN | 2.0 | 1.5 | 1100 | $1,599 | $1.45 | 6d | 1 | 0.92mi |
| 1312 18th Ave N Minneapolis, MN | 3.0 | 1.0 | 1520 | $1,899 | $1.25 | 9d | 1 | 0.98mi |
| 1504 Queen Ave N Minneapolis, MN | 3.0 | 1.5 | 1746 | $2,800 | $1.60 | 0d | 1 | 1.02mi |
| 1504 Queen Ave N Minneapolis, MN | 3.0 | 1.5 | 1746 | $2,800 | $1.60 | 3d | 1 | 1.02mi |
| 1507 N Newton Ave Unit 2 Minneapolis, MN | 4.0 | 1.0 | 1068 | $1,499 | $1.40 | 45d | 1 | 1.03mi |
| 2643 Lyndale Ave N Minneapolis, MN | 4.0 | 2.0 | 2198 | $750 | $0.34 | 18d | 1 | 1.07mi |
| 1429 Knox Ave N Unit 1429 Minneapolis, MN | 4.0 | 1.0 | 1260 | $1,995 | $1.58 | 45d | 1 | 1.10mi |
| 3419 Grimes Ave N Minneapolis, MN | 3.0 | 1.5 | 1300 | $2,050 | $1.58 | 45d | 1 | 1.15mi |
| 835 W Broadway Ave Minneapolis, MN | 1.0–2.0 | 1.0–2.0 | 849 | $2,150 | $2.53 | 4d | 7 | 1.18mi |
| 1407 N Girard Ave Unit 2 Minneapolis, MN | 2.0 | 1.0 | 1472 | $1,900 | $1.29 | 19d | 1 | 1.24mi |
| 414 N 33rd Ave Unit 2 Minneapolis, MN | 2.0 | 1.0 | 1246 | $1,600 | $1.28 | 45d | 1 | 1.26mi |
| 318 N 27th Ave #2 Minneapolis, MN | 3.0 | 1.0 | 1200 | $1,800 | $1.50 | 5d | 1 | 1.26mi |
| 318 N 27th Ave #2 Minneapolis, MN | 3.0 | 1.0 | 1200 | $1,800 | $1.50 | 45d | 1 | 1.26mi |
| 1237 Knox Ave N Unit 1237 Minneapolis, MN | 3.0 | 1.0 | 1196 | $1,900 | $1.59 | 5d | 1 | 1.30mi |
| 1239 Knox Ave N Minneapolis, MN | 4.0 | 1.0 | 1944 | $2,400 | $1.23 | 5d | 1 | 1.30mi |
| 3935 Fremont Ave N Minneapolis, MN | 4.0 | 1.0 | 1900 | $2,595 | $1.37 | 45d | 1 | 1.41mi |
Listing history 17 events
-
2026-04-24status Pending
-
2026-04-18historical Contingent - Inspection
-
2026-04-17status Active
-
2026-04-16historical Contingent - Inspection
-
2026-04-13$239,000 Active
-
1999-11-10soldstatus $89,900
-
1999-09-22soldstatus $89,900
-
1999-09-13soldstatus $42,500
-
1999-09-02historical
-
1999-08-04$89,900
-
1999-07-05soldstatus $42,500
-
1999-06-03historical
-
1999-05-17$44,500
-
1997-07-24soldstatus $57,800
-
1997-06-27soldstatus $57,800
-
1997-05-12historical
-
1996-12-11$57,800
ⓘ Source: listings_history table (triggers on properties + properties_extension) + one-shot
backfill from property_details.listing_events for pre-trigger history.
Tax reassessment forecast MN · Partial reset (capped growth)
- Current annual tax
- $2,990 · $249/mo
- Projected year-2 tax
- $2,990 · $249/mo
- Expected delta
- $0/yr ($0/mo · 0.0%)
ⓘ Screening estimate from a state-policy table — verify with the county assessor before closing.
Climate risk First Street
- Flood 1/10 Low FEMA zone X (unshaded) · 0% chance over 30 yrs
- Wildfire 1/10 Low
- Heat 2/10 Low 7 d/yr ≥99°F today · 14 d/yr by 30 yrs out
- Wind 2/10 Low
- Air quality 2/10 Low 1 unhealthy d/yr today · 1 by 30 yrs out
Nearby sold comps map
Loading sold comps map…
Walkable amenities ~0.75 mi
Loading nearby amenities…
Taxation est. · year 1
- Rental income
- $24,859
- − Mortgage interest
- −$13,388
- − Property taxes
- −$2,990
- − Insurance
- −$1,195
- − Repairs & maintenance
- −$1,989
- − Management
- −$1,989
- − Depreciation
- −$6,953
- Taxable loss
- −$3,644
- Est. tax savings @ 24.0%
- +$875
- After-tax cash flow
- $1,288/yr
For passive investors: Depreciation is non-cash, so a rental often shows a tax loss while cash-flowing — sheltering income. Rental losses are passive: they offset passive income freely, and up to $25,000/yr can offset ordinary (W-2) income if you actively participate and your MAGI is under $100k (phasing out to $0 by $150k); unused losses carry forward. On sale, claimed depreciation is recaptured at up to 25%, and gains may owe capital-gains tax (a 1031 exchange can defer both). Figures are a year-1 estimate at your 24.0% rate — not tax advice; consult a CPA.
Schools (NCES district)
- District
- Minneapolis Public School District
- NCES district ID
- 2721240
- Math proficiency
- 35% ▼ -7.00%
- Reading proficiency
- 46% ▼ -1.00%
- Median HH income
- $50,521
- Composite
- 34.92/100
- National rank
- #5067
- State rank
- #217 of 301 in MN
Livability — Minneapolis
- Score
- 78/100
- State rank
- #110
- US rank
- #2525
Category grades
Schools grade is shown separately in the Schools card above.
Census & demographics
- Census place
- Minneapolis, MN
- County
- Hennepin County · 1,150,272 people
- City population
- 417,555
- Metro
- Minneapolis-St. Paul-Bloomington, MN-WI
- Population (ZIP)
- 27,741
- Household income
- $60,225
- Rent vs Own
- Severe rent burden
- 1826.0
Population outlook (Hennepin County) Hauer SSP2
- Today (2025)
- 1,405,227 people
- By 2030
- 1,492,650 · +6.2%
- By 2040
- 1,660,157 · +18.1%
- By 2050
- 1,823,498 · +29.8%
- By 2075
- 2,221,283 · +58.1%
- By 2100
- 2,509,976 · +78.6%
Race, ethnicity, and origin ACS 2023
- Neighborhood character
- Diverse neighborhood (Simpson 0.68)
- Race & ethnicity
- Black 49% White 23% Two or more races 11% Hispanic / Latino 11% Asian 9%
- Hispanic origin (detail)
- Mexican 7% Puerto Rican 1%
- Common ancestry
- Portuguese 3% Lithuanian 2% Italian 1%
- Foreign-born
- 19% · Canada, Guatemala
- Languages at home
- 68% English-only · Other Asian/Pacific 8% Spanish 8%
Political lean MEDSL · Hennepin
- 2024 margin
- Solid D (+42.6) · D 70.2% · R 27.5% · Other 2.3%
- 2008→2024 swing
- +14.0pp toward D · 2008: 28.6pp · 2024: 42.6pp
- All cycles
- 2024: D+42.6 2020: D+43.2 2016: D+35.3 2012: D+27.1 2008: D+28.6
Not yet ingested
- Civics
- —
Market trends
- HPI YoY
- ▼ -33.91%
- Current HPI
- 356.6758
- Rent YoY
- ▲ 7.35%
- Metro
- Minneapolis-St. Paul-Bloomington, MN-WI
- State GDP YoY
- ▲ 2.41%
- F500 in state
- 34
Industry mix (Fortune 500 HQ in MN)
| Industry | F500 HQs | Revenue |
|---|---|---|
| Healthcare | 2 | $407B |
|
||
| Retail | 2 | $150B |
|
||
| Consumer Goods | 2 | $32B |
|
||
| Industrial Machinery | 2 | $6B |
|
||
| Agriculture | 1 | $40B |
|
||
| Healthcare / Medical Devices | 1 | $32B |
|
||
Price history
+313.5% since first listed17 events — show timeline
- 2026-04-24 Pending — NORTHSTARMLS as Distributed by MLS Grid
- 2026-04-18 Contingent — NORTHSTARMLS as Distributed by MLS Grid
- 2026-04-17 Relisted — NORTHSTARMLS as Distributed by MLS Grid
- 2026-04-16 Contingent — NORTHSTARMLS as Distributed by MLS Grid
- 2026-04-13 Listed $239,000 NORTHSTARMLS as Distributed by MLS Grid
- 1999-11-10 Sold (Public Records) $89,900 Public Records
- 1999-09-22 Sold (MLS) $89,900 NORTHSTARMLS as Distributed by MLS Grid
- 1999-09-13 Sold (Public Records) $42,500 Public Records
- 1999-09-02 Listing Removed — NORTHSTARMLS as Distributed by MLS Grid
- 1999-08-04 Listed $89,900 NORTHSTARMLS as Distributed by MLS Grid
- 1999-07-05 Sold (MLS) $42,500 NORTHSTARMLS as Distributed by MLS Grid
- 1999-06-03 Listing Removed — NORTHSTARMLS as Distributed by MLS Grid
- 1999-05-17 Listed $44,500 NORTHSTARMLS as Distributed by MLS Grid
- 1997-07-24 Sold (Public Records) $57,800 Public Records
- 1997-06-27 Sold (MLS) $57,800 NORTHSTARMLS as Distributed by MLS Grid
- 1997-05-12 Listing Removed — NORTHSTARMLS as Distributed by MLS Grid
- 1996-12-11 Listed $57,800 NORTHSTARMLS as Distributed by MLS Grid
Property tax history
+3.6%/yrLatest (2025): $2,990 · +7.9% YoY. Source: county tax records.
Cash-flow waterfall
monthlySold comps — $/sqft
last 12 mo · ≤1 miLoading sold comps…