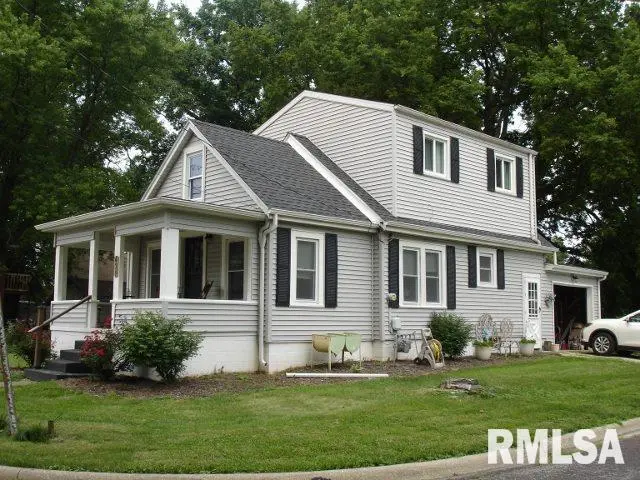
431 Doering Ave · East Peoria, IL
Flood risk 1/10 · Minimal
- FEMA flood zone
- X (unshaded)
- Chance of flooding over 30 yrs
- 0.0%
- Est. flood insurance / yr
- $473 – $860
Fire risk 1/10 · Minimal
- Est. fire insurance / yr
- $804 – $1,492
Heat risk 3/10 · Minor
- Hot days now (above 104°F)
- 7 days/yr
- Hot days in 30 yrs
- 18 days/yr
Wind risk 2/10 · Minimal
- Chance of severe wind over 30 yrs
- 1.0%
Air-quality risk 3/10 · Minor
- Unhealthy air days now
- 1 days/yr
- Unhealthy air days in 30 yrs
- 3 days/yr
Risk factors via First Street. Map © Google.
Why this score? — see what drove the C grade
The composite is a weighted blend of 9 inputs, each scored 0–100. Each bar is that input's sub-score; the figure is the points it added to the 100-point composite (weight × sub-score).
- Cash flow +25.5/30.0
- DSCR +8.4/10.0
- ARV discount +7.4/15.0
- 1% rule +6.9/10.0
- Livability +3.8/5.0
- Rent growth +2.5/5.0
- Condition / age +2.5/5.0
- Schools +1.5/10.0
- Appreciation +0.0/10.0
$120,000
🖨 Deal sheet 📄 Offer letter ✓ Due diligence
Listing remarks MLS
Move in Ready! Beautiful and Adorable 3 Bedroom, 1 Bath 2 Story Home with attached garage. Well Maintained and Cozy Home with many updates. New Central Air in 2020; Other updates Fresh paint throughout, new roof, gutters, windows, siding, furnace, carpet and hardwood flooring in 2015...Updated kitchen with stainless steel appliances in 2015. Partial Basement with plenty of Room for a Family Room or Rec Room! Plenty of space and storage. Very Nice Covered Front Porch To Enjoy and Relax in the Evenings or a Nice Place for Grilling Too! Close to shopping and dining. all measurements deemed reliable not guaranteed. Yard larger than appears. Taxes reflect owner occupied exemption. This Well Maintained Home is a Must See! Schedule your Showing Today!
Key facts
- 3,663 sq ft lot
- Garage
- Built 1940
Property features AI
Exterior
- Parking: Attached 1-car garage
- Utilities: Public water; Public sewer
- Home design: Single family residence; Shingle roof; Built in 1940
- Construction: Partial unfinished basement
- Exterior features: Corner, level lot; Paved road access
Interior
- Kitchen: Dishwasher; Microwave; Refrigerator
- Bedrooms: Three bedrooms (one on the upper level, two others on upper level and additional levels as noted); Primary bedroom approx. 14 x 10 with egress window and carpet; Second bedroom approx. 12 x 10 with egress window and laminate flooring; Third bedroom approx. 9 x 9 with egress window and vinyl flooring
- Flooring: Carpet in living room and some bedrooms; Laminate in at least one bedroom; Vinyl in at least one bedroom
- Bathrooms: One full bathroom
- Heating & cooling: Central air; Forced air heating; Gas water heater
- Interior features: Cable available; Radon mitigation system; Partial, unfinished basement
- Laundry & utility: Laundry room in basement; Owned water softener
Neighborhood map
What this means for you Summary
Snapshot
- This is a 4-bed/1.0-bath single-family listed at $120k.
Deal economics
- At list price, monthly cash flow is $279 ($3k/yr) — positive.
- The deal already cash-flows at list — no discount required.
- Meets the 1% rule at list price ($1k rent vs $120k).
- Recommended offer: $118k (1.5% below list) — sets the bar for market timing.
- Cap rate 9.1% vs local median 4.6% in East Peoria — top-decile yield for the area; either an underpriced asset or a hidden risk that comps aren't pricing in. Stress-test before assuming the spread holds.
Location & tenants
- Location reads 75/100 on livability (#209 in IL, #3,927 nationally) — a middle-class / working-renter tenant base. Strengths: cost of living A+, housing A+, health & safety A+; Watch: amenities D, commute F.
- East Peoria Chsd 309 (suburban): math 17% / reading 15% proficiency, ranked #482 of 620 in IL (top 78%) — low school quality limits family demand, transient renter base, plan for 1-2y turnover.
- Zoned schools: East Peoria High School (math 17% / reading 15%, grade F, #457 of 693 statewide, top 66%, 947 students, 0% FRL).
- Market conditions: 145 active listings in the ZIP; 77 units permitted in Tazewell County in 2024 (0 in 5+ unit buildings).
Forward outlook
- Local home prices are declining (-3.0%/yr); year-one equity from $830 of loan paydown is wiped out by about $4k of value loss. Plan a longer hold.
- Tazewell County population projected at -15% by 2050 — secular population decline; favor cash flow + early exit over multi-decade hold.
Negotiation context
- It's been on market 15 days — a 2% lower offer ($118k) is reasonable based on typical stale-listing flexibility.
- 6 sale attempts since 25y ago; this cycle's ask is 35% above the opening price — seller raised mid-cycle; expect resistance to lowballs.
- Current owner paid $88k; 37% above their basis — modest negotiation headroom, anchor on the comps not their cost.
Risks & watch-outs
- Watch-outs: built in 1940 — expect roof / HVAC / electrical / plumbing capex.
Questions for the listing agent
- Built in 1940 — when were the roof, HVAC, electrical panel, plumbing, and water heater last replaced?
- Is there a deadline driving the sale (1031 exchange, divorce, estate, relocation)? That informs how much negotiation room exists.
- Schools are F-rated, which usually means shorter tenancies and higher turnover. Who's the typical renter profile here, and what's been the actual vacancy rate?
- What's the average days-on-market for RENTAL listings here right now (not sales)? A rising rental-DOM trend means longer vacancies and softer asking-rent achievability than the comps imply.
- What's the recent tenant-quality profile in this submarket — average credit score on applications, eviction rate, late-payment / NSF rate, and stable-employment percentage? A property-management company in the area should have these aggregated.
- How much new for-sale + rental construction is in the pipeline within 1–3 miles? Heavy new supply typically softens prices + rents 12–24 months out; constrained supply supports both.
Investment metrics
- 1% rule
- 1.19% ✓
- Cap rate
- 9.09%
- Cash-on-cash
- 9.98%
- DSCR
- 1.44
- GRM
- 7.0
CMA / ARV
- ARV (on-the-fly)
- $119,700
- Comps found
- 12
Show comp detail 12 sales within ~0.75 mi
| Address | Dist | Beds/Ba | Sqft | Sold | Price | $/sf | Match |
|---|---|---|---|---|---|---|---|
| 326 Park Ave | 0.22mi | 3/1.0 (-1) | 1,104 (-3%) | 5mo | $102,000 | $92 | 75 |
| 221 N Stewart St | 0.56mi | 3/1.0 (-1) | 1,120 (-2%) | 2mo | $135,000 | $121 | 64 |
| 615 Pekin Ave | 0.07mi | 3/1.0 (-1) | 1,276 (+12%) | 13mo | $65,000 | $51 | 61 |
| 617 N Stewart St | 0.26mi | 3/2.0 (-1) | 1,248 (+10%) | 3mo | $150,000 | $120 | 61 |
| 304 Park Ave | 0.17mi | 3/1.5 (-1) | 1,256 (+10%) | 11mo | $157,000 | $125 | 59 |
| 122 Holland Ct | 0.53mi | 4/2.0 | 1,182 (+4%) | 11mo | $124,000 | $105 | 56 |
| 315 Smith St | 0.62mi | 3/1.0 (-1) | 1,073 (-6%) | 9mo | $134,900 | $126 | 48 |
| 353 Cole St | 0.38mi | 3/1.0 (-1) | 1,059 (-7%) | 20mo | $70,000 | $66 | 48 |
| 121 Apple Ct | 0.64mi | 3/1.5 (-1) | 1,279 (+12%) | 3mo | $175,400 | $137 | 40 |
| 323 Smith St | 0.59mi | 3/1.0 (-1) | 1,036 (-9%) | 18mo | $106,725 | $103 | 38 |
| 317 Smith St | 0.61mi | 3/1.0 (-1) | 1,270 (+11%) | 13mo | $120,000 | $94 | 37 |
| 408 Glendale St | 0.52mi | 3/1.0 (-1) | 1,302 (+14%) | 20mo | $60,000 | $46 | 30 |
Match score weights: distance 35% · size 25% · config 20% · recency 20%. Top-matched comps best support the ARV.
Projected returns pro-forma
-3.0% appreciation · 3.0% rent growth · sell at horizon
- IRR
- -1.3%
- Equity multiple
- 0.95×
- Total profit
- $-1,611
- Equity at exit
- $17,892
- IRR
- 8.4%
- Equity multiple
- 1.64×
- Total profit
- $21,658
- Equity at exit
- $10,375
Cash invested: $33,600 (down + closing). Projections, not guarantees.
Landlord ↔ Tenant lean methodology
- Overall (STATE)
- 43 Moderately Tenant-Leaning
- State Illinois
- 43 Moderately Tenant-Leaning · D+7
- County
- — inherits STATE
- City
- — inherits STATE
ZIP-level market 61611
- Home prices YoY
- -30.8%
- Active inventory
- 145
- Price-to-rent
- 7.0×
Monthly cashflow live
- Estimated rent
- $1,431 medium interval (Pro) →
- Mortgage (P&I)
- −$629
- Tax from tax record
- −$172 /mo · $2,062/yr
- Insurance
- −$50
- HOA
- −$0
- Vacancy / Maint / Mgmt
- −$301
- Net cashflow
- $279
Break-even live
UW: 25.0% down · 7.5% · 30yr · 1.5% tax · 5.0% vac · 8.0% maint · 8.0% mgmt
Financing live
Cash to close
- Down payment
- $30,000
- Closing costs
- $3,600
- Reserves months
- —
- Total cash needed
- —
Loan-product check · same deal, 3 products live
Conventional
25% down · 7.5% · 30yr
- Down + closing
- —
- Monthly P&I
- —
- Monthly cashflow
- —
- DSCR
- —
- Eligible?
- —
Personal DTI + credit; lowest rate.
DSCR
20% down · 8.5% · 30yr
- Down + closing
- —
- Monthly P&I
- —
- Monthly cashflow
- —
- DSCR
- —
- Eligible?
- —
No personal income docs; deal must DSCR.
Hard money
10% down · 12.0% · 12mo
- Down + closing
- —
- Monthly P&I
- —
- Monthly cashflow
- —
- DSCR
- —
- Eligible?
- —
Short-term bridge; refi at stabilization.
Listing history 12 events
-
2026-06-19days on market $120,000 Coming Soon 15 DOM
-
2026-06-18days on market $120,000 Coming Soon 14 DOM
-
2026-06-17days on market $120,000 Coming Soon 13 DOM
-
2026-06-16days on market $120,000 Coming Soon 12 DOM
-
2026-06-15days on market $120,000 Coming Soon 11 DOM
-
2026-06-14days on market $120,000 Coming Soon 9 DOM
-
2026-06-13days on market $120,000 Coming Soon 8 DOM
-
2026-06-10days on market $120,000 Coming Soon 6 DOM
-
2026-06-09days on market $120,000 Coming Soon 5 DOM
-
2026-06-08days on market $120,000 Coming Soon 4 DOM
-
2026-06-07remarks 699-char remark
-
2026-06-07$120,000 Coming Soon 3 DOM
ⓘ Source: listings_history table (triggers on properties + properties_extension) + one-shot
backfill from property_details.listing_events for pre-trigger history.
Tax reassessment forecast IL · Partial reset (capped growth)
- Current annual tax
- $2,062 · $172/mo
- Projected year-2 tax
- $2,393 · $199/mo
- Expected delta
- +$331/yr (+$28/mo · 16.0%)
ⓘ Screening estimate from a state-policy table — verify with the county assessor before closing.
Climate risk First Street
- Flood 1/10 Low FEMA zone X (unshaded) · 0% chance over 30 yrs
- Wildfire 1/10 Low
- Heat 3/10 Moderate 7 d/yr ≥104°F today · 18 d/yr by 30 yrs out
- Wind 2/10 Low 100% chance of damaging wind over 30 yrs
- Air quality 3/10 Moderate 1 unhealthy d/yr today · 3 by 30 yrs out
Nearby sold comps map
Loading sold comps map…
Walkable amenities ~0.75 mi
Loading nearby amenities…
Taxation est. · year 1
- Rental income
- $17,174
- − Mortgage interest
- −$6,722
- − Property taxes
- −$2,062
- − Insurance
- −$600
- − Repairs & maintenance
- −$1,374
- − Management
- −$1,374
- − Depreciation
- −$3,491
- Taxable income
- $1,551
- Est. tax owed @ 24.0%
- −$372
- After-tax cash flow
- $2,981/yr
For passive investors: Depreciation is non-cash, so a rental often shows a tax loss while cash-flowing — sheltering income. Rental losses are passive: they offset passive income freely, and up to $25,000/yr can offset ordinary (W-2) income if you actively participate and your MAGI is under $100k (phasing out to $0 by $150k); unused losses carry forward. On sale, claimed depreciation is recaptured at up to 25%, and gains may owe capital-gains tax (a 1031 exchange can defer both). Figures are a year-1 estimate at your 24.0% rate — not tax advice; consult a CPA.
Schools (NCES district)
- District
- East Peoria Chsd 309
- NCES district ID
- 1713230
- Math proficiency
- 17% ▼ -6.00%
- Reading proficiency
- 15% ▼ -9.00%
- Median HH income
- $51,439
- Composite
- 14.75/100
- National rank
- #9394
- State rank
- #482 of 620 in IL
Livability — East Peoria
- Score
- 75/100
- State rank
- #209
- US rank
- #3927
Category grades
Schools grade is shown separately in the Schools card above.
Census & demographics
- Census place
- East Peoria, IL
- City population
- 23,698
- Population (ZIP)
- 23,698
Population outlook (Tazewell County) Hauer SSP2
- Today (2025)
- 131,252 people
- By 2030
- 128,028 · -2.5%
- By 2040
- 120,443 · -8.2%
- By 2050
- 111,872 · -14.8%
- By 2075
- 89,843 · -31.5%
- By 2100
- 66,468 · -49.4%
Race, ethnicity, and origin ACS 2023
- Neighborhood character
- Predominantly White (92%)
- Race & ethnicity
- White 92% Two or more races 4% Hispanic / Latino 3% Black 1%
- Common ancestry
- Lithuanian 3% Italian 2% Romanian 2%
- Foreign-born
- 1%
- Languages at home
- 98% English-only · Spanish 1%
Political lean MEDSL · Tazewell
- 2024 margin
- Strong R (+26.7) · D 35.8% · R 62.5% · Other 1.8%
- 2008→2024 swing
- -20.6pp toward R · 2008: -6.0pp · 2024: -26.7pp
- All cycles
- 2024: R+26.7 2020: R+25.6 2016: R+28.5 2012: R+17.9 2008: R+6.0
Not yet ingested
- Civics
- —
Market trends
- HPI YoY
- ▼ -71.82%
- Current HPI
- 161.385
- Rent YoY
- —
- Metro
- —
- State GDP YoY
- ▲ 1.59%
- F500 in state
- 60
Industry mix (Fortune 500 HQ in IL)
| Industry | F500 HQs | Revenue |
|---|---|---|
| Insurance | 4 | $201B |
|
||
| Consumer Goods | 4 | $87B |
|
||
| Industrial Machinery | 3 | $64B |
|
||
| Healthcare | 2 | $55B |
|
||
| Retail / Pharmacy | 1 | $148B |
|
||
| Agriculture / Food | 1 | $86B |
|
||
Price history
+93.5% since first listed26 events — show timeline
- 2026-06-05 Coming Soon $120,000 RMLSA as Distributed by MLS Grid
- 2021-09-02 Sold (Public Records) $87,500 Public Records
- 2021-08-31 Sold (MLS) $87,500 RMLSA as Distributed by MLS Grid
- 2021-08-06 Listing Removed — RMLSA as Distributed by MLS Grid
- 2021-08-06 Listing Removed — RMLSA as Distributed by MLS Grid
- 2021-08-06 Listing Removed — RMLSA as Distributed by MLS Grid
- 2021-08-06 Listing Removed — RMLSA as Distributed by MLS Grid
- 2021-08-06 Listing Removed — RMLSA as Distributed by MLS Grid
- 2021-08-06 Listing Removed — RMLSA as Distributed by MLS Grid
- 2021-08-06 Listing Removed — RMLSA as Distributed by MLS Grid
- 2021-08-06 Listing Removed — RMLSA as Distributed by MLS Grid
- 2021-07-26 Listed $89,000 RMLSA as Distributed by MLS Grid
- 2019-04-02 Sold (Public Records) $76,000 Public Records
- 2019-04-01 Sold (MLS) $76,000 RMLSA as Distributed by MLS Grid
- 2019-02-17 Listed $79,900 RMLSA as Distributed by MLS Grid
- 2016-03-14 Sold (Public Records) $79,000 Public Records
- 2016-03-11 Sold (MLS) $79,000 RMLSA as Distributed by MLS Grid
- 2015-12-02 Listed $79,900 RMLSA as Distributed by MLS Grid
- 2015-09-18 Sold (MLS) $35,000 RMLSA as Distributed by MLS Grid
- 2015-06-05 Listed $37,900 RMLSA as Distributed by MLS Grid
- 2005-09-16 Sold (Public Records) $75,000 Public Records
- 2005-09-16 Sold (MLS) $74,900 RMLSA as Distributed by MLS Grid
- 2005-07-20 Listed $74,900 RMLSA as Distributed by MLS Grid
- 2001-04-02 Sold (Public Records) $63,000 Public Records
- 2001-03-30 Sold (MLS) $62,900 RMLSA as Distributed by MLS Grid
- 2001-02-22 Listed $62,000 RMLSA as Distributed by MLS Grid
Property tax history
+3.0%/yrLatest (2024): $2,062 · +6.1% YoY. Source: county tax records.
Cash-flow waterfall
monthlySold comps — $/sqft
last 12 mo · ≤1 miLoading sold comps…