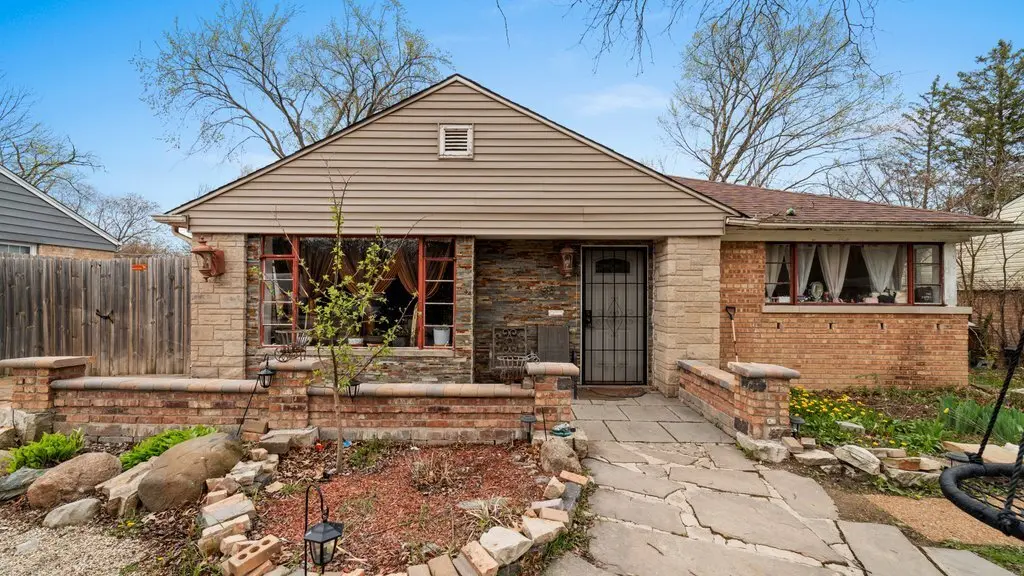
36 Monee Rd · Park Forest, IL
Flood risk 1/10 · Minimal
- FEMA flood zone
- X (unshaded)
- Chance of flooding over 30 yrs
- 0.0%
- Est. flood insurance / yr
- $473 – $860
Fire risk 1/10 · Minimal
- Est. fire insurance / yr
- $804 – $1,492
Heat risk 3/10 · Minor
- Hot days now (above 101°F)
- 7 days/yr
- Hot days in 30 yrs
- 16 days/yr
Wind risk 2/10 · Minimal
- Chance of severe wind over 30 yrs
- —
Air-quality risk 2/10 · Minimal
- Unhealthy air days now
- 1 days/yr
- Unhealthy air days in 30 yrs
- 1 days/yr
Risk factors via First Street. Map © Google.
Why this score? — see what drove the B grade
The composite is a weighted blend of 9 inputs, each scored 0–100. Each bar is that input's sub-score; the figure is the points it added to the 100-point composite (weight × sub-score).
- Cash flow +30.0/30.0
- ARV discount +13.6/15.0
- DSCR +10.0/10.0
- 1% rule +9.8/10.0
- Livability +3.9/5.0
- Rent growth +2.5/5.0
- Condition / age +2.5/5.0
- Schools +0.9/10.0
- Appreciation +0.0/10.0
$159,900
🖨 Deal sheet 📄 Offer letter ✓ Due diligence
Listing remarks MLS
Priced to sell single family in quiet neighborhood! Great investment for savvy investor or homeowner. Severely distressed, but is worth the effort. Make your appointment today.
Key facts
- 2 garage spots
- Built 1952
- Listed 371 days
Property features AI
Finance
- Other: School bus service available
- HOA & community: No required master association fee
Exterior
- Parking: Detached garage (owned) with about 2.5 garage spaces; Driveway and off-street parking; Asphalt surfaces
- Utilities: Water from Lake Michigan / public water; Public sewer
- Home design: Detached single-family home; One-story; Fee simple ownership; Partially in a flood zone; Rehab completed in 2025; Built approximately 71–80 years ago
- Construction: Brick and Masonite exterior; Built before 1978
- Exterior features: Sidewalks and street lights; Paved streets; Lot under 0.25 acre
Interior
- Kitchen: Kitchen on main level
- Bedrooms: 3 bedrooms (all on the main level)
- Flooring: Ceramic tile flooring throughout main living areas and bedrooms
- Bathrooms: 2 full bathrooms
- Heating & cooling: Natural gas forced-air heating
- Interior features: First-floor bedroom; First-floor full bathroom; Six total rooms
- Laundry & utility: Main-level laundry room (12 x 8)
Neighborhood map
What this means for you Summary
Snapshot
- This is a 4-bed/2.0-bath single-family listed at $160k.
Deal economics
- At list price, monthly cash flow is $765 ($9k/yr) — positive.
- The deal already cash-flows at list — no discount required.
- Meets the 1% rule at list price ($2k rent vs $160k).
- Recommended offer: $141k (12.0% below list) — sets the bar for market timing.
- Cap rate 12.0% vs local median 9.7% in Park Forest — meaningfully above typical; check what's discounted (condition, days-on-market, listing class) to confirm the premium yield is real.
Location & tenants
- Location reads 78/100 on livability (#148 in IL, #2,726 nationally) — a middle-class / working-renter tenant base. Strengths: commute A+, cost of living A+, housing A+; Watch: schools D+, amenities F.
- Rich Twp Hsd 227 (suburban): math 5% / reading 12% proficiency, ranked #577 of 620 in IL (top 93%) — low school quality limits family demand, transient renter base, plan for 1-2y turnover.
- Market conditions: 102 active listings in the ZIP; 11 comparable units currently listed for rent nearby; rentals at typical pace (median 22d on market — plan ~3-4 weeks tenant-placement turnaround); 6,272 units permitted in Cook County in 2024 (4,658 in 5+ unit buildings).
- At $2,368/mo this rent would consume 46% of the median local household income ($62k/yr) (locally 900% of renters already pay >50% of income on rent) — very limited rent-growth headroom before tenants either downsize or default.
Forward outlook
- Local home prices are declining (-3.0%/yr); year-one equity from $1k of loan paydown is wiped out by about $5k of value loss. Plan a longer hold.
- At projected returns (-3.0% appreciation + 3.0% rent growth), your $45k cash investment doubles in ~6 years — after that, you're playing with house money.
Negotiation context
- It's been on market 372 days — a 12% lower offer ($141k) is reasonable based on typical stale-listing flexibility.
- 6 sale attempts since 10y ago with the ask held roughly flat each time — persistent listings suggest the price (not the market) is what's stuck; bring a comps-based counter.
- Current owner paid $22k; list at $160k implies a 627% gain — meaningful room to come down on a strong offer.
Risks & watch-outs
- Watch-outs: built in 1952 — expect roof / HVAC / electrical / plumbing capex.
Questions for the listing agent
- It's been on market 372 days. Have you received any prior offers? Is the seller open to a 12% concession, seller financing, or rate buy-down credit?
- Built in 1952 — when were the roof, HVAC, electrical panel, plumbing, and water heater last replaced?
- Why hasn't it sold? Are there any deal-killer items the seller is aware of (foundation, flood, title, zoning, code violations)?
- Is there a deadline driving the sale (1031 exchange, divorce, estate, relocation)? That informs how much negotiation room exists.
- Schools are D-rated, which usually means shorter tenancies and higher turnover. Who's the typical renter profile here, and what's been the actual vacancy rate?
- What's the average days-on-market for RENTAL listings here right now (not sales)? A rising rental-DOM trend means longer vacancies and softer asking-rent achievability than the comps imply.
- What's the recent tenant-quality profile in this submarket — average credit score on applications, eviction rate, late-payment / NSF rate, and stable-employment percentage? A property-management company in the area should have these aggregated.
- How much new for-sale + rental construction is in the pipeline within 1–3 miles? Heavy new supply typically softens prices + rents 12–24 months out; constrained supply supports both.
Investment metrics
- 1% rule
- 1.48% ✓
- Cap rate
- 12.04%
- Cash-on-cash
- 20.52%
- DSCR
- 1.91
- GRM
- 5.6
CMA / ARV
- ARV (on-the-fly)
- $184,760
- Comps found
- 12
Show comp detail 12 sales within ~0.75 mi
| Address | Dist | Beds/Ba | Sqft | Sold | Price | $/sf | Match |
|---|---|---|---|---|---|---|---|
| 343 Osage St | 0.04mi | 3/1.0 (-1) | 1,490 (0%) | 0mo | $185,000 | $124 | 88 |
| 364 Osage St | 0.20mi | 4/3.0 | 1,503 (+1%) | 1mo | $245,000 | $163 | 85 |
| 6 Monee Ct | 0.32mi | 3/1.5 (-1) | 1,452 (-3%) | 3mo | $120,000 | $83 | 72 |
| 362 Oakwood St | 0.28mi | 3/2.0 (-1) | 1,569 (+5%) | 11mo | $130,000 | $83 | 64 |
| 107 Chestnut St | 0.49mi | 4/2.5 | 1,383 (-7%) | 1mo | $215,000 | $155 | 62 |
| 397 Oswego St | 0.56mi | 4/2.0 | 1,398 (-6%) | 2mo | $199,000 | $142 | 61 |
| 111 Nashua St | 0.48mi | 3/1.5 (-1) | 1,500 (+1%) | 11mo | $77,500 | $52 | 60 |
| 127 Blackhawk Dr | 0.48mi | 3/1.5 (-1) | 1,296 (-13%) | 3mo | $117,000 | $90 | 47 |
| 336 Niagara St | 0.48mi | 3/1.5 (-1) | 1,303 (-13%) | 12mo | $150,000 | $115 | 40 |
| 210 Marquette St | 0.70mi | 3/1.0 (-1) | 1,269 (-15%) | 0mo | $153,000 | $121 | 33 |
| 214 Marquette St | 0.72mi | 3/2.0 (-1) | 1,271 (-15%) | 7mo | $184,900 | $145 | 31 |
| 236 Indianwood Blvd | 0.71mi | 3/2.0 (-1) | 1,276 (-14%) | 10mo | $170,000 | $133 | 29 |
Match score weights: distance 35% · size 25% · config 20% · recency 20%. Top-matched comps best support the ARV.
Projected returns pro-forma
-3.0% appreciation · 3.0% rent growth · sell at horizon
- IRR
- 12.8%
- Equity multiple
- 1.51×
- Total profit
- $22,879
- Equity at exit
- $23,842
- IRR
- 21.7%
- Equity multiple
- 2.85×
- Total profit
- $82,847
- Equity at exit
- $13,825
Cash invested: $44,772 (down + closing). Projections, not guarantees.
Landlord ↔ Tenant lean methodology
- Overall (STATE)
- 43 Moderately Tenant-Leaning
- State Illinois
- 43 Moderately Tenant-Leaning · D+7
- County
- — inherits STATE
- City
- — inherits STATE
ZIP-level market 60466
- Home prices YoY
- -21.1%
- Active inventory
- 102
- Price-to-rent
- 5.6×
Monthly cashflow live
- Estimated rent
- $2,368 high interval (Pro) →
- Mortgage (P&I)
- −$839
- Tax est. 1.5%
- −$200 /mo · $2,398/yr
- Insurance
- −$67
- HOA
- −$0
- Vacancy / Maint / Mgmt
- −$497
- Net cashflow
- $765
Break-even live
UW: 25.0% down · 7.5% · 30yr · 1.5% tax · 5.0% vac · 8.0% maint · 8.0% mgmt
Financing live
Cash to close
- Down payment
- $39,975
- Closing costs
- $4,797
- Reserves months
- —
- Total cash needed
- —
Loan-product check · same deal, 3 products live
Conventional
25% down · 7.5% · 30yr
- Down + closing
- —
- Monthly P&I
- —
- Monthly cashflow
- —
- DSCR
- —
- Eligible?
- —
Personal DTI + credit; lowest rate.
DSCR
20% down · 8.5% · 30yr
- Down + closing
- —
- Monthly P&I
- —
- Monthly cashflow
- —
- DSCR
- —
- Eligible?
- —
No personal income docs; deal must DSCR.
Hard money
10% down · 12.0% · 12mo
- Down + closing
- —
- Monthly P&I
- —
- Monthly cashflow
- —
- DSCR
- —
- Eligible?
- —
Short-term bridge; refi at stabilization.
Rent comps 11 comps
| Address | Beds | Baths | Sqft | Rent | $/sqft | DOM | Units | Dist |
|---|---|---|---|---|---|---|---|---|
| 19 Apple Ln Park Forest, IL | 3.0 | 1.0 | 1541 | $2,300 | $1.49 | 12d | 1 | 0.31mi |
| 111 Nashua St Park Forest, IL | 4.0 | 1.5 | 1500 | $2,500 | $1.67 | 24d | 1 | 0.47mi |
| 372 Oswego St Park Forest, IL | 4.0 | 1.0 | 1200 | $2,600 | $2.17 | 24d | 1 | 0.49mi |
| 3324 Western Ave Park Forest, IL | 1.0–3.0 | 1.0 | 1026 | $1,995 | $1.94 | 1d | 11 | 0.80mi |
| 194 Monee Rd Park Forest, IL | 3.0 | 1.0 | 1092 | $1,971 | $1.80 | 22d | 1 | 0.85mi |
| 411 Huron St Park Forest, IL | 3.0 | 1.0 | 1092 | $2,300 | $2.11 | 24d | 1 | 0.85mi |
| 441 Talala St Park Forest, IL | 4.0 | 2.0 | 1740 | $2,500 | $1.44 | 24d | 1 | 0.91mi |
| 277 Somonauk St Park Forest, IL | 3.0 | 1.0 | 966 | $2,000 | $2.07 | 3d | 1 | 1.06mi |
| 490 Shabbona Dr Park Forest, IL | 3.0 | 1.0 | 1300 | $1,895 | $1.46 | 3d | 1 | 1.10mi |
| 235 Tampa St Park Forest, IL | 3.0 | 1.0 | 1092 | $2,000 | $1.83 | 24d | 1 | 1.10mi |
| 316 W 34th St Steger, IL | 3.0 | 1.0–1.5 | 720 | $1,715 | $2.38 | 1d | 5 | 1.42mi |
Listing history 28 events
-
2026-06-18days on market $159,900 Active 372 DOM
-
2026-06-17days on market $159,900 Active 371 DOM
-
2026-06-16days on market $159,900 Active 370 DOM
-
2026-06-15days on market $159,900 Active 369 DOM
-
2026-06-13days on market $159,900 Active 367 DOM
-
2026-06-09days on market $159,900 Active 363 DOM
-
2026-06-08days on market $159,900 Active 362 DOM
-
2026-06-07days on market $159,900 Active 361 DOM
-
2026-06-04days on market $159,900 Active 358 DOM
-
2026-06-03days on market $159,900 Active 357 DOM
-
2026-06-02days on market $159,900 Active 356 DOM
-
2026-06-01days on market $159,900 Active 355 DOM
-
2026-05-31days on market $159,900 Active 354 DOM
-
2025-09-03price $159,900
-
2025-06-10$164,900 Active
-
2025-06-10historical
-
2025-05-16price
-
2025-04-21Active
-
2016-12-23soldstatus $22,000 Closed Sale 176-char remark
Show marketing remark (176 chars)
Priced to sell single family in quiet neighborhood! Great investment for savvy investor or homeowner. Severely distressed, but is worth the effort. Make your appointment today.
-
2016-12-20status Pending 176-char remark
Show marketing remark (176 chars)
Priced to sell single family in quiet neighborhood! Great investment for savvy investor or homeowner. Severely distressed, but is worth the effort. Make your appointment today.
-
2016-10-14status Reactivated 176-char remark
Show marketing remark (176 chars)
Priced to sell single family in quiet neighborhood! Great investment for savvy investor or homeowner. Severely distressed, but is worth the effort. Make your appointment today.
-
2016-09-22historical Contingent 176-char remark
Show marketing remark (176 chars)
Priced to sell single family in quiet neighborhood! Great investment for savvy investor or homeowner. Severely distressed, but is worth the effort. Make your appointment today.
-
2016-09-20price $27,000 176-char remark
Show marketing remark (176 chars)
Priced to sell single family in quiet neighborhood! Great investment for savvy investor or homeowner. Severely distressed, but is worth the effort. Make your appointment today.
-
2016-09-19status Reactivated 176-char remark
Show marketing remark (176 chars)
Priced to sell single family in quiet neighborhood! Great investment for savvy investor or homeowner. Severely distressed, but is worth the effort. Make your appointment today.
-
2016-08-23historical Contingent 176-char remark
Show marketing remark (176 chars)
Priced to sell single family in quiet neighborhood! Great investment for savvy investor or homeowner. Severely distressed, but is worth the effort. Make your appointment today.
-
2016-08-12status Reactivated 176-char remark
Show marketing remark (176 chars)
Priced to sell single family in quiet neighborhood! Great investment for savvy investor or homeowner. Severely distressed, but is worth the effort. Make your appointment today.
-
2016-07-12historical Contingent 176-char remark
Show marketing remark (176 chars)
Priced to sell single family in quiet neighborhood! Great investment for savvy investor or homeowner. Severely distressed, but is worth the effort. Make your appointment today.
-
2016-05-20$32,000 New 176-char remark
Show marketing remark (176 chars)
Priced to sell single family in quiet neighborhood! Great investment for savvy investor or homeowner. Severely distressed, but is worth the effort. Make your appointment today.
ⓘ Source: listings_history table (triggers on properties + properties_extension) + one-shot
backfill from property_details.listing_events for pre-trigger history.
Climate risk First Street
- Flood 1/10 Low FEMA zone X (unshaded) · 0% chance over 30 yrs
- Wildfire 1/10 Low
- Heat 3/10 Moderate 7 d/yr ≥101°F today · 16 d/yr by 30 yrs out
- Wind 2/10 Low
- Air quality 2/10 Low 1 unhealthy d/yr today · 1 by 30 yrs out
Nearby sold comps map
Loading sold comps map…
Walkable amenities ~0.75 mi
Loading nearby amenities…
Taxation est. · year 1
- Rental income
- $28,413
- − Mortgage interest
- −$8,957
- − Property taxes
- −$2,398
- − Insurance
- −$800
- − Repairs & maintenance
- −$2,273
- − Management
- −$2,273
- − Depreciation
- −$4,652
- Taxable income
- $7,060
- Est. tax owed @ 24.0%
- −$1,694
- After-tax cash flow
- $7,491/yr
For passive investors: Depreciation is non-cash, so a rental often shows a tax loss while cash-flowing — sheltering income. Rental losses are passive: they offset passive income freely, and up to $25,000/yr can offset ordinary (W-2) income if you actively participate and your MAGI is under $100k (phasing out to $0 by $150k); unused losses carry forward. On sale, claimed depreciation is recaptured at up to 25%, and gains may owe capital-gains tax (a 1031 exchange can defer both). Figures are a year-1 estimate at your 24.0% rate — not tax advice; consult a CPA.
Schools (NCES district)
- District
- Rich Twp Hsd 227
- NCES district ID
- 1733420
- Math proficiency
- 5% ▼ -3.00%
- Reading proficiency
- 12% ▬ 0.00%
- Median HH income
- $56,056
- Composite
- 8.93/100
- National rank
- #9885
- State rank
- #577 of 620 in IL
Livability — Park Forest
- Score
- 78/100
- State rank
- #148
- US rank
- #2726
Category grades
Schools grade is shown separately in the Schools card above.
Census & demographics
- Census place
- Park Forest, IL
- County
- Cook County · 4,486,803 people
- City population
- 21,461
- Metro
- Chicago-Naperville-Elgin, IL-IN-WI
- Population (ZIP)
- 21,461
- Household income
- $61,654
- Rent vs Own
- Severe rent burden
- 900.0
Population outlook (Cook County) Hauer SSP2
- Today (2025)
- 5,347,519 people
- By 2030
- 5,357,703 · +0.2%
- By 2040
- 5,324,924 · -0.4%
- By 2050
- 5,230,762 · -2.2%
- By 2075
- 4,785,735 · -10.5%
- By 2100
- 4,188,836 · -21.7%
Race, ethnicity, and origin ACS 2023
- Neighborhood character
- Predominantly Black (69%)
- Race & ethnicity
- Black 69% White 19% Hispanic / Latino 9% Two or more races 3% Native American 1%
- Hispanic origin (detail)
- Mexican 8%
- Common ancestry
- Romanian 2% Iranian 1% Italian 1%
- Foreign-born
- 6% · Canada
- Languages at home
- 90% English-only · Spanish 7% French/Haitian/Cajun 1% Russian/Polish/Slavic 1%
Political lean MEDSL · Cook
- 2024 margin
- Solid D (+42.0) · D 70.4% · R 28.4% · Other 1.2%
- 2008→2024 swing
- -11.4pp toward R · 2008: 53.4pp · 2024: 42.0pp
- All cycles
- 2024: D+42.0 2020: D+50.3 2016: D+53.0 2012: D+49.4 2008: D+53.4
Not yet ingested
- Civics
- —
Market trends
- HPI YoY
- ▼ -58.87%
- Current HPI
- 219.9692
- Rent YoY
- —
- Metro
- Chicago-Naperville-Elgin, IL-IN-WI
- State GDP YoY
- ▲ 1.59%
- F500 in state
- 60
Industry mix (Fortune 500 HQ in IL)
| Industry | F500 HQs | Revenue |
|---|---|---|
| Insurance | 4 | $201B |
|
||
| Consumer Goods | 4 | $87B |
|
||
| Industrial Machinery | 3 | $64B |
|
||
| Healthcare | 2 | $55B |
|
||
| Retail / Pharmacy | 1 | $148B |
|
||
| Agriculture / Food | 1 | $86B |
|
||
Price history
+399.7% since first listed15 events — show timeline
- 2025-09-03 Price Changed $159,900 MRED as Distributed by MLS Grid
- 2025-06-10 Listing Removed — MRED as Distributed by MLS Grid
- 2025-06-10 Listed $164,900 MRED as Distributed by MLS Grid
- 2025-05-16 Price Changed — MRED as Distributed by MLS Grid
- 2025-04-21 Listed — MRED as Distributed by MLS Grid
- 2016-12-23 Sold (MLS) $22,000 MRED as Distributed by MLS Grid
- 2016-12-20 Pending — MRED as Distributed by MLS Grid
- 2016-10-14 Relisted — MRED as Distributed by MLS Grid
- 2016-09-22 Contingent — MRED as Distributed by MLS Grid
- 2016-09-20 Price Changed $27,000 MRED as Distributed by MLS Grid
- 2016-09-19 Relisted — MRED as Distributed by MLS Grid
- 2016-08-23 Contingent — MRED as Distributed by MLS Grid
- 2016-08-12 Relisted — MRED as Distributed by MLS Grid
- 2016-07-12 Contingent — MRED as Distributed by MLS Grid
- 2016-05-20 Listed $32,000 MRED as Distributed by MLS Grid
Property tax history
+6.4%/yrLatest (2023): $8,554 · +144.0% YoY. Source: county tax records.
Cash-flow waterfall
monthlySold comps — $/sqft
last 12 mo · ≤1 miLoading sold comps…