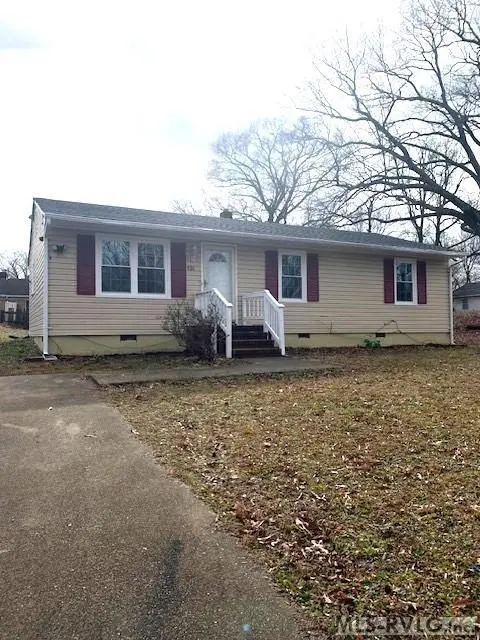
721 Parham St · Emporia, VA
Flood risk 1/10 · Minimal
- FEMA flood zone
- X (unshaded)
- Chance of flooding over 30 yrs
- 0.0%
- Est. flood insurance / yr
- $473 – $860
Fire risk 4/10 · Minor
- Est. fire insurance / yr
- $666 – $1,236
Heat risk 8/10 · Major
- Hot days now (above 108°F)
- 7 days/yr
- Hot days in 30 yrs
- 16 days/yr
Wind risk 6/10 · Moderate
- Chance of severe wind over 30 yrs
- 57.0%
Air-quality risk 1/10 · Minimal
- Unhealthy air days now
- 0 days/yr
- Unhealthy air days in 30 yrs
- 0 days/yr
Risk factors via First Street. Map © Google.
Why this score? — see what drove the C- grade
The composite is a weighted blend of 9 inputs, each scored 0–100. Each bar is that input's sub-score; the figure is the points it added to the 100-point composite (weight × sub-score).
- Cash flow +16.3/30.0
- ARV discount +14.8/15.0
- DSCR +5.0/10.0
- Schools +5.0/10.0
- 1% rule +3.3/10.0
- Livability +3.2/5.0
- Rent growth +2.5/5.0
- Condition / age +2.5/5.0
- Appreciation +0.0/10.0
$145,900
🖨 Deal sheet 📄 Offer letter ✓ Due diligence
Listing remarks MLS
Lots of upgrades in this ranch located within the city limits, offering close proximity to shopping, medical facilities, YMCA, restaurants, etc. Easy access to Interstate 95, Highway 58 and 301 for commuting. New replacement windows, new roof, new carpeting, new vinyl plank, new paint and more!!! Three bedrooms, one full hall bath, and eat-in kitchen.
Key facts
- New vinyl plank
- New carpeting
- New roof
Tags
Neighborhood map
What this means for you Summary
Snapshot
- This is a 3-bed/1.0-bath single-family listed at $146k.
Deal economics
- At list price, monthly cash flow is $79 ($949/yr) — positive.
- The deal already cash-flows at list — no discount required.
- To meet the 1% rule (rent ≥ 1% of price), the offer needs to be $122k (16.7% below list).
- Recommended offer: $122k (16.7% below list) — sets the bar for 1% rule.
- Cap rate 6.9% vs local median 4.3% in Emporia — top-decile yield for the area; either an underpriced asset or a hidden risk that comps aren't pricing in. Stress-test before assuming the spread holds.
Location & tenants
- Location reads 64/100 on livability (#370 in VA) — a middle-class / working-renter tenant base. Strengths: cost of living A+, health & safety A+; Watch: schools C-, crime F, amenities F.
- Market conditions: 36 active listings in the ZIP; 5 units permitted in Emporia city in 2024 (0 in 5+ unit buildings).
Forward outlook
- Local home prices are declining (-3.0%/yr); year-one equity from $1k of loan paydown is wiped out by about $4k of value loss. Plan a longer hold.
- Emporia County population projected at -15% by 2050 — secular population decline; favor cash flow + early exit over multi-decade hold.
Negotiation context
- It's been on market 122 days — a 12% lower offer ($128k) is reasonable based on typical stale-listing flexibility.
- 6 sale attempts since 3y ago with the ask held roughly flat each time — persistent listings suggest the price (not the market) is what's stuck; bring a comps-based counter.
- Current owner paid $55k; list at $146k implies a 165% gain — meaningful room to come down on a strong offer.
Risks & watch-outs
- Climate carrying-cost: major wind risk, 57% chance of damaging wind over 30y; extreme-heat days projected 7→16/yr by 2055 (HVAC capex compounding) — expect insurance premiums to compound above CPI over the hold.
Questions for the listing agent
- It's been on market 122 days. Have you received any prior offers? Is the seller open to a 17% concession, seller financing, or rate buy-down credit?
- Why hasn't it sold? Are there any deal-killer items the seller is aware of (foundation, flood, title, zoning, code violations)?
- Is there a deadline driving the sale (1031 exchange, divorce, estate, relocation)? That informs how much negotiation room exists.
- Crime grade is F in this area — have there been break-ins, vandalism, or insurance claims at this property in the last 3 years? What carrier currently insures it and at what premium?
- What's the average days-on-market for RENTAL listings here right now (not sales)? A rising rental-DOM trend means longer vacancies and softer asking-rent achievability than the comps imply.
- What's the recent tenant-quality profile in this submarket — average credit score on applications, eviction rate, late-payment / NSF rate, and stable-employment percentage? A property-management company in the area should have these aggregated.
- How much new for-sale + rental construction is in the pipeline within 1–3 miles? Heavy new supply typically softens prices + rents 12–24 months out; constrained supply supports both.
Investment metrics
- 1% rule
- 0.83% ✗
- Cap rate
- 6.94%
- Cash-on-cash
- 2.32%
- DSCR
- 1.10
- GRM
- 10.0
CMA / ARV
- ARV (median comp)
- $173,948
- List price
- $145,900
- Delta
- -16.12%
- Verdict
- UNDERPRICED
- Comps
- 20 within 1.0 mi
Show comp detail 11 sales within ~0.75 mi
| Address | Dist | Beds/Ba | Sqft | Sold | Price | $/sf | Match |
|---|---|---|---|---|---|---|---|
| 735 Halifax St | 0.12mi | 3/2.0 | 1,030 (+2%) | 20mo | $135,000 | $131 | 70 |
| 102 Russell Ln | 0.18mi | 3/1.5 | 967 (-4%) | 16mo | $140,000 | $145 | 69 |
| 102 Russell Ln | 0.18mi | 3/1.5 | 967 (-4%) | 16mo | $140,000 | $145 | 69 |
| 108 Russell Ln | 0.18mi | 3/2.0 | 970 (-4%) | 18mo | $160,000 | $165 | 66 |
| 605 High School St | 0.30mi | 3/2.0 | 1,080 (+7%) | 6mo | $193,000 | $179 | 65 |
| 103 Russell Ln | 0.16mi | 3/2.0 | 983 (-2%) | 23mo | $175,000 | $178 | 65 |
| 707 Parham St | 0.07mi | 3/2.0 | 1,092 (+8%) | 20mo | $144,200 | $132 | 62 |
| 352 3rd St | 0.56mi | 3/1.0 | 1,064 (+6%) | 5mo | $187,000 | $176 | 61 |
| 127 Harris Ave | 0.33mi | 3/2.0 | 1,122 (+11%) | 6mo | $145,000 | $129 | 56 |
| 813 Belden St | 0.29mi | 3/2.0 | 1,155 (+15%) | 11mo | $220,000 | $190 | 49 |
| 817 Belden St | 0.29mi | 3/2.0 | 1,155 (+15%) | 15mo | $220,000 | $190 | 46 |
Match score weights: distance 35% · size 25% · config 20% · recency 20%. Top-matched comps best support the ARV.
Projected returns pro-forma
-3.0% appreciation · 3.0% rent growth · sell at horizon
- IRR
- -12.7%
- Equity multiple
- 0.54×
- Total profit
- $-18,664
- Equity at exit
- $21,754
- IRR
- -3.7%
- Equity multiple
- 0.75×
- Total profit
- $-10,009
- Equity at exit
- $12,615
Cash invested: $40,852 (down + closing). Projections, not guarantees.
Landlord ↔ Tenant lean methodology
- Overall (STATE)
- 55 Moderately Landlord-Leaning
- State Virginia
- 55 Moderately Landlord-Leaning · D+2
- County
- — inherits STATE
- City
- — inherits STATE
ZIP-level market 23847
- Home prices YoY
- -22.8%
- Active inventory
- 36
- Price-to-rent
- 10.0×
Monthly cashflow live
- Estimated rent
- $1,215 medium interval (Pro) →
- Mortgage (P&I)
- −$765
- Tax from tax record
- −$55 /mo · $659/yr
- Insurance
- −$61
- HOA
- −$0
- Vacancy / Maint / Mgmt
- −$255
- Net cashflow
- $79
Break-even live
UW: 25.0% down · 7.5% · 30yr · 1.5% tax · 5.0% vac · 8.0% maint · 8.0% mgmt
Financing live
Cash to close
- Down payment
- $36,475
- Closing costs
- $4,377
- Reserves months
- —
- Total cash needed
- —
Loan-product check · same deal, 3 products live
Conventional
25% down · 7.5% · 30yr
- Down + closing
- —
- Monthly P&I
- —
- Monthly cashflow
- —
- DSCR
- —
- Eligible?
- —
Personal DTI + credit; lowest rate.
DSCR
20% down · 8.5% · 30yr
- Down + closing
- —
- Monthly P&I
- —
- Monthly cashflow
- —
- DSCR
- —
- Eligible?
- —
No personal income docs; deal must DSCR.
Hard money
10% down · 12.0% · 12mo
- Down + closing
- —
- Monthly P&I
- —
- Monthly cashflow
- —
- DSCR
- —
- Eligible?
- —
Short-term bridge; refi at stabilization.
Listing history 28 events
-
2026-06-18days on market $145,900 Active 122 DOM
-
2026-06-17days on market $145,900 Active 121 DOM
-
2026-06-16days on market $145,900 Active 120 DOM
-
2026-06-15days on market $145,900 Active 119 DOM
-
2026-06-15days on market $145,900 Active 118 DOM
-
2026-06-13days on market $145,900 Active 117 DOM
-
2026-06-12days on market $145,900 Active 116 DOM
-
2026-06-09days on market $145,900 Active 113 DOM
-
2026-06-08days on market $145,900 Active 112 DOM
-
2026-06-08days on market $145,900 Active 111 DOM
-
2026-06-05days on market $145,900 Active 109 DOM
-
2026-06-03days on market $145,900 Active 107 DOM
-
2026-06-02days on market $145,900 Active 106 DOM
-
2026-06-01days on market $145,900 Active 105 DOM
-
2026-05-31days on market $145,900 Active 104 DOM
-
2026-04-16price $145,900 353-char remark
Show marketing remark (353 chars)
Lots of upgrades in this ranch located within the city limits, offering close proximity to shopping, medical facilities, YMCA, restaurants, etc. Easy access to Interstate 95, Highway 58 and 301 for commuting. New replacement windows, new roof, new carpeting, new vinyl plank, new paint and more!!! Three bedrooms, one full hall bath, and eat-in kitchen.
-
2026-02-16$152,000 Active 353-char remark
Show marketing remark (353 chars)
Lots of upgrades in this ranch located within the city limits, offering close proximity to shopping, medical facilities, YMCA, restaurants, etc. Easy access to Interstate 95, Highway 58 and 301 for commuting. New replacement windows, new roof, new carpeting, new vinyl plank, new paint and more!!! Three bedrooms, one full hall bath, and eat-in kitchen.
-
2025-09-08status Active
-
2025-09-08price $152,000
-
2025-06-05$156,000 Active
-
2025-02-12$164,900 Active
-
2023-11-30soldstatus $55,000 Closed
-
2023-11-22status Pending
-
2023-11-22soldstatus $55,000 Closed
-
2023-09-27status Pending
-
2023-09-20status Active
-
2023-09-03status Pending
-
2023-09-02$65,000 Active
ⓘ Source: listings_history table (triggers on properties + properties_extension) + one-shot
backfill from property_details.listing_events for pre-trigger history.
Tax reassessment forecast VA · Resets to sale price
- Current annual tax
- $659 · $55/mo
- Projected year-2 tax
- $1,196 · $100/mo
- Expected delta
- +$538/yr (+$45/mo · 81.6%)
ⓘ Screening estimate from a state-policy table — verify with the county assessor before closing.
Climate risk First Street
- Flood 1/10 Low FEMA zone X (unshaded) · 0% chance over 30 yrs
- Wildfire 4/10 Moderate
- Heat 8/10 Severe 7 d/yr ≥108°F today · 16 d/yr by 30 yrs out
- Wind 6/10 Major 57% chance of damaging wind over 30 yrs
- Air quality 1/10 Low 0 unhealthy d/yr today · 0 by 30 yrs out
Nearby sold comps map
Loading sold comps map…
Walkable amenities ~0.75 mi
Loading nearby amenities…
Taxation est. · year 1
- Rental income
- $14,581
- − Mortgage interest
- −$8,173
- − Property taxes
- −$659
- − Insurance
- −$730
- − Repairs & maintenance
- −$1,166
- − Management
- −$1,166
- − Depreciation
- −$4,244
- Taxable loss
- −$1,557
- Est. tax savings @ 24.0%
- +$374
- After-tax cash flow
- $1,323/yr
For passive investors: Depreciation is non-cash, so a rental often shows a tax loss while cash-flowing — sheltering income. Rental losses are passive: they offset passive income freely, and up to $25,000/yr can offset ordinary (W-2) income if you actively participate and your MAGI is under $100k (phasing out to $0 by $150k); unused losses carry forward. On sale, claimed depreciation is recaptured at up to 25%, and gains may owe capital-gains tax (a 1031 exchange can defer both). Figures are a year-1 estimate at your 24.0% rate — not tax advice; consult a CPA.
Schools (NCES district)
No district data.
Livability — Emporia
- Score
- 64/100
- State rank
- #370
- US rank
- #14846
Category grades
Schools grade is shown separately in the Schools card above.
Census & demographics
- Census place
- Emporia, VA
- Population (ZIP)
- 13,346
Population outlook (Emporia County) Hauer SSP2
- Today (2025)
- 5,078 people
- By 2030
- 4,892 · -3.7%
- By 2040
- 4,580 · -9.8%
- By 2050
- 4,335 · -14.6%
- By 2075
- 3,899 · -23.2%
- By 2100
- 3,646 · -28.2%
Race, ethnicity, and origin ACS 2023
- Neighborhood character
- Majority Black (62%)
- Race & ethnicity
- Black 62% White 27% Two or more races 9% Hispanic / Latino 5%
- Hispanic origin (detail)
- Common ancestry
- Slovak 1% Italian 1%
- Foreign-born
- 5% · Canada
- Languages at home
- 92% English-only · Spanish 5% Arabic 2%
Political lean MEDSL · Emporia
- 2024 margin
- Solid D (+31.0) · D 65.2% · R 34.2%
- 2008→2024 swing
- +0.2pp no change · 2008: 30.8pp · 2024: 31.0pp
- All cycles
- 2024: D+31.0 2020: D+36.0 2016: D+31.2 2012: D+33.7 2008: D+30.8
Not yet ingested
- Civics
- —
Market trends
- HPI YoY
- ▼ -48.80%
- Current HPI
- 165.052
- Rent YoY
- —
- Metro
- —
- State GDP YoY
- ▲ 2.40%
- F500 in state
- 50
Industry mix (Fortune 500 HQ in VA)
| Industry | F500 HQs | Revenue |
|---|---|---|
| Aerospace / Defense | 4 | $236B |
|
||
| Technology / Defense | 3 | $32B |
|
||
| Financial Services | 2 | $176B |
|
||
| Utilities | 2 | $27B |
|
||
| Insurance | 2 | $25B |
|
||
| Technology | 2 | $15B |
|
||
Price history
+124.5% since first listed13 events — show timeline
- 2026-04-16 Price Changed $145,900 RVLG
- 2026-02-16 Listed $152,000 RVLG
- 2025-09-08 Relisted — RVLG
- 2025-09-08 Price Changed $152,000 RVLG
- 2025-06-05 Listed $156,000 RVLG
- 2025-02-12 Listed $164,900 RVLG
- 2023-11-30 Sold (MLS) $55,000 RVLG
- 2023-11-22 Pending — RVLG
- 2023-11-22 Sold (MLS) $55,000 RVLG
- 2023-09-27 Pending — RVLG
- 2023-09-20 Relisted — RVLG
- 2023-09-03 Pending — RVLG
- 2023-09-02 Listed $65,000 RVLG
Property tax history
+2.6%/yrLatest (2025): $659 · +0.0% YoY. Source: county tax records.
Cash-flow waterfall
monthlySold comps — $/sqft
last 12 mo · ≤1 miLoading sold comps…