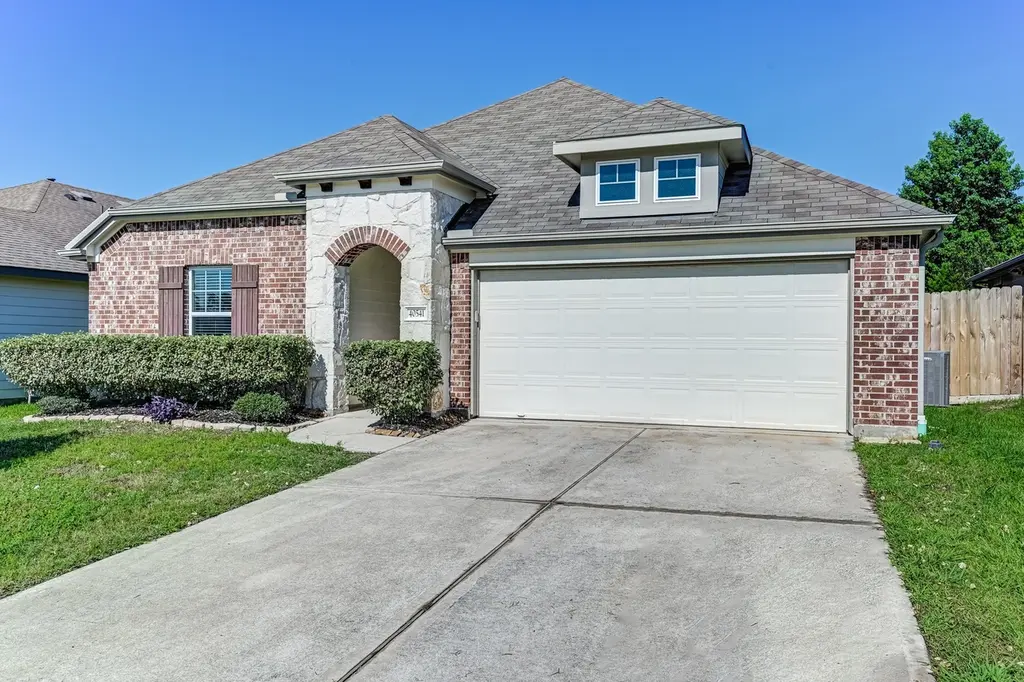
40541 Mostyn Lake Dr · Magnolia, TX
Flood risk 1/10 · Minimal
- FEMA flood zone
- X (unshaded)
- Chance of flooding over 30 yrs
- 0.0%
- Est. flood insurance / yr
- $507 – $1,088
Fire risk 5/10 · Moderate
- Est. fire insurance / yr
- $1,222 – $2,270
Heat risk 9/10 · Severe
- Hot days now (above 111°F)
- 7 days/yr
- Hot days in 30 yrs
- 25 days/yr
Wind risk 8/10 · Major
- Chance of severe wind over 30 yrs
- 99.0%
Air-quality risk 2/10 · Minimal
- Unhealthy air days now
- 2 days/yr
- Unhealthy air days in 30 yrs
- 2 days/yr
Risk factors via First Street. Map © Google.
Why this score? — see what drove the D grade
The composite is a weighted blend of 9 inputs, each scored 0–100. Each bar is that input's sub-score; the figure is the points it added to the 100-point composite (weight × sub-score).
- ARV discount +11.7/15.0
- Appreciation +10.0/10.0
- Cash flow +5.9/30.0
- Schools +3.9/10.0
- Livability +3.7/5.0
- 1% rule +3.2/10.0
- Rent growth +2.6/5.0
- Condition / age +2.5/5.0
- DSCR +0.3/10.0
$259,900
🖨 Deal sheet 📄 Offer letter ✓ Due diligence
Listing remarks MLS
One of our most popular plans with 3 bedrooms and 2 bathrooms, the master suite is a generous size bedroom and so is the covered patio, oversized shower at the master bathroom and a beautiful kitchen with upgraded cabinets and exquisite backs plash details and stainless steel appliances. The 2" faux wood blinds throughout gives this home additional privacy. A true Gem!
Key facts
- Wooded surroundings
- Island kitchen
- Covered patio
Tags
Property features AI
Finance
- Other: Lease not considered
Exterior
- Parking: Attached 2-car garage; Driveway
- Security: Smoke detectors
- Utilities: Public water; Public sewer
- Home design: Residential property; Built in 2020; Slab foundation; Composition roof
- Construction: Brick, stone, and wood siding exterior
- Exterior features: Covered patio; Patio; Deck; Private yard; Back yard fence; Subdivision setting; Concrete road access
Interior
- Kitchen: Dishwasher; Disposal; Gas range; Microwave; Oven
- Bedrooms: 7 total rooms
- Flooring: Carpet; Laminate; Tile
- Bathrooms: 2 full bathrooms
- Heating & cooling: Central heating (gas); Central air (electric); Thermostat (programmable)
- Interior features: Double vanity; Marble counters; Ceiling fans; Programmable thermostat
- Laundry & utility: Washer hookup; Electric dryer hookup
Neighborhood map
What this means for you Summary
Snapshot
- This is a 3-bed/2.0-bath single-family listed at $260k.
Deal economics
- At list price, monthly cash flow is $-506 ($-6k/yr) — negative.
- To cash-flow at today's rent, offer at most $174k (33.2% below list).
- To meet the 1% rule (rent ≥ 1% of price), the offer needs to be $214k (17.8% below list).
- Recommended offer: $174k (33.2% below list) — sets the bar for cash-flow.
Location & tenants
- Location reads 73/100 on livability (#222 in TX) — a middle-class / working-renter tenant base. Strengths: crime A+, cost of living A+, housing A+; Watch: amenities F, commute F.
- Magnolia ISD (rural): math 42% / reading 45% proficiency, ranked #247 of 826 in TX (top 30%) — families likely to look elsewhere, expect single-tenant / working-renter base with shorter leases.
- Zoned schools: Magnolia Parkway El (math 38% / reading 46%, grade F, #1,335 of 4,322 statewide, top 33%, 776 students, 45% FRL); Magnolia H S (math 47% / reading 62%, grade C-, #379 of 1,632 statewide, top 26%, 2,248 students, 31% FRL) — zoned schools at 38% FRL track the district average.
- Market conditions: Rents flat; 1604 active listings in the ZIP; 2 comparable units currently listed for rent nearby; high-income renter base; 13,259 units permitted in Montgomery County in 2024 (1,402 in 5+ unit buildings).
Forward outlook
- In year one you build about $28k of equity ($2k loan paydown + $26k appreciation (10.0% local appreciation)).
- Montgomery County population projected at +65% by 2050 — long-run rental-demand tailwind backs the buy-and-hold thesis.
- By year 2, paydown + projected appreciation supports a ~$45k cash-out refi (75% LTV) — recoverable capital for the next deal without selling this one.
Negotiation context
- It's been on market 17 days — a 2% lower offer ($256k) is reasonable based on typical stale-listing flexibility.
- 2 sale attempts since 6y ago with the ask held roughly flat each time — persistent listings suggest the price (not the market) is what's stuck; bring a comps-based counter.
Risks & watch-outs
- Watch-outs: property tax is 3.3% of price.
- Climate carrying-cost: severe wind risk, 99% chance of damaging wind over 30y; moderate wildfire risk; extreme-heat days projected 7→25/yr by 2055 (HVAC capex compounding) — expect insurance premiums to compound above CPI over the hold.
Questions for the listing agent
- What do current leases actually rent for vs. the listed asking? Can we see a recent rent roll and the last 12 months of T-12 income?
- Property tax is high relative to price — has the assessment been appealed recently, and will the sale trigger a re-assessment?
- Is there a deadline driving the sale (1031 exchange, divorce, estate, relocation)? That informs how much negotiation room exists.
- Schools are D-rated, which usually means shorter tenancies and higher turnover. Who's the typical renter profile here, and what's been the actual vacancy rate?
- The area grade is low — what's the realistic commute time and amenity access for the typical tenant pool here? Any planned neighborhood developments (good or bad) we should know about?
- What's the average days-on-market for RENTAL listings here right now (not sales)? A rising rental-DOM trend means longer vacancies and softer asking-rent achievability than the comps imply.
- What's the recent tenant-quality profile in this submarket — average credit score on applications, eviction rate, late-payment / NSF rate, and stable-employment percentage? A property-management company in the area should have these aggregated.
- How much new for-sale + rental construction is in the pipeline within 1–3 miles? Heavy new supply typically softens prices + rents 12–24 months out; constrained supply supports both.
Investment metrics
- 1% rule
- 0.82% ✗
- Cap rate
- 3.96%
- Cash-on-cash
- -8.34%
- DSCR
- 0.63
- GRM
- 10.1
CMA / ARV
- ARV (on-the-fly)
- $286,902
- Comps found
- 12
Show comp detail 12 sales within ~0.75 mi
| Address | Dist | Beds/Ba | Sqft | Sold | Price | $/sf | Match |
|---|---|---|---|---|---|---|---|
| 12743 Dina Springs Ln | 0.15mi | 3/2.0 | 1,810 (+2%) | 1mo | $254,990 | $141 | 89 |
| 40639 Mostyn Lake Dr | 0.22mi | 4/2.0 (+1) | 1,748 (-1%) | 5mo | $282,990 | $162 | 78 |
| 40494 Mostyn Lake Dr | 0.12mi | 3/2.0 | 1,640 (-7%) | 6mo | $269,000 | $164 | 78 |
| 40696 Pessi Rd | 0.31mi | 4/2.0 (+1) | 1,748 (-1%) | 6mo | $282,990 | $162 | 73 |
| 12759 Dina Springs Ln | 0.13mi | 4/2.0 (+1) | 1,597 (-10%) | 1mo | $268,990 | $168 | 72 |
| 12739 Dina Springs Ln | 0.16mi | 3/2.0 | 1,606 (-9%) | 6mo | $267,990 | $167 | 72 |
| 12751 Dina Springs Ln | 0.14mi | 4/2.0 (+1) | 1,978 (+12%) | 0mo | $269,990 | $136 | 69 |
| 40716 Pessi Rd | 0.34mi | 4/2.5 (+1) | 1,889 (+7%) | 2mo | $268,990 | $142 | 65 |
| 13082 Sarah Springs Way | 0.31mi | 3/2.0 | 1,518 (-14%) | 5mo | $244,990 | $161 | 58 |
| 12735 Dina Springs Ln | 0.16mi | 4/3.0 (+1) | 2,026 (+14%) | 3mo | $319,990 | $158 | 57 |
| 40723 Mostyn Lake Dr | 0.33mi | 3/2.0 | 1,518 (-14%) | 6mo | $252,990 | $167 | 56 |
| 40756 Mostyn Lake Dr | 0.37mi | 4/3.5 (+1) | 2,035 (+15%) | 4mo | $309,000 | $152 | 44 |
Match score weights: distance 35% · size 25% · config 20% · recency 20%. Top-matched comps best support the ARV.
Projected returns pro-forma
10.0% appreciation · 0.32% rent growth · sell at horizon
- IRR
- 17.6%
- Equity multiple
- 2.43×
- Total profit
- $103,991
- Equity at exit
- $234,139
- IRR
- 16.0%
- Equity multiple
- 5.42×
- Total profit
- $321,937
- Equity at exit
- $504,929
Cash invested: $72,772 (down + closing). Projections, not guarantees.
Landlord ↔ Tenant lean methodology
- Overall (STATE)
- 87 Strongly Landlord-Friendly
- State Texas
- 87 Strongly Landlord-Friendly · R+5
- County
- — inherits STATE
- City
- — inherits STATE
ZIP-level market 77354
- Home prices YoY
- 2.4%
- Rents YoY
- 0.3%
- Active inventory
- 1604
- Price-to-rent
- 10.1×
Monthly cashflow live
- Estimated rent
- $2,137 medium interval (Pro) →
- Mortgage (P&I)
- −$1,363
- Tax from tax record
- −$723 /mo · $8,679/yr
- Insurance
- −$108
- HOA
- −$0
- Vacancy / Maint / Mgmt
- −$449
- Net cashflow
- $-506
Break-even live
UW: 25.0% down · 7.5% · 30yr · 1.5% tax · 5.0% vac · 8.0% maint · 8.0% mgmt
Financing live
Cash to close
- Down payment
- $64,975
- Closing costs
- $7,797
- Reserves months
- —
- Total cash needed
- —
Loan-product check · same deal, 3 products live
Conventional
25% down · 7.5% · 30yr
- Down + closing
- —
- Monthly P&I
- —
- Monthly cashflow
- —
- DSCR
- —
- Eligible?
- —
Personal DTI + credit; lowest rate.
DSCR
20% down · 8.5% · 30yr
- Down + closing
- —
- Monthly P&I
- —
- Monthly cashflow
- —
- DSCR
- —
- Eligible?
- —
No personal income docs; deal must DSCR.
Hard money
10% down · 12.0% · 12mo
- Down + closing
- —
- Monthly P&I
- —
- Monthly cashflow
- —
- DSCR
- —
- Eligible?
- —
Short-term bridge; refi at stabilization.
Rent comps 2 comps
| Address | Beds | Baths | Sqft | Rent | $/sqft | DOM | Units | Dist |
|---|---|---|---|---|---|---|---|---|
| 40700 Pessi Rd Magnolia, TX | 3.0 | 2.0 | 1240 | $2,100 | $1.69 | 44d | 1 | 0.28mi |
| 4225 Magnolia Village Dr Magnolia, TX | 1.0–2.0 | 1.0–2.0 | 994 | $1,992 | $2.00 | 2d | 31 | 1.09mi |
Listing history 12 events
-
2026-06-18days on market $259,900 Active 17 DOM
-
2026-06-17days on market $259,900 Active 16 DOM
-
2026-06-16days on market $259,900 Active 15 DOM
-
2026-06-15days on market $259,900 Active 14 DOM
-
2026-06-13days on market $259,900 Active 12 DOM
-
2026-06-09days on market $259,900 Active 8 DOM
-
2026-06-08days on market $259,900 Active 7 DOM
-
2026-06-07days on market $259,900 Active 6 DOM
-
2026-06-04days on market $259,900 Active 3 DOM
-
2026-06-03days on market $259,900 Active 2 DOM
-
2026-06-02remarks 693-char remark
-
2026-06-02$259,900 Active 1 DOM
ⓘ Source: listings_history table (triggers on properties + properties_extension) + one-shot
backfill from property_details.listing_events for pre-trigger history.
Tax reassessment forecast TX · Resets to sale price
- Current annual tax
- $8,679 · $723/mo
- Projected year-2 tax
- $8,679 · $723/mo
- Expected delta
- $0/yr ($0/mo · 0.0%)
ⓘ Screening estimate from a state-policy table — verify with the county assessor before closing.
Climate risk First Street
- Flood 1/10 Low FEMA zone X (unshaded) · 0% chance over 30 yrs
- Wildfire 5/10 Major
- Heat 9/10 Extreme 7 d/yr ≥111°F today · 25 d/yr by 30 yrs out
- Wind 8/10 Severe 99% chance of damaging wind over 30 yrs
- Air quality 2/10 Low 2 unhealthy d/yr today · 2 by 30 yrs out
Nearby sold comps map
Loading sold comps map…
Walkable amenities ~0.75 mi
Loading nearby amenities…
Taxation est. · year 1
- Rental income
- $25,649
- − Mortgage interest
- −$14,558
- − Property taxes
- −$8,679
- − Insurance
- −$1,300
- − Repairs & maintenance
- −$2,052
- − Management
- −$2,052
- − Depreciation
- −$7,561
- Taxable loss
- −$10,552
- Est. tax savings @ 24.0%
- +$2,533
- After-tax cash flow
- $-3,538/yr
For passive investors: Depreciation is non-cash, so a rental often shows a tax loss while cash-flowing — sheltering income. Rental losses are passive: they offset passive income freely, and up to $25,000/yr can offset ordinary (W-2) income if you actively participate and your MAGI is under $100k (phasing out to $0 by $150k); unused losses carry forward. On sale, claimed depreciation is recaptured at up to 25%, and gains may owe capital-gains tax (a 1031 exchange can defer both). Figures are a year-1 estimate at your 24.0% rate — not tax advice; consult a CPA.
Schools (NCES district)
- District
- Magnolia ISD
- NCES district ID
- 4828740
- Math proficiency
- 42% ▼ -7.00%
- Reading proficiency
- 45% ▼ -4.00%
- Median HH income
- $71,692
- Composite
- 39.46/100
- National rank
- #3958
- State rank
- #247 of 826 in TX
Livability — Magnolia
- Score
- 73/100
- State rank
- #222
- US rank
- #5442
Category grades
Schools grade is shown separately in the Schools card above.
Census & demographics
- County
- Montgomery County · 663,713 people
- City population
- 32,847
- Metro
- Houston-The Woodlands-Sugar Land, TX
- Population (ZIP)
- 44,900
- Household income
- $112,504
- Rent vs Own
- Severe rent burden
- 586.0
Population outlook (Montgomery County) Hauer SSP2
- Today (2025)
- 713,896 people
- By 2030
- 805,263 · +12.8%
- By 2040
- 992,708 · +39.1%
- By 2050
- 1,179,590 · +65.2%
- By 2075
- 1,628,084 · +128.1%
- By 2100
- 1,937,880 · +171.5%
Race, ethnicity, and origin ACS 2023
- Neighborhood character
- Predominantly White (66%)
- Race & ethnicity
- White 66% Hispanic / Latino 25% Two or more races 18% Black 3% Asian 1%
- Hispanic origin (detail)
- Mexican 14% Puerto Rican 1%
- Common ancestry
- Lithuanian 4% Slovak 2% Italian 2%
- Foreign-born
- 11% · Canada, Vietnam
- Languages at home
- 83% English-only · Spanish 15% Other Indo-European 1% German/W. Germanic 1%
Political lean MEDSL · Montgomery
- 2024 margin
- Solid R (+45.5) · D 26.8% · R 72.3%
- 2008→2024 swing
- +7.2pp toward D · 2008: -52.7pp · 2024: -45.5pp
- All cycles
- 2024: R+45.5 2020: R+43.8 2016: R+51.4 2012: R+60.7 2008: R+52.7
Not yet ingested
- Civics
- —
Market trends
- HPI YoY
- ▲ 12.09%
- Current HPI
- 512.87
- Rent YoY
- ▲ 0.32%
- Metro
- Houston-The Woodlands-Sugar Land, TX
- State GDP YoY
- ▲ 3.95%
- F500 in state
- 110
Industry mix (Fortune 500 HQ in TX)
| Industry | F500 HQs | Revenue |
|---|---|---|
| Energy | 16 | $1,198B |
|
||
| Technology | 5 | $198B |
|
||
| Engineering / Construction | 4 | $72B |
|
||
| Energy Services | 3 | $60B |
|
||
| Utilities | 3 | $41B |
|
||
| Healthcare | 2 | $330B |
|
||
Price history
+13.1% since first listed5 events — show timeline
- 2026-06-01 Listed $259,900 HARMLS
- 2021-01-11 Sold (MLS) — HARMLS
- 2020-12-21 Pending — HARMLS
- 2020-12-17 Price Changed $216,990 HARMLS
- 2020-12-15 Listed $229,794 HARMLS
Property tax history
+66.7%/yrLatest (2025): $8,679 · +3.3% YoY. Source: county tax records.
Cash-flow waterfall
monthlySold comps — $/sqft
last 12 mo · ≤1 miLoading sold comps…