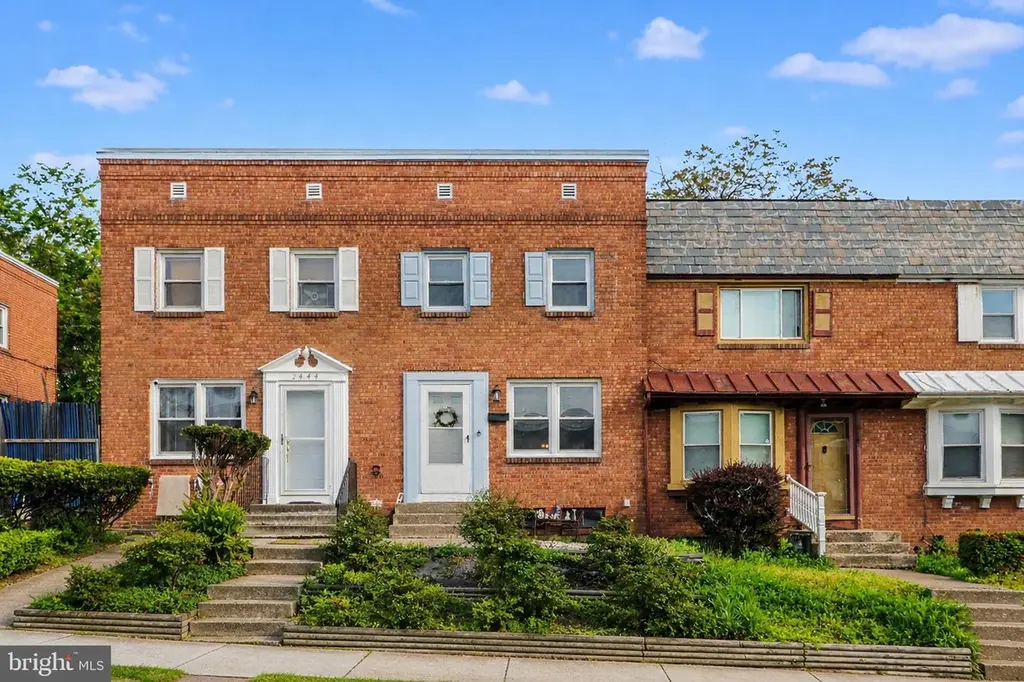
2446 Brookwood St · Harrisburg, PA
Flood risk 1/10 · Minimal
- FEMA flood zone
- X (unshaded)
- Chance of flooding over 30 yrs
- 0.0%
- Est. flood insurance / yr
- $473 – $860
Fire risk 1/10 · Minimal
- Est. fire insurance / yr
- $511 – $949
Heat risk 5/10 · Moderate
- Hot days now (above 100°F)
- 7 days/yr
- Hot days in 30 yrs
- 15 days/yr
Wind risk 3/10 · Minor
- Chance of severe wind over 30 yrs
- 6.0%
Air-quality risk 3/10 · Minor
- Unhealthy air days now
- 2 days/yr
- Unhealthy air days in 30 yrs
- 4 days/yr
Risk factors via First Street. Map © Google.
Why this score? — see what drove the D grade
The composite is a weighted blend of 9 inputs, each scored 0–100. Each bar is that input's sub-score; the figure is the points it added to the 100-point composite (weight × sub-score).
- Cash flow +17.9/30.0
- DSCR +5.6/10.0
- 1% rule +5.5/10.0
- Livability +4.2/5.0
- Rent growth +3.6/5.0
- Condition / age +2.5/5.0
- ARV discount +1.4/15.0
- Schools +0.8/10.0
- Appreciation +0.0/10.0
$140,000
🖨 Deal sheet 📄 Offer letter ✓ Due diligence
Listing remarks
Welcome to 2446 Brookwood Street in Harrisburg—a well-maintained, two-owner home that offers comfort, character, and great value. This inviting property features three bedrooms and one full bath, making it an excellent fit for first-time buyers, downsizers, or anyone looking for a solid, move-in-ready home. Inside, you’ll find a warm and cozy layout with plenty of natural light. The partially finished basement adds additional space—perfect for a family room, home office, gym, or additional storage. Bonus: all furniture in home is abled to be purchased. Outside, the home continues to impress with its tidy exterior and established setting, reflecting years of pride in owners
Key facts
- Built 1955
- Listed 3 days
Property features AI
Exterior
- Parking: On-street parking
- Utilities: Public water; Public sewer; 100 amp electric service; Natural gas hot water
- Home design: Interior townhouse/rowhouse; Fee simple ownership
- Construction: Brick construction; Block foundation; Shingle roof; Built year per assessor
- Exterior features: Not in a federal flood zone
Interior
- Bedrooms: Three bedrooms on the upper level
- Bathrooms: One full bathroom
- Heating & cooling: Forced air heating (natural gas); Central air conditioning
- Interior features: Partially finished basement; Living area information from assessor
Neighborhood map
What this means for you Summary
Snapshot
- This is a 3-bed/1.0-bath townhouse listed at $140k.
Deal economics
- At list price, monthly cash flow is $117 ($1k/yr) — positive.
- The deal already cash-flows at list — no discount required.
- Meets the 1% rule at list price ($1k rent vs $140k).
Location & tenants
- Location reads 84/100 on livability (#107 in PA, #826 nationally) — a professional / high-income tenant draw. Strengths: amenities A+, commute A+, cost of living A+; Watch: employment D, crime F.
- Harrisburg City SD (urban): math 6% / reading 13% proficiency, ranked #535 of 539 in PA (top 99%) — low school quality limits family demand, transient renter base, plan for 1-2y turnover; 82% free/reduced lunch — lower-income household profile, screen leases tightly.
- Zoned schools: Harrisburg Hs (math 24% / reading 10%, grade F, #399 of 437 statewide, top 92%, 1,230 students, 100% FRL) — zoned schools average 100% FRL vs 82% district-wide (18 pts higher); higher-poverty schools than district average — tighter screening recommended.
- Market conditions: Rents rising fast (+4.4%/yr); 67 active listings in the ZIP; 21 comparable units currently listed for rent nearby; rentals lingering (median 44d on market — plan ~5-8 weeks vacancy on turnover, expect pricing pressure); 52% of comp listings sitting > 30 days — soft ceiling on asking rent; 540 units permitted in Dauphin County in 2024 (194 in 5+ unit buildings).
- This rent runs 38% of the median local income ($47k/yr) — at the standard rent-burdened threshold; future hikes will face affordability resistance.
Forward outlook
- Local home prices are declining (-3.0%/yr); year-one equity from $968 of loan paydown is wiped out by about $4k of value loss. Plan a longer hold.
Negotiation context
- Only 3 days on market — expect competitive offers; lowballing is unlikely to land.
Risks & watch-outs
- Watch-outs: built in 1955 — expect roof / HVAC / electrical / plumbing capex.
- Climate carrying-cost: extreme-heat days projected 7→15/yr by 2055 (HVAC capex compounding) — expect insurance premiums to compound above CPI over the hold.
Questions for the listing agent
- Built in 1955 — when were the roof, HVAC, electrical panel, plumbing, and water heater last replaced?
- Is there a deadline driving the sale (1031 exchange, divorce, estate, relocation)? That informs how much negotiation room exists.
- Crime grade is F in this area — have there been break-ins, vandalism, or insurance claims at this property in the last 3 years? What carrier currently insures it and at what premium?
- The area grade is low — what's the realistic commute time and amenity access for the typical tenant pool here? Any planned neighborhood developments (good or bad) we should know about?
- What's the average days-on-market for RENTAL listings here right now (not sales)? A rising rental-DOM trend means longer vacancies and softer asking-rent achievability than the comps imply.
- What's the recent tenant-quality profile in this submarket — average credit score on applications, eviction rate, late-payment / NSF rate, and stable-employment percentage? A property-management company in the area should have these aggregated.
- How much new for-sale + rental construction is in the pipeline within 1–3 miles? Heavy new supply typically softens prices + rents 12–24 months out; constrained supply supports both.
Investment metrics
- 1% rule
- 1.05% ✓
- Cap rate
- 7.30%
- Cash-on-cash
- 3.59%
- DSCR
- 1.16
- GRM
- 7.9
CMA / ARV
- ARV (median comp)
- $123,257
- List price
- $140,000
- Delta
- 13.58%
- Verdict
- OVERPRICED
- Comps
- 20 within 1.0 mi
Show comp detail 12 sales within ~0.75 mi
| Address | Dist | Beds/Ba | Sqft | Sold | Price | $/sf | Match |
|---|---|---|---|---|---|---|---|
| 2446 Brookwood St | 0.00mi | 3/1.0 | 1,422 (0%) | 0mo | $147,700 | $104 | 100 |
| 2714 Greenwood St | 0.28mi | 3/1.0 | 1,309 (-8%) | 1mo | $155,000 | $118 | 73 |
| 2117 Brookwood St | 0.37mi | 3/1.5 | 1,365 (-4%) | 3mo | $170,000 | $125 | 72 |
| 2309 Luce St | 0.28mi | 3/1.0 | 1,300 (-9%) | 2mo | $130,000 | $100 | 71 |
| 2959 Rumson Dr | 0.55mi | 3/1.5 | 1,404 (-1%) | 2mo | $168,000 | $120 | 69 |
| 304 N 30th St | 0.32mi | 3/2.0 | 1,305 (-8%) | 0mo | $195,000 | $149 | 67 |
| 2106 Berryhill St | 0.44mi | 3/1.0 | 1,324 (-7%) | 3mo | $125,000 | $94 | 65 |
| 2134 Swatara St | 0.44mi | 3/1.0 | 1,288 (-9%) | 2mo | $154,900 | $120 | 62 |
| 224 Yale St | 0.74mi | 3/1.0 | 1,440 (+1%) | 3mo | $125,900 | $87 | 61 |
| 409 S 19th St | 0.69mi | 3/2.5 | 1,426 (+0%) | 1mo | $141,000 | $99 | 60 |
| 2130 Kensington St | 0.42mi | 3/1.0 | 1,605 (+13%) | 2mo | $135,000 | $84 | 57 |
| 1939 Swatara St | 0.63mi | 3/1.0 | 1,208 (-15%) | 4mo | $145,000 | $120 | 42 |
Match score weights: distance 35% · size 25% · config 20% · recency 20%. Top-matched comps best support the ARV.
Projected returns pro-forma
-3.0% appreciation · 4.43% rent growth · sell at horizon
- IRR
- -8.9%
- Equity multiple
- 0.67×
- Total profit
- $-13,009
- Equity at exit
- $20,874
- IRR
- 2.5%
- Equity multiple
- 1.19×
- Total profit
- $7,617
- Equity at exit
- $12,105
Cash invested: $39,200 (down + closing). Projections, not guarantees.
Landlord ↔ Tenant lean methodology
- Overall (STATE)
- 62 Landlord-Friendly
- State Pennsylvania
- 62 Landlord-Friendly · EVEN
- County
- — inherits STATE
- City
- — inherits STATE
ZIP-level market 17104
- Home prices YoY
- -6.3%
- Rents YoY
- 4.4%
- Active inventory
- 67
- Price-to-rent
- 7.9×
Monthly cashflow live
- Estimated rent
- $1,468 high interval (Pro) →
- Mortgage (P&I)
- −$734
- Tax from tax record
- −$250 /mo · $3,003/yr
- Insurance
- −$58
- HOA
- −$0
- Vacancy / Maint / Mgmt
- −$308
- Net cashflow
- $117
Break-even live
UW: 25.0% down · 7.5% · 30yr · 1.5% tax · 5.0% vac · 8.0% maint · 8.0% mgmt
Financing live
Cash to close
- Down payment
- $35,000
- Closing costs
- $4,200
- Reserves months
- —
- Total cash needed
- —
Loan-product check · same deal, 3 products live
Conventional
25% down · 7.5% · 30yr
- Down + closing
- —
- Monthly P&I
- —
- Monthly cashflow
- —
- DSCR
- —
- Eligible?
- —
Personal DTI + credit; lowest rate.
DSCR
20% down · 8.5% · 30yr
- Down + closing
- —
- Monthly P&I
- —
- Monthly cashflow
- —
- DSCR
- —
- Eligible?
- —
No personal income docs; deal must DSCR.
Hard money
10% down · 12.0% · 12mo
- Down + closing
- —
- Monthly P&I
- —
- Monthly cashflow
- —
- DSCR
- —
- Eligible?
- —
Short-term bridge; refi at stabilization.
Rent comps 21 comps
| Address | Beds | Baths | Sqft | Rent | $/sqft | DOM | Units | Dist |
|---|---|---|---|---|---|---|---|---|
| 2410 Kensington St Harrisburg, PA | 3.0 | 1.0 | 1024 | $1,495 | $1.46 | 43d | 1 | 0.21mi |
| 649 S 23rd St Unit 1 Harrisburg, PA | 3.0 | 1.0 | 1450 | $1,465 | $1.01 | 43d | 1 | 0.22mi |
| 649 S 23rd St Harrisburg, PA | 3.0 | 1.0 | 1450 | $1,465 | $1.01 | 21d | 1 | 0.22mi |
| 2121 Kensington St Harrisburg, PA | 3.0 | 1.0 | 1088 | $1,450 | $1.33 | 43d | 1 | 0.44mi |
| 2016 Swatara St Harrisburg, PA | 3.0 | 1.0 | 1380 | $1,175 | $0.85 | 43d | 1 | 0.58mi |
| 3106 Hoffer St Unit 3106 Penbrook, PA | 2.0 | 1.0 | 900 | $1,675 | $1.86 | 14d | 1 | 0.77mi |
| 1728 Paxton St Harrisburg, PA | 3.0 | 1.5 | 1320 | $1,295 | $0.98 | 14d | 1 | 0.87mi |
| 1615 Naudain St Harrisburg, PA | 3.0 | 1.0 | 1148 | $1,400 | $1.22 | 43d | 1 | 0.94mi |
| 1610 Hunter St Harrisburg, PA | 4.0 | 1.0 | 1776 | $1,450 | $0.82 | 23d | 1 | 0.94mi |
| 337 S 15th St Harrisburg, PA | 3.0 | 1.0 | 1440 | $1,195 | $0.83 | 21d | 1 | 1.06mi |
| 1429 Naudain St Harrisburg, PA | 3.0 | 1.0 | 1254 | $1,400 | $1.12 | 23d | 1 | 1.07mi |
| 52 N 18th St Harrisburg, PA | 3.0 | 1.0 | 1100 | $1,250 | $1.14 | 14d | 1 | 1.10mi |
| 349 S 14th St Harrisburg, PA | 3.0 | 1.0 | 1544 | $1,450 | $0.94 | 23d | 1 | 1.13mi |
| 589 Yale St Harrisburg, PA | 2.0 | 2.0 | 911 | $1,549 | $1.70 | 14d | 1 | 1.22mi |
| 331 Hummel St Unit B Harrisburg, PA | 3.0 | 1.0 | 1590 | $1,800 | $1.13 | 43d | 1 | 1.27mi |
| 331 Hummel St Unit A Harrisburg, PA | 2.0 | 1.0 | 1590 | $1,400 | $0.88 | 43d | 1 | 1.27mi |
| 1517 Walnut St Harrisburg, PA | 3.0 | 1.0 | 1172 | $1,150 | $0.98 | 43d | 1 | 1.30mi |
| 1251 Bailey St Harrisburg, PA | 3.0 | 1.0 | 1200 | $1,500 | $1.25 | 43d | 1 | 1.39mi |
| 1207 Market St Harrisburg, PA | 4.0 | 1.5 | 1423 | $1,995 | $1.40 | 43d | 1 | 1.41mi |
| 1139 Mulberry St Harrisburg, PA | 1.0–3.0 | 1.0 | 900 | $1,185 | $1.32 | 43d | 1 | 1.43mi |
| 21 Summit St Harrisburg, PA | 3.0 | 1.0 | 1200 | $1,550 | $1.29 | 14d | 1 | 1.45mi |
Listing history 3 events
-
2026-05-08status Pending 978-char remark
-
2026-05-06$140,000 Active 978-char remark
-
2026-05-05historical $140,000 978-char remark
ⓘ Source: listings_history table (triggers on properties + properties_extension) + one-shot
backfill from property_details.listing_events for pre-trigger history.
Tax reassessment forecast PA · Partial reset (capped growth)
- Current annual tax
- $3,003 · $250/mo
- Projected year-2 tax
- $3,003 · $250/mo
- Expected delta
- $0/yr ($0/mo · 0.0%)
ⓘ Screening estimate from a state-policy table — verify with the county assessor before closing.
Climate risk First Street
- Flood 1/10 Low FEMA zone X (unshaded) · 0% chance over 30 yrs
- Wildfire 1/10 Low
- Heat 5/10 Major 7 d/yr ≥100°F today · 15 d/yr by 30 yrs out
- Wind 3/10 Moderate 6% chance of damaging wind over 30 yrs
- Air quality 3/10 Moderate 2 unhealthy d/yr today · 4 by 30 yrs out
Nearby sold comps map
Loading sold comps map…
Walkable amenities ~0.75 mi
Loading nearby amenities…
Taxation est. · year 1
- Rental income
- $17,620
- − Mortgage interest
- −$7,842
- − Property taxes
- −$3,003
- − Insurance
- −$700
- − Repairs & maintenance
- −$1,410
- − Management
- −$1,410
- − Depreciation
- −$4,073
- Taxable loss
- −$817
- Est. tax savings @ 24.0%
- +$196
- After-tax cash flow
- $1,603/yr
For passive investors: Depreciation is non-cash, so a rental often shows a tax loss while cash-flowing — sheltering income. Rental losses are passive: they offset passive income freely, and up to $25,000/yr can offset ordinary (W-2) income if you actively participate and your MAGI is under $100k (phasing out to $0 by $150k); unused losses carry forward. On sale, claimed depreciation is recaptured at up to 25%, and gains may owe capital-gains tax (a 1031 exchange can defer both). Figures are a year-1 estimate at your 24.0% rate — not tax advice; consult a CPA.
Schools (NCES district)
- District
- Harrisburg City SD
- NCES district ID
- 4211580
- Math proficiency
- 6% ▼ -6.00%
- Reading proficiency
- 13% ▼ -10.00%
- Median HH income
- $33,432
- Composite
- 7.6/100
- National rank
- #9945
- State rank
- #535 of 539 in PA
Livability — Harrisburg
- Score
- 84/100
- State rank
- #107
- US rank
- #826
Category grades
Schools grade is shown separately in the Schools card above.
Census & demographics
- Census place
- Harrisburg, PA
- County
- Dauphin County · 247,857 people
- City population
- 184,296
- Metro
- Harrisburg-Carlisle, PA
- Population (ZIP)
- 18,541
- Household income
- $46,510
- Rent vs Own
- Severe rent burden
- 1166.0
Population outlook (Dauphin County) Hauer SSP2
- Today (2025)
- 281,628 people
- By 2030
- 283,549 · +0.7%
- By 2040
- 285,385 · +1.3%
- By 2050
- 286,188 · +1.6%
- By 2075
- 291,053 · +3.3%
- By 2100
- 282,374 · +0.3%
Race, ethnicity, and origin ACS 2023
- Neighborhood character
- Diverse neighborhood (Simpson 0.69)
- Race & ethnicity
- Black 44% Hispanic / Latino 29% White 19% Two or more races 12% Asian 3% Native American 1%
- Hispanic origin (detail)
- Puerto Rican 21% Dominican 6%
- Common ancestry
- Polish 1% Romanian 1% Slovak 1%
- Foreign-born
- 10% · Canada, China, Vietnam
- Languages at home
- 73% English-only · Spanish 21% Other Indo-European 1% Chinese 1%
Political lean MEDSL · Dauphin
- 2024 margin
- Lean D (+5.9) · D 52.4% · R 46.5% · Other 1.1%
- 2008→2024 swing
- -3.1pp toward R · 2008: 9.1pp · 2024: 5.9pp
- All cycles
- 2024: D+5.9 2020: D+8.5 2016: D+2.8 2012: D+6.0 2008: D+9.1
Not yet ingested
- Civics
- —
Market trends
- HPI YoY
- ▼ -22.83%
- Current HPI
- 340.2808
- Rent YoY
- ▲ 4.43%
- Metro
- Harrisburg-Carlisle, PA
- State GDP YoY
- ▲ 1.68%
- F500 in state
- 34
Industry mix (Fortune 500 HQ in PA)
| Industry | F500 HQs | Revenue |
|---|---|---|
| Healthcare | 2 | $309B |
|
||
| Insurance | 2 | $27B |
|
||
| Telecommunications / Media | 1 | $124B |
|
||
| Industrial Distribution | 1 | $22B |
|
||
| Financial Services | 1 | $20B |
|
||
| Chemicals / Materials | 1 | $18B |
|
||
Price history
+5.5% since first listed4 events — show timeline
- 2026-06-05 Sold (MLS) $147,700 BRIGHT MLS
- 2026-05-08 Pending — BRIGHT MLS
- 2026-05-06 Listed $140,000 BRIGHT MLS
- 2026-05-05 Coming Soon $140,000 BRIGHT MLS
Property tax history
+1.0%/yrLatest (2026): $3,003 · +1.7% YoY. Source: county tax records.
Cash-flow waterfall
monthlySold comps — $/sqft
last 12 mo · ≤1 miLoading sold comps…