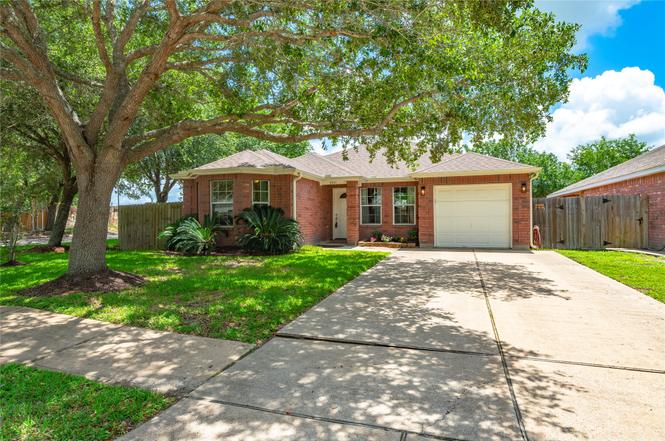
5501 Rio Sabinas St · Pearland, TX
Flood risk 5/10 · Moderate
- FEMA flood zone
- X (unshaded)
- Chance of flooding over 30 yrs
- 0.65%
- Est. flood insurance / yr
- $507 – $1,088
Fire risk 6/10 · Moderate
- Est. fire insurance / yr
- $1,222 – $2,270
Heat risk 9/10 · Severe
- Hot days now (above 110°F)
- 7 days/yr
- Hot days in 30 yrs
- 24 days/yr
Wind risk 9/10 · Severe
- Chance of severe wind over 30 yrs
- 99.0%
Air-quality risk 2/10 · Minimal
- Unhealthy air days now
- 1 days/yr
- Unhealthy air days in 30 yrs
- 2 days/yr
Risk factors via First Street. Map © Google.
Why this score? — see what drove the C+ grade
The composite is a weighted blend of 9 inputs, each scored 0–100. Each bar is that input's sub-score; the figure is the points it added to the 100-point composite (weight × sub-score).
- Cash flow +25.7/30.0
- DSCR +8.6/10.0
- ARV discount +7.9/15.0
- 1% rule +7.3/10.0
- Livability +4.0/5.0
- Schools +3.9/10.0
- Rent growth +2.6/5.0
- Condition / age +2.5/5.0
- Appreciation +0.0/10.0
$235,000
🖨 Deal sheet 📄 Offer letter ✓ Due diligence
Listing remarks MLS
CUTE 1 STORY BRICK HOME! 3 BEDROOMS WITH A STUDY THAT COULD BE A 4TH BEDROOM, 2 BATHROOMS, SPACIOUS LIVINGROOM OPEN TO DINING ROOM AND KITCHEN, 1 CAR GARAGE ATTACHED, BACKYARD WITH PATIO AND WOOD PRIVACY FENCE ON A CORNER LOT!
Key facts
- Vinyl flooring
- Flexible floor plan
- Major updates
Tags
Property features AI
Finance
- HOA & community: Has association (Spectrum Man); Annual association fee of $600; Community gutters
Exterior
- Parking: Attached garage; 1 garage space; Attached parking/garage
- Security: Smoke detectors
- Utilities: Public water; Public sewer; Concrete road access
- Home design: Residential property; Built in 2005; Slab foundation; Composition roof
- Construction: Brick construction
- Exterior features: Deck; Patio; Fully fenced yard; Private yard; Back yard fence; Corner lot; Subdivision setting
Interior
- Kitchen: Dishwasher; Electric cooktop; Electric oven; Garbage disposal; Microwave; Refrigerator
- Bedrooms: Up to 4 bedrooms
- Flooring: Carpet; Plank; Vinyl
- Bathrooms: 2 full bathrooms
- Heating & cooling: Central heating (electric); Central air (electric); Has heating and cooling
- Interior features: Granite counters; High ceilings; Vaulted ceilings; Tub with shower; Wired for sound; Ceiling fans; Kitchen/dining combo
- Laundry & utility: Washer hookup; Electric dryer hookup; Washer; Dryer
Neighborhood map
What this means for you Summary
Snapshot
- This is a 4-bed/2.0-bath single-family listed at $235k.
Deal economics
- At list price, monthly cash flow is $565 ($7k/yr) — positive.
- The deal already cash-flows at list — no discount required.
- Meets the 1% rule at list price ($3k rent vs $235k).
- Cap rate 9.2% vs local median 3.0% in Pearland — top-decile yield for the area; either an underpriced asset or a hidden risk that comps aren't pricing in. Stress-test before assuming the spread holds.
Location & tenants
- Location reads 81/100 on livability (#32 in TX, #1,539 nationally) — a professional / high-income tenant draw. Strengths: employment A+, housing A+, crime A; Watch: amenities D-, commute F.
- Alvin ISD (suburban): math 39% / reading 48% proficiency, ranked #255 of 826 in TX (top 31%) — families likely to look elsewhere, expect single-tenant / working-renter base with shorter leases.
- Zoned schools: Don Jeter El (math 45% / reading 43%, grade F, #1,243 of 4,322 statewide, top 29%, 822 students, 70% FRL); Rodeo Palms J H (math 33% / reading 51%, grade D-, #572 of 1,662 statewide, top 36%, 816 students, 59% FRL); Manvel H S (math 48% / reading 48%, grade D, #571 of 1,632 statewide, top 36%, 2,607 students, 57% FRL).
- Market conditions: Rents flat; 1139 active listings in the ZIP; 2 comparable units currently listed for rent nearby; high-income renter base; 3,960 units permitted in Brazoria County in 2024 (593 in 5+ unit buildings).
Forward outlook
- Local home prices are declining (-3.0%/yr); year-one equity from $2k of loan paydown is wiped out by about $7k of value loss. Plan a longer hold.
- Brazoria County population projected at +44% by 2050 — long-run rental-demand tailwind backs the buy-and-hold thesis.
Negotiation context
- Only 8 days on market — expect competitive offers; lowballing is unlikely to land.
- 7 sale attempts since 11y ago with the ask held roughly flat each time — persistent listings suggest the price (not the market) is what's stuck; bring a comps-based counter.
Risks & watch-outs
- Climate carrying-cost: moderate flood risk; severe wind risk, 99% chance of damaging wind over 30y; major wildfire risk; extreme-heat days projected 7→24/yr by 2055 (HVAC capex compounding) — expect insurance premiums to compound above CPI over the hold.
Questions for the listing agent
- What does the HOA fee cover, when was the last increase, and are there any pending special assessments or reserve-fund shortfalls?
- Is there a deadline driving the sale (1031 exchange, divorce, estate, relocation)? That informs how much negotiation room exists.
- Schools are A-rated — typically a magnet for longer-tenancy family renters. What's the average tenant stay here, and is there a school-zone premium baked into asking?
- What's the average days-on-market for RENTAL listings here right now (not sales)? A rising rental-DOM trend means longer vacancies and softer asking-rent achievability than the comps imply.
- What's the recent tenant-quality profile in this submarket — average credit score on applications, eviction rate, late-payment / NSF rate, and stable-employment percentage? A property-management company in the area should have these aggregated.
- How much new for-sale + rental construction is in the pipeline within 1–3 miles? Heavy new supply typically softens prices + rents 12–24 months out; constrained supply supports both.
Investment metrics
- 1% rule
- 1.23% ✓
- Cap rate
- 9.18%
- Cash-on-cash
- 10.30%
- DSCR
- 1.46
- GRM
- 6.8
CMA / ARV
- ARV (on-the-fly)
- $237,188
- Comps found
- 9
Show comp detail 9 sales within ~0.75 mi
| Address | Dist | Beds/Ba | Sqft | Sold | Price | $/sf | Match |
|---|---|---|---|---|---|---|---|
| 5503 Rio Alamo St | 0.26mi | 4/2.0 | 1,379 (0%) | 15mo | $265,000 | $192 | 76 |
| 5518 Rio Ramos St | 0.35mi | 4/2.0 | 1,365 (-1%) | 8mo | $213,440 | $156 | 76 |
| 5411 Rio Alamo St | 0.26mi | 4/2.0 | 1,383 (+0%) | 22mo | $225,000 | $163 | 69 |
| 5509 Rio Ramos St | 0.31mi | 3/2.0 (-1) | 1,417 (+3%) | 13mo | $225,000 | $159 | 65 |
| 13210 Barton Meadow Ln | 0.68mi | 3/2.0 (-1) | 1,378 (-0%) | 2mo | $229,900 | $167 | 61 |
| 12602 Rio San Juan Ct | 0.12mi | 3/2.0 (-1) | 1,200 (-13%) | 20mo | $224,990 | $187 | 51 |
| 12806 Rio Bravo St | 0.31mi | 3/2.0 (-1) | 1,214 (-12%) | 16mo | $220,000 | $181 | 47 |
| 36 Supiro Dr | 0.72mi | 3/2.0 (-1) | 1,415 (+3%) | 12mo | $273,000 | $193 | 47 |
| 21 Signal Hill Dr | 0.69mi | 3/2.0 (-1) | 1,565 (+14%) | 12mo | $269,000 | $172 | 31 |
Match score weights: distance 35% · size 25% · config 20% · recency 20%. Top-matched comps best support the ARV.
Projected returns pro-forma
-3.0% appreciation · 0.44% rent growth · sell at horizon
- IRR
- -3.9%
- Equity multiple
- 0.86×
- Total profit
- $-9,281
- Equity at exit
- $35,039
- IRR
- 2.5%
- Equity multiple
- 1.16×
- Total profit
- $10,316
- Equity at exit
- $20,319
Cash invested: $65,800 (down + closing). Projections, not guarantees.
Landlord ↔ Tenant lean methodology
- Overall (STATE)
- 87 Strongly Landlord-Friendly
- State Texas
- 87 Strongly Landlord-Friendly · R+5
- County
- — inherits STATE
- City
- — inherits STATE
ZIP-level market 77583
- Rents YoY
- 0.4%
- Active inventory
- 1139
- Price-to-rent
- 6.8×
Monthly cashflow live
- Estimated rent
- $2,893 medium interval (Pro) →
- Mortgage (P&I)
- −$1,232
- Tax from tax record
- −$341 /mo · $4,089/yr
- Insurance
- −$98
- HOA
- −$50
- Vacancy / Maint / Mgmt
- −$608
- Net cashflow
- $565
Break-even live
UW: 25.0% down · 7.5% · 30yr · 1.5% tax · 5.0% vac · 8.0% maint · 8.0% mgmt
Financing live
Cash to close
- Down payment
- $58,750
- Closing costs
- $7,050
- Reserves months
- —
- Total cash needed
- —
Loan-product check · same deal, 3 products live
Conventional
25% down · 7.5% · 30yr
- Down + closing
- —
- Monthly P&I
- —
- Monthly cashflow
- —
- DSCR
- —
- Eligible?
- —
Personal DTI + credit; lowest rate.
DSCR
20% down · 8.5% · 30yr
- Down + closing
- —
- Monthly P&I
- —
- Monthly cashflow
- —
- DSCR
- —
- Eligible?
- —
No personal income docs; deal must DSCR.
Hard money
10% down · 12.0% · 12mo
- Down + closing
- —
- Monthly P&I
- —
- Monthly cashflow
- —
- DSCR
- —
- Eligible?
- —
Short-term bridge; refi at stabilization.
Rent comps 2 comps
| Address | Beds | Baths | Sqft | Rent | $/sqft | DOM | Units | Dist |
|---|---|---|---|---|---|---|---|---|
| 57 Spring Ln Manvel, TX | 4.0 | 2.0 | 1875 | $2,450 | $1.31 | 43d | 1 | 0.37mi |
| 21 Wheeler Ridge Cir Manvel, TX | 3.0 | 2.0 | 1275 | $1,875 | $1.47 | 5d | 1 | 0.62mi |
HOA detail
- Monthly dues
- $50 · $600/yr
Listing history 8 events
-
2026-06-18days on market $235,000 Pending 8 DOM
-
2026-06-17status $235,000 Pending 7 DOM
-
2026-06-17days on market $235,000 Active 7 DOM
-
2026-06-16days on market $235,000 Active 6 DOM
-
2026-06-15days on market $235,000 Active 5 DOM
-
2026-06-13days on market $235,000 Active 3 DOM
-
2026-06-13remarks 679-char remark
-
2026-06-13$235,000 Active 2 DOM
ⓘ Source: listings_history table (triggers on properties + properties_extension) + one-shot
backfill from property_details.listing_events for pre-trigger history.
Tax reassessment forecast TX · Resets to sale price
- Current annual tax
- $4,089 · $341/mo
- Projected year-2 tax
- $4,300 · $358/mo
- Expected delta
- +$211/yr (+$18/mo · 5.2%)
ⓘ Screening estimate from a state-policy table — verify with the county assessor before closing.
Climate risk First Street
- Flood 5/10 Major FEMA zone X (unshaded) · 65% chance over 30 yrs
- Wildfire 6/10 Major
- Heat 9/10 Extreme 7 d/yr ≥110°F today · 24 d/yr by 30 yrs out
- Wind 9/10 Extreme 99% chance of damaging wind over 30 yrs
- Air quality 2/10 Low 1 unhealthy d/yr today · 2 by 30 yrs out
Nearby sold comps map
Loading sold comps map…
Walkable amenities ~0.75 mi
Loading nearby amenities…
Taxation est. · year 1
- Rental income
- $34,720
- − Mortgage interest
- −$13,164
- − Property taxes
- −$4,089
- − Insurance
- −$1,175
- − Repairs & maintenance
- −$2,778
- − Management
- −$2,778
- − HOA
- −$600
- − Depreciation
- −$6,836
- Taxable income
- $3,300
- Est. tax owed @ 24.0%
- −$792
- After-tax cash flow
- $5,984/yr
For passive investors: Depreciation is non-cash, so a rental often shows a tax loss while cash-flowing — sheltering income. Rental losses are passive: they offset passive income freely, and up to $25,000/yr can offset ordinary (W-2) income if you actively participate and your MAGI is under $100k (phasing out to $0 by $150k); unused losses carry forward. On sale, claimed depreciation is recaptured at up to 25%, and gains may owe capital-gains tax (a 1031 exchange can defer both). Figures are a year-1 estimate at your 24.0% rate — not tax advice; consult a CPA.
Schools (NCES district)
- District
- Alvin ISD
- NCES district ID
- 4808090
- Math proficiency
- 39% ▼ -11.00%
- Reading proficiency
- 48% ▬ 0.00%
- Median HH income
- $66,740
- Composite
- 38.96/100
- National rank
- #4080
- State rank
- #255 of 826 in TX
Livability — Pearland
- Score
- 81/100
- State rank
- #32
- US rank
- #1539
Category grades
Schools grade is shown separately in the Schools card above.
Census & demographics
- County
- Brazoria County · 374,982 people
- City population
- 142,397
- Metro
- Houston-The Woodlands-Sugar Land, TX
- Population (ZIP)
- 52,747
- Household income
- $119,287
- Rent vs Own
- Severe rent burden
- 251.0
Population outlook (Brazoria County) Hauer SSP2
- Today (2025)
- 420,414 people
- By 2030
- 457,585 · +8.8%
- By 2040
- 532,232 · +26.6%
- By 2050
- 605,399 · +44.0%
- By 2075
- 779,358 · +85.4%
- By 2100
- 883,759 · +110.2%
Race, ethnicity, and origin ACS 2023
- Neighborhood character
- Highly diverse neighborhood (Simpson 0.70)
- Race & ethnicity
- Hispanic / Latino 38% Black 34% White 20% Two or more races 18% Asian 5%
- Hispanic origin (detail)
- Mexican 31% Puerto Rican 2%
- Common ancestry
- Lithuanian 1% Slovak 1% Romanian 1%
- Foreign-born
- 16% · Canada, Vietnam, China
- Languages at home
- 64% English-only · Spanish 28% Other Asian/Pacific 2% Vietnamese 1%
Political lean MEDSL · Brazoria
- 2024 margin
- R (+19.7) · D 39.5% · R 59.2% · Other 1.3%
- 2008→2024 swing
- +9.9pp toward D · 2008: -29.6pp · 2024: -19.7pp
- All cycles
- 2024: R+19.7 2020: R+18.2 2016: R+24.6 2012: R+34.2 2008: R+29.6
Not yet ingested
- Civics
- —
Market trends
- HPI YoY
- ▼ -120.19%
- Current HPI
- 198.6559
- Rent YoY
- ▲ 0.44%
- Metro
- Houston-The Woodlands-Sugar Land, TX
- State GDP YoY
- ▲ 3.95%
- F500 in state
- 110
Industry mix (Fortune 500 HQ in TX)
| Industry | F500 HQs | Revenue |
|---|---|---|
| Energy | 16 | $1,198B |
|
||
| Technology | 5 | $198B |
|
||
| Engineering / Construction | 4 | $72B |
|
||
| Energy Services | 3 | $60B |
|
||
| Utilities | 3 | $41B |
|
||
| Healthcare | 2 | $330B |
|
||
Price history
+80.9% since first listed18 events — show timeline
- 2026-06-10 Listed $235,000 HARMLS
- 2016-02-22 Listing Removed — HARMLS
- 2016-02-17 Sold (Public Records) — Public Records
- 2016-02-16 Sold (MLS) — BCBR
- 2016-02-16 Sold (MLS) — HARMLS
- 2016-01-07 Pending — HARMLS
- 2016-01-04 Relisted — HARMLS
- 2015-12-11 Pending — HARMLS
- 2015-10-07 Relisted — HARMLS
- 2015-10-06 Pending — HARMLS
- 2015-10-01 Relisted — HARMLS
- 2015-09-17 Pending — HARMLS
- 2015-08-08 Price Changed $129,900 HARMLS
- 2015-05-11 Relisted — HARMLS
- 2015-04-29 Pending — HARMLS
- 2015-03-17 Listed $134,900 HARMLS
- 2015-03-16 Listed $129,900 BCBR
- 2014-02-18 Sold (Public Records) — Public Records
Property tax history
+5.1%/yrLatest (2025): $4,089 · +8.7% YoY. Source: county tax records.
Cash-flow waterfall
monthlySold comps — $/sqft
last 12 mo · ≤1 miLoading sold comps…