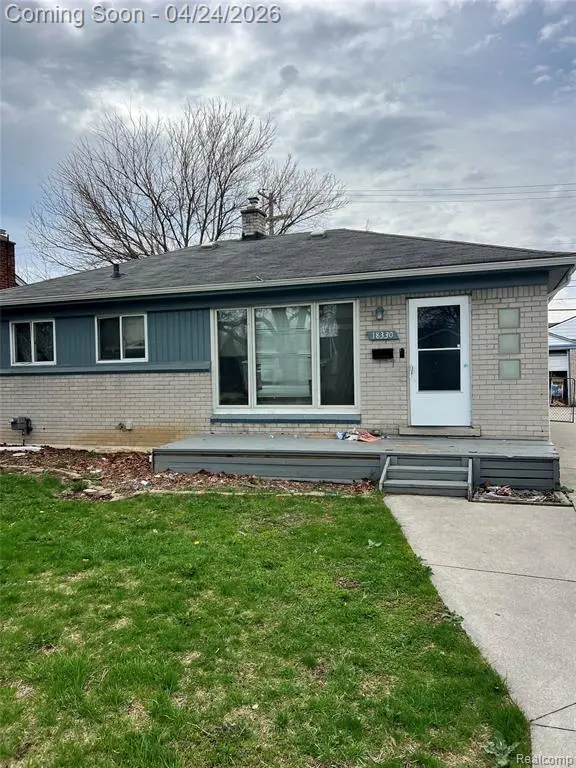
18330 Marquette St · Roseville, MI
Flood risk 1/10 · Minimal
- FEMA flood zone
- X (unshaded)
- Chance of flooding over 30 yrs
- 0.0%
- Est. flood insurance / yr
- $473 – $860
Fire risk 1/10 · Minimal
- Est. fire insurance / yr
- $784 – $1,456
Heat risk 3/10 · Minor
- Hot days now (above 96°F)
- 7 days/yr
- Hot days in 30 yrs
- 15 days/yr
Wind risk 1/10 · Minimal
- Chance of severe wind over 30 yrs
- —
Air-quality risk 4/10 · Minor
- Unhealthy air days now
- 4 days/yr
- Unhealthy air days in 30 yrs
- 5 days/yr
Risk factors via First Street. Map © Google.
Why this score? — see what drove the C+ grade
The composite is a weighted blend of 9 inputs, each scored 0–100. Each bar is that input's sub-score; the figure is the points it added to the 100-point composite (weight × sub-score).
- Cash flow +23.0/30.0
- ARV discount +15.0/15.0
- DSCR +7.4/10.0
- 1% rule +6.0/10.0
- Livability +3.6/5.0
- Rent growth +2.6/5.0
- Condition / age +2.2/5.0
- Schools +1.5/10.0
- Appreciation +0.0/10.0
$145,000
🖨 Deal sheet 📄 Offer letter ✓ Due diligence
Listing remarks MLS
* * As-is. * * 3 bedroom 2 full bath ranch home in Roseville. Large living area. Wood flooring throughout. Fenced rear yard. 2 car detached garage. Nice neighborhood.
Key facts
- 5,227 sq ft lot
- 2 garage spots
- Built 1952
Neighborhood map
What this means for you Summary
Snapshot
- This is a 3-bed/2.0-bath single-family listed at $145k. Condition is rated fair.
Deal economics
- At list price, monthly cash flow is $257 ($3k/yr) — positive.
- The deal already cash-flows at list — no discount required.
- Meets the 1% rule at list price ($2k rent vs $145k).
- Recommended offer: $143k (1.5% below list) — sets the bar for market timing.
- Cap rate 8.4% vs local median 6.0% in Roseville — top-decile yield for the area; either an underpriced asset or a hidden risk that comps aren't pricing in. Stress-test before assuming the spread holds.
Location & tenants
- Location reads 72/100 on livability (#258 in MI) — a middle-class / working-renter tenant base. Strengths: commute A+, cost of living A+, housing A+; Watch: health & safety D+, employment D, schools F.
- Roseville Community Schools (suburban): math 11% / reading 24% proficiency, ranked #483 of 540 in MI (top 89%) — low school quality limits family demand, transient renter base, plan for 1-2y turnover; 60% free/reduced lunch — lower-income household profile, screen leases tightly.
- Market conditions: Rents flat; 265 active listings in the ZIP; 6 comparable units currently listed for rent nearby; rentals at typical pace (median 25d on market — plan ~3-4 weeks tenant-placement turnaround); 1,321 units permitted in Macomb County in 2024 (86 in 5+ unit buildings).
- This rent runs 31% of the median local income ($62k/yr) — at the standard rent-burdened threshold; future hikes will face affordability resistance.
Forward outlook
- Local home prices are declining (-3.0%/yr); year-one equity from $1k of loan paydown is wiped out by about $4k of value loss. Plan a longer hold.
- Macomb County population projected at +9% by 2050 — modest demand growth; plan on rents tracking national, not racing it.
Negotiation context
- It's been on market 27 days — a 2% lower offer ($143k) is reasonable based on typical stale-listing flexibility.
- 12 sale attempts since 9y ago; this cycle's ask has dropped $65k (31%) from the opening price — seller is motivated, your offer sets the floor, not the list.
Risks & watch-outs
- Watch-outs: built in 1952 — expect roof / HVAC / electrical / plumbing capex.
Questions for the listing agent
- Have any recent inspections been done? Can we get a copy of the seller's disclosures and any deferred-maintenance estimates?
- Built in 1952 — when were the roof, HVAC, electrical panel, plumbing, and water heater last replaced?
- Is there a deadline driving the sale (1031 exchange, divorce, estate, relocation)? That informs how much negotiation room exists.
- Schools are F-rated, which usually means shorter tenancies and higher turnover. Who's the typical renter profile here, and what's been the actual vacancy rate?
- Crime grade is F in this area — have there been break-ins, vandalism, or insurance claims at this property in the last 3 years? What carrier currently insures it and at what premium?
- What's the average days-on-market for RENTAL listings here right now (not sales)? A rising rental-DOM trend means longer vacancies and softer asking-rent achievability than the comps imply.
- What's the recent tenant-quality profile in this submarket — average credit score on applications, eviction rate, late-payment / NSF rate, and stable-employment percentage? A property-management company in the area should have these aggregated.
- How much new for-sale + rental construction is in the pipeline within 1–3 miles? Heavy new supply typically softens prices + rents 12–24 months out; constrained supply supports both.
Investment metrics
- 1% rule
- 1.10% ✓
- Cap rate
- 8.42%
- Cash-on-cash
- 7.60%
- DSCR
- 1.34
- GRM
- 7.6
CMA / ARV
- ARV (median comp)
- $194,403
- List price
- $145,000
- Delta
- -25.41%
- Verdict
- UNDERPRICED
- Comps
- 20 within 1.0 mi
Show comp detail 12 sales within ~0.75 mi
| Address | Dist | Beds/Ba | Sqft | Sold | Price | $/sf | Match |
|---|---|---|---|---|---|---|---|
| 26690 Fernwood St | 0.21mi | 3/2.0 | 1,589 (+4%) | 4mo | $227,500 | $143 | 80 |
| 18239 Glendale St | 0.11mi | 3/2.0 | 1,376 (-10%) | 0mo | $204,000 | $148 | 78 |
| 26640 Oak St | 0.20mi | 3/1.0 | 1,620 (+6%) | 1mo | $232,000 | $143 | 76 |
| 25334 Barbara St | 0.52mi | 3/1.0 | 1,479 (-3%) | 1mo | $147,000 | $99 | 66 |
| 26082 Parkington St | 0.60mi | 3/2.0 | 1,582 (+4%) | 4mo | $210,000 | $133 | 62 |
| 26731 Parkington St | 0.64mi | 2/1.5 (-1) | 1,528 (+0%) | 5mo | $177,500 | $116 | 59 |
| 25560 Bellaire St | 0.57mi | 3/1.0 | 1,463 (-4%) | 7mo | $175,000 | $120 | 57 |
| 25064 Ronald Rd | 0.71mi | 3/1.5 | 1,700 (+11%) | 0mo | $205,000 | $121 | 45 |
| 26834 Greenleaf St | 0.58mi | 3/2.0 | 1,298 (-15%) | 3mo | $165,000 | $127 | 45 |
| 27095 Lawnwood St | 0.59mi | 3/2.5 | 1,728 (+13%) | 4mo | $279,900 | $162 | 45 |
| 17921 Oakdale St | 0.63mi | 3/1.0 | 1,312 (-14%) | 3mo | $235,000 | $179 | 40 |
| 27052 Ridgewood St | 0.54mi | 2/1.0 (-1) | 1,307 (-14%) | 3mo | $135,000 | $103 | 40 |
Match score weights: distance 35% · size 25% · config 20% · recency 20%. Top-matched comps best support the ARV.
Projected returns pro-forma
-3.0% appreciation · 0.39% rent growth · sell at horizon
- IRR
- -7.7%
- Equity multiple
- 0.72×
- Total profit
- $-11,175
- Equity at exit
- $21,620
- IRR
- -1.8%
- Equity multiple
- 0.89×
- Total profit
- $-4,433
- Equity at exit
- $12,537
Cash invested: $40,600 (down + closing). Projections, not guarantees.
Landlord ↔ Tenant lean methodology
- Overall (STATE)
- 62 Landlord-Friendly
- State Michigan
- 62 Landlord-Friendly · EVEN
- County
- — inherits STATE
- City
- — inherits STATE
ZIP-level market 48066
- Rents YoY
- 0.4%
- Active inventory
- 265
- Price-to-rent
- 7.6×
Monthly cashflow live
- Estimated rent
- $1,594 high interval (Pro) →
- Mortgage (P&I)
- −$760
- Tax est. 1.5%
- −$181 /mo · $2,175/yr
- Insurance
- −$60
- HOA
- −$0
- Vacancy / Maint / Mgmt
- −$335
- Net cashflow
- $257
Break-even live
UW: 25.0% down · 7.5% · 30yr · 1.5% tax · 5.0% vac · 8.0% maint · 8.0% mgmt
Financing live
Cash to close
- Down payment
- $36,250
- Closing costs
- $4,350
- Reserves months
- —
- Total cash needed
- —
Loan-product check · same deal, 3 products live
Conventional
25% down · 7.5% · 30yr
- Down + closing
- —
- Monthly P&I
- —
- Monthly cashflow
- —
- DSCR
- —
- Eligible?
- —
Personal DTI + credit; lowest rate.
DSCR
20% down · 8.5% · 30yr
- Down + closing
- —
- Monthly P&I
- —
- Monthly cashflow
- —
- DSCR
- —
- Eligible?
- —
No personal income docs; deal must DSCR.
Hard money
10% down · 12.0% · 12mo
- Down + closing
- —
- Monthly P&I
- —
- Monthly cashflow
- —
- DSCR
- —
- Eligible?
- —
Short-term bridge; refi at stabilization.
Rent comps 6 comps
| Address | Beds | Baths | Sqft | Rent | $/sqft | DOM | Units | Dist |
|---|---|---|---|---|---|---|---|---|
| 25530 Huron St Roseville, MI | 3.0 | 2.0 | 2024 | $1,600 | $0.79 | 3d | 1 | 0.49mi |
| 27881 O Neil Roseville, MI | 3.0 | 1.0 | 1300 | $1,300 | $1.00 | 24d | 1 | 0.93mi |
| 18410 Tranquil St Roseville, MI | 3.0 | 1.0 | 1140 | $1,800 | $1.58 | 44d | 1 | 1.19mi |
| 18410 Tranquil St Roseville, MI | 3.0 | 1.0 | 1140 | $1,800 | $1.58 | 15d | 1 | 1.19mi |
| 28232 Floral St Unit 1032343P Roseville, MI | 3.0 | 1.0 | 1496 | $6,605 | $4.42 | 12d | 1 | 1.24mi |
| 28744 Maple St Roseville, MI | 3.0 | 1.0 | 1050 | $1,295 | $1.23 | 44d | 1 | 1.24mi |
Listing history 35 events
-
2026-05-11price $145,000 169-char remark
Show marketing remark (169 chars)
* * As-is. * * 3 bedroom 2 full bath ranch home in Roseville. Large living area. Wood flooring throughout. Fenced rear yard. 2 car detached garage. Nice neighborhood.
-
2026-05-11price $145,000 169-char remark
Show marketing remark (169 chars)
* * As-is. * * 3 bedroom 2 full bath ranch home in Roseville. Large living area. Wood flooring throughout. Fenced rear yard. 2 car detached garage. Nice neighborhood.
-
2026-04-24$210,000 Active 169-char remark
Show marketing remark (169 chars)
* * As-is. * * 3 bedroom 2 full bath ranch home in Roseville. Large living area. Wood flooring throughout. Fenced rear yard. 2 car detached garage. Nice neighborhood.
-
2026-04-24$210,000 Active 169-char remark
Show marketing remark (169 chars)
* * As-is. * * 3 bedroom 2 full bath ranch home in Roseville. Large living area. Wood flooring throughout. Fenced rear yard. 2 car detached garage. Nice neighborhood.
-
2026-04-20historical $210,000 169-char remark
Show marketing remark (169 chars)
* * As-is. * * 3 bedroom 2 full bath ranch home in Roseville. Large living area. Wood flooring throughout. Fenced rear yard. 2 car detached garage. Nice neighborhood.
-
2023-02-07soldstatus $135,000 Sold
-
2023-02-07soldstatus $135,000 Closed
-
2022-12-30historical Accepting Backup Offers
-
2022-12-30historical Accepting Backup Offers
-
2022-12-27$140,000 Active
-
2022-12-27$140,000 Active
-
2022-11-28historical
-
2022-11-28historical
-
2022-09-22$162,000 Active
-
2022-09-22$162,000 Active
-
2017-11-06soldstatus $95,000 Sold
-
2017-11-06soldstatus $95,000 Closed
-
2017-11-04status Pending
-
2017-11-02status Pending
-
2017-10-19status Active
-
2017-10-19status Active
-
2017-10-10status Pending
-
2017-10-10status Pending
-
2017-09-06price $99,900
-
2017-09-05price $99,900
-
2017-09-01price $112,900
-
2017-08-31price $112,900
-
2017-08-23historical
-
2017-08-23$114,900 Active
-
2017-08-23$114,900 Active
-
2017-08-23historical
-
2017-08-08price $114,900
-
2017-08-08price $114,900
-
2017-07-29$119,900 Active
-
2017-07-29$119,900 Active
ⓘ Source: listings_history table (triggers on properties + properties_extension) + one-shot
backfill from property_details.listing_events for pre-trigger history.
Climate risk First Street
- Flood 1/10 Low FEMA zone X (unshaded) · 0% chance over 30 yrs
- Wildfire 1/10 Low
- Heat 3/10 Moderate 7 d/yr ≥96°F today · 15 d/yr by 30 yrs out
- Wind 1/10 Low
- Air quality 4/10 Moderate 4 unhealthy d/yr today · 5 by 30 yrs out
Nearby sold comps map
Loading sold comps map…
Walkable amenities ~0.75 mi
Loading nearby amenities…
Taxation est. · year 1
- Rental income
- $19,127
- − Mortgage interest
- −$8,122
- − Property taxes
- −$2,175
- − Insurance
- −$725
- − Repairs & maintenance
- −$1,530
- − Management
- −$1,530
- − Depreciation
- −$4,218
- Taxable income
- $826
- Est. tax owed @ 24.0%
- −$198
- After-tax cash flow
- $2,887/yr
For passive investors: Depreciation is non-cash, so a rental often shows a tax loss while cash-flowing — sheltering income. Rental losses are passive: they offset passive income freely, and up to $25,000/yr can offset ordinary (W-2) income if you actively participate and your MAGI is under $100k (phasing out to $0 by $150k); unused losses carry forward. On sale, claimed depreciation is recaptured at up to 25%, and gains may owe capital-gains tax (a 1031 exchange can defer both). Figures are a year-1 estimate at your 24.0% rate — not tax advice; consult a CPA.
Condition & rehab AI · 1 photo
The property requires moderate repairs to the foundation and landscaping to improve its condition and value.
Repairs flagged
- Major Exposed foundation — Structural issue
- Major Uneven ground — Affects drainage and stability
- Minor Debris — Aesthetic issue
Value-add opportunities
- Both Landscaping and curb appeal — Enhances curb appeal and property value
- Both Foundation repair — Stabilizes the structure and improves property value
- Both Landscaping and curb appeal — Enhances curb appeal and property value
Renovation cost estimate screening
| Repair item | Severity | Est. cost |
|---|---|---|
| Exposed foundation · Structural issue | Major | $15,000–50,000 |
| Uneven ground · Affects drainage and stability | Major | $15,000–50,000 |
| Debris · Aesthetic issue | Minor | $500–3,000 |
| Total estimated repair cost · 3 items | $30,500–103,000 |
Value-add ROI direction
- Both Landscaping and curb appeal — Enhances curb appeal and property value ↑
- Both Foundation repair — Stabilizes the structure and improves property value ↑
- Both Landscaping and curb appeal — Enhances curb appeal and property value ↑
ⓘ Cost ranges are severity-bucket heuristics (US national rule-of-thumb). Get contractor quotes + a written scope before underwriting a rehab budget.
Schools (NCES district)
- District
- Roseville Community Schools
- NCES district ID
- 2630210
- Math proficiency
- 11% ▼ -8.00%
- Reading proficiency
- 24% ▼ -7.00%
- Median HH income
- $41,590
- Composite
- 14.98/100
- National rank
- #9363
- State rank
- #483 of 540 in MI
Livability — Roseville
- Score
- 72/100
- State rank
- #258
- US rank
- #6400
Category grades
Schools grade is shown separately in the Schools card above.
Census & demographics
- Census place
- Roseville, MI
- County
- Macomb County · 638,552 people
- City population
- 47,123
- Metro
- Detroit-Warren-Dearborn, MI
- Population (ZIP)
- 47,123
- Household income
- $62,182
- Rent vs Own
- Severe rent burden
- 1712.0
Population outlook (Macomb County) Hauer SSP2
- Today (2025)
- 925,296 people
- By 2030
- 948,226 · +2.5%
- By 2040
- 983,961 · +6.3%
- By 2050
- 1,010,200 · +9.2%
- By 2075
- 1,076,222 · +16.3%
- By 2100
- 1,077,065 · +16.4%
Race, ethnicity, and origin ACS 2023
- Neighborhood character
- Predominantly White (65%)
- Race & ethnicity
- White 65% Black 23% Two or more races 7% Hispanic / Latino 4% Asian 2%
- Common ancestry
- Romanian 12% Lithuanian 4% Slovak 2%
- Foreign-born
- 5% · Canada
- Languages at home
- 93% English-only · Spanish 2% Russian/Polish/Slavic 1% Other Indo-European 1%
Political lean MEDSL · Macomb
- 2024 margin
- R (+13.7) · D 42.2% · R 55.9% · Other 1.9%
- 2008→2024 swing
- -22.3pp toward R · 2008: 8.6pp · 2024: -13.7pp
- All cycles
- 2024: R+13.7 2020: R+8.1 2016: R+11.6 2012: D+4.0 2008: D+8.6
Not yet ingested
- Civics
- —
Market trends
- HPI YoY
- ▼ -232.95%
- Current HPI
- 217.4171
- Rent YoY
- ▲ 0.39%
- Metro
- Detroit-Warren-Dearborn, MI
- State GDP YoY
- ▲ 1.37%
- F500 in state
- 28
Industry mix (Fortune 500 HQ in MI)
| Industry | F500 HQs | Revenue |
|---|---|---|
| Automotive Parts | 3 | $48B |
|
||
| Automotive | 2 | $372B |
|
||
| Chemicals | 1 | $45B |
|
||
| Automotive Retail | 1 | $29B |
|
||
| Healthcare / Medical Devices | 1 | $23B |
|
||
| Automotive Technology | 1 | $20B |
|
||
Price history
+20.9% since first listed35 events — show timeline
- 2026-05-11 Price Changed $145,000 MiRealSource-MiMLS
- 2026-05-11 Price Changed $145,000 REALCOMP
- 2026-04-24 Listed $210,000 MiRealSource-MiMLS
- 2026-04-24 Listed $210,000 REALCOMP
- 2026-04-20 Coming Soon $210,000 MiRealSource-MiMLS
- 2023-02-07 Sold (MLS) $135,000 MiRealSource-MiMLS
- 2023-02-07 Sold (MLS) $135,000 REALCOMP
- 2022-12-30 Contingent — MiRealSource-MiMLS
- 2022-12-30 Contingent — REALCOMP
- 2022-12-27 Listed $140,000 MiRealSource-MiMLS
- 2022-12-27 Listed $140,000 REALCOMP
- 2022-11-28 Listing Removed — MiRealSource-MiMLS
- 2022-11-28 Listing Removed — REALCOMP
- 2022-09-22 Listed $162,000 MiRealSource-MiMLS
- 2022-09-22 Listed $162,000 REALCOMP
- 2017-11-06 Sold (MLS) $95,000 MiRealSource-MiMLS
- 2017-11-06 Sold (MLS) $95,000 REALCOMP
- 2017-11-04 Pending — MiRealSource-MiMLS
- 2017-11-02 Pending — REALCOMP
- 2017-10-19 Relisted — MiRealSource-MiMLS
- 2017-10-19 Relisted — REALCOMP
- 2017-10-10 Pending — MiRealSource-MiMLS
- 2017-10-10 Pending — REALCOMP
- 2017-09-06 Price Changed $99,900 MiRealSource-MiMLS
- 2017-09-05 Price Changed $99,900 REALCOMP
- 2017-09-01 Price Changed $112,900 MiRealSource-MiMLS
- 2017-08-31 Price Changed $112,900 REALCOMP
- 2017-08-23 Listing Removed — REALCOMP
- 2017-08-23 Listed $114,900 MiRealSource-MiMLS
- 2017-08-23 Listed $114,900 REALCOMP
- 2017-08-23 Listing Removed — MiRealSource-MiMLS
- 2017-08-08 Price Changed $114,900 MiRealSource-MiMLS
- 2017-08-08 Price Changed $114,900 REALCOMP
- 2017-07-29 Listed $119,900 MiRealSource-MiMLS
- 2017-07-29 Listed $119,900 REALCOMP
Cash-flow waterfall
monthlySold comps — $/sqft
last 12 mo · ≤1 miLoading sold comps…