10 Nelson St · Auburn, NY
Flood risk 3/10 · Minor
- FEMA flood zone
- X (unshaded)
- Chance of flooding over 30 yrs
- 0.2%
- Est. flood insurance / yr
- $473 – $860
Fire risk 1/10 · Minimal
- Est. fire insurance / yr
- $691 – $1,283
Heat risk 3/10 · Minor
- Hot days now (above 96°F)
- 7 days/yr
- Hot days in 30 yrs
- 16 days/yr
Wind risk 1/10 · Minimal
- Chance of severe wind over 30 yrs
- 1.0%
Air-quality risk 2/10 · Minimal
- Unhealthy air days now
- 0 days/yr
- Unhealthy air days in 30 yrs
- 1 days/yr
Risk factors via First Street. Map © Google.
Why this score? — see what drove the D grade
The composite is a weighted blend of 9 inputs, each scored 0–100. Each bar is that input's sub-score; the figure is the points it added to the 100-point composite (weight × sub-score).
- Cash flow +15.0/30.0
- ARV discount +7.5/15.0
- 1% rule +5.0/10.0
- DSCR +5.0/10.0
- Livability +3.7/5.0
- Schools +3.0/10.0
- Rent growth +2.5/5.0
- Condition / age +2.5/5.0
- Appreciation +0.0/10.0
$35,000
🖨 Deal sheet (PDF) 📄 Offer letter ✓ Due diligence
Listing remarks
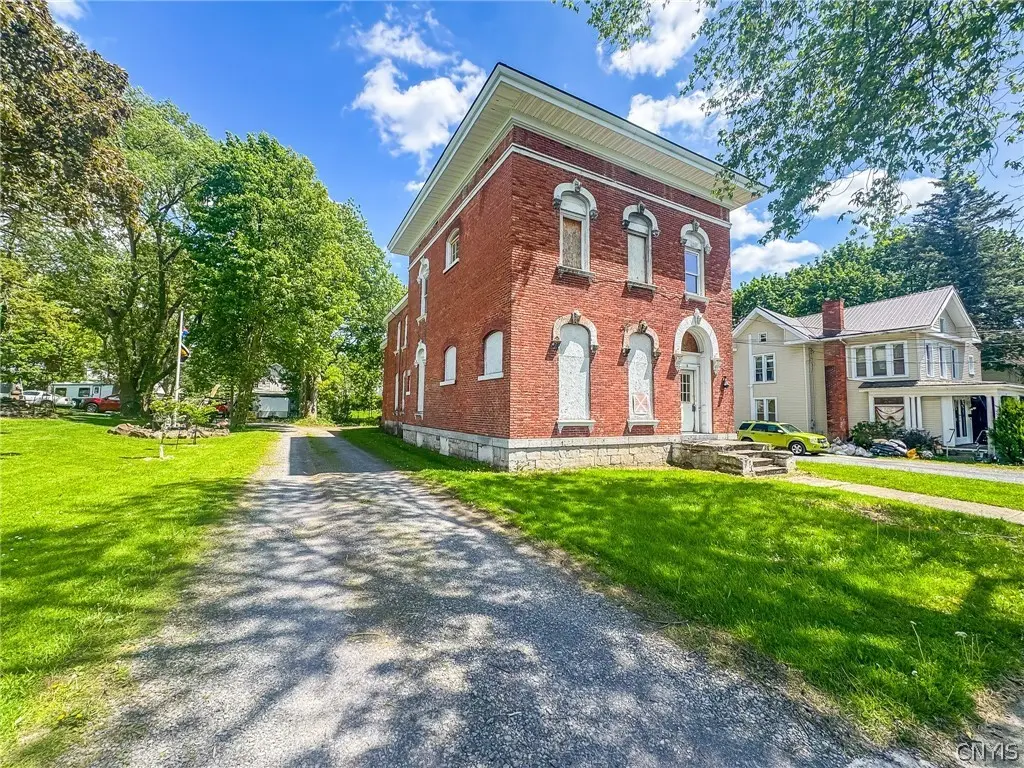
Owned by the City of Auburn and offered for sale as-is at $35,000, 10 Nelson St. presents a unique investment and restoration opportunity. This spacious 2-story single-family residence offers 3,472 square feet of living space and showcases a classic colonial-style brick exterior that provides timeless curb appeal and historic character. Originally built in 1870, the property features 6 bedrooms, 3 full bathrooms, and 3 kitchens, offering flexible layout possibilities for future use. Additional highlights include natural gas forced-air heat, public water and sewer utilities, and a full basement for storage or additional functional space. Situated on a generously sized lot with both covered a
Key facts
- Full basement
- Historic character
- 0.27 acre lot
Tags
Property features AI
Exterior
- Parking: No garage
- Utilities: Public water connected; Sewer connected
- Home design: Two-story building; Resale property; Brick construction
- Construction: Brick exterior; Stone foundation; Existing (previously built)
- Exterior features: Gravel driveway; Rectangular lot
Interior
- Kitchen: Water heater (listed under appliances); See remarks for additional kitchen details
- Bedrooms: Total of 10 rooms (bedrooms and other rooms included)
- Bathrooms: Three full bathrooms; One half bathroom; One main-level bathroom
- Heating & cooling: Gas heating; Heating present
- Interior features: Full basement; Additional interior details noted in remarks
- Laundry & utility: See remarks for laundry and utility details
Neighborhood map
What this means for you Summary
Snapshot
- This is a 6-bed/3.0-bath single-family listed at $35k.
Deal economics
- At list price, monthly cash flow is $1k ($16k/yr) — positive.
- The deal already cash-flows at list — no discount required.
- Meets the 1% rule at list price ($2k rent vs $35k).
- Recommended offer: $34k (1.5% below list) — sets the bar for market timing.
- Cap rate 52.7% vs local median 7.6% in Auburn — top-decile yield for the area; either an underpriced asset or a hidden risk that comps aren't pricing in. Stress-test before assuming the spread holds.
Location & tenants
- Location reads 74/100 on livability (#298 in NY, #4,814 nationally) — a middle-class / working-renter tenant base. Strengths: cost of living A+, housing A+, health & safety A+; Watch: amenities D-, commute F, employment D-.
- Auburn City School District (town): math 31% / reading 39% proficiency, ranked #558 of 590 in NY (top 95%) — families likely to look elsewhere, expect single-tenant / working-renter base with shorter leases.
- Zoned schools: Owasco Elementary School (math 32% / reading 42%, grade F, #1,519 of 2,108 statewide, top 74%, 370 students, 46% FRL); Auburn Junior High School (math 16% / reading 26%, grade F, #661 of 729 statewide, top 91%, 598 students, 81% FRL); Auburn High School (math 88% / reading 84%, grade A, #347 of 1,100 statewide, top 32%, 1,183 students, 51% FRL) — zoned schools average 59% FRL vs 42% district-wide (17 pts higher); higher-poverty schools than district average — tighter screening recommended.
- Zoned-school proficiency averages 48% at this address vs 35% district-wide (+13 pts) — the actual schools serving this property are materially stronger than the Auburn City School District average implies; a family-tenant draw the district grade alone would hide.
- Market conditions: 225 active listings in the ZIP; 161 units permitted in Cayuga County in 2024 (65 in 5+ unit buildings).
- This rent runs 41% of the median local income ($61k/yr) — at the standard rent-burdened threshold; future hikes will face affordability resistance.
Forward outlook
- Local home prices are declining (-3.0%/yr); year-one equity from $242 of loan paydown is wiped out by about $1k of value loss. Plan a longer hold.
- Cayuga County population projected at -18% by 2050 — secular population decline; favor cash flow + early exit over multi-decade hold.
- At projected returns (-3.0% appreciation + 3.0% rent growth), your $10k cash investment doubles in ~1 year — after that, you're playing with house money.
Negotiation context
- It's been on market 27 days — a 2% lower offer ($34k) is reasonable based on typical stale-listing flexibility.
- 5 sale attempts since 3y ago with the ask held roughly flat each time — persistent listings suggest the price (not the market) is what's stuck; bring a comps-based counter.
Risks & watch-outs
- Watch-outs: property tax is 3.0% of price; built in 1870 — expect roof / HVAC / electrical / plumbing capex.
Questions for the listing agent
- Built in 1870 — when were the roof, HVAC, electrical panel, plumbing, and water heater last replaced?
- Property tax is high relative to price — has the assessment been appealed recently, and will the sale trigger a re-assessment?
- Is there a deadline driving the sale (1031 exchange, divorce, estate, relocation)? That informs how much negotiation room exists.
- Schools are D-rated, which usually means shorter tenancies and higher turnover. Who's the typical renter profile here, and what's been the actual vacancy rate?
- The area grade is low — what's the realistic commute time and amenity access for the typical tenant pool here? Any planned neighborhood developments (good or bad) we should know about?
- What's the average days-on-market for RENTAL listings here right now (not sales)? A rising rental-DOM trend means longer vacancies and softer asking-rent achievability than the comps imply.
- What's the recent tenant-quality profile in this submarket — average credit score on applications, eviction rate, late-payment / NSF rate, and stable-employment percentage? A property-management company in the area should have these aggregated.
- How much new for-sale + rental construction is in the pipeline within 1–3 miles? Heavy new supply typically softens prices + rents 12–24 months out; constrained supply supports both.
Investment metrics
- 1% rule
- 5.93% ✓
- Cap rate
- 52.73%
- Cash-on-cash
- 165.84%
- DSCR
- 8.38
- GRM
- 1.4
CMA / ARV
- ARV (on-the-fly)
- $354,144
- Comps found
- 1
Show comp detail 1 sale within ~0.75 mi
| Address | Dist | Beds/Ba | Sqft | Sold | Price | $/sf | Match |
|---|---|---|---|---|---|---|---|
| 144 E Genesee St | 0.69mi | 6/3.0 | 3,130 (-10%) | 6mo | $319,000 | $102 | 46 |
Match score weights: distance 35% · size 25% · config 20% · recency 20%. Top-matched comps best support the ARV.
Projected returns pro-forma
-3.0% appreciation · 3.0% rent growth · sell at horizon
- IRR
- —
- Equity multiple
- 9.23×
- Total profit
- $80,644
- Equity at exit
- $5,219
- IRR
- —
- Equity multiple
- 19.52×
- Total profit
- $181,528
- Equity at exit
- $3,026
Cash invested: $9,800 (down + closing). Projections, not guarantees.
Landlord ↔ Tenant lean methodology
- Overall (STATE)
- 15 Strongly Tenant-Friendly
- State New York
- 15 Strongly Tenant-Friendly · D+10
- County
- — inherits STATE
- City
- — inherits STATE
ZIP-level market 13021
- Home prices YoY
- -22.4%
- Active inventory
- 225
- Price-to-rent
- 1.4×
Monthly cashflow live
- Estimated rent
- $2,074 medium interval (Pro) →
- Mortgage (P&I)
- −$184
- Tax from tax record
- −$86 /mo · $1,036/yr
- Insurance
- −$15
- HOA
- −$0
- Lot rent
- −$0
- Vacancy / Maint / Mgmt
- −$436
- Net cashflow
- $1,354
Break-even live
Sensitivity live
| Price | -10% $1,374 | -5% $1,364 | +0% $1,354 | +5% $1,344 | +10% $1,335 |
|---|---|---|---|---|---|
| Rent | -10% $1,190 | -5% $1,272 | +0% $1,354 | +5% $1,436 | +10% $1,518 |
| Rate | -1.0pp $1,372 | -0.5pp $1,363 | base $1,354 | +0.5pp $1,345 | +1.0pp $1,336 |
UW: 25.0% down · 7.5% · 30yr · 1.5% tax · 5.0% vac · 8.0% maint · 8.0% mgmt
Financing live
Cash to close
- Down payment
- $8,750
- Closing costs
- $1,050
- Reserves months
- —
- Total cash needed
- —
Loan-product check · same deal, 3 products live
Conventional
25% down · 7.5% · 30yr
- Down + closing
- —
- Monthly P&I
- —
- Monthly cashflow
- —
- DSCR
- —
- Eligible?
- —
Personal DTI + credit; lowest rate.
DSCR
20% down · 8.5% · 30yr
- Down + closing
- —
- Monthly P&I
- —
- Monthly cashflow
- —
- DSCR
- —
- Eligible?
- —
No personal income docs; deal must DSCR.
Hard money
10% down · 12.0% · 12mo
- Down + closing
- —
- Monthly P&I
- —
- Monthly cashflow
- —
- DSCR
- —
- Eligible?
- —
Short-term bridge; refi at stabilization.
Listing history 36 events
-
2026-06-22days on market $35,000 Active 27 DOM
-
2026-06-19days on market $35,000 Active 24 DOM
-
2026-06-18days on market $35,000 Active 23 DOM
-
2026-06-17days on market $35,000 Active 22 DOM
-
2026-06-16days on market $35,000 Active 21 DOM
-
2026-06-15days on market $35,000 Active 20 DOM
-
2026-06-14days on market $35,000 Active 18 DOM
-
2026-06-12days on market $35,000 Active 17 DOM
-
2026-06-09days on market $35,000 Active 14 DOM
-
2026-06-08days on market $35,000 Active 13 DOM
-
2026-06-07days on market $35,000 Active 12 DOM
-
2026-06-05days on market $35,000 Active 9 DOM
-
2026-06-03days on market $35,000 Active 8 DOM
-
2026-06-02days on market $35,000 Active 7 DOM
-
2026-06-01days on market $35,000 Active 6 DOM
-
2026-05-31days on market $35,000 Active 5 DOM
-
2026-05-30days on market $35,000 Active 4 DOM
-
2026-05-26$35,000 Active
-
2026-03-31historical
-
2026-03-31historical
-
2025-11-07historical
-
2025-11-07$35,000 Active
-
2025-11-07$35,000 Active
-
2024-11-09status Pending
-
2024-11-09status Pending
-
2024-11-07historical
-
2024-07-23price $35,000
-
2024-07-23price $35,000
-
2024-04-20price $45,000
-
2024-04-20price $45,000
-
2024-02-16price $55,000
-
2024-02-16price $55,000
-
2023-12-29$65,000 Active
-
2023-12-29$65,000 Active
-
2000-06-30soldstatus $40,000
-
2000-06-06soldstatus $45,900
ⓘ Source: listings_history table (triggers on properties + properties_extension) + one-shot
backfill from property_details.listing_events for pre-trigger history.
Tax reassessment forecast NY · Partial reset (capped growth)
- Current annual tax
- $1,036 · $86/mo
- Projected year-2 tax
- $1,036 · $86/mo
- Expected delta
- $0/yr ($0/mo · 0.0%)
ⓘ Screening estimate from a state-policy table — verify with the county assessor before closing.
Climate risk First Street
- Flood 3/10 Moderate FEMA zone X (unshaded) · 20% chance over 30 yrs
- Wildfire 1/10 Low
- Heat 3/10 Moderate 7 d/yr ≥96°F today · 16 d/yr by 30 yrs out
- Wind 1/10 Low 100% chance of damaging wind over 30 yrs
- Air quality 2/10 Low 0 unhealthy d/yr today · 1 by 30 yrs out
Nearby sold comps map
Loading sold comps map…
Walkable amenities ~0.75 mi
Loading nearby amenities…
Taxation est. · year 1
- Rental income
- $24,893
- − Mortgage interest
- −$1,961
- − Property taxes
- −$1,036
- − Insurance
- −$175
- − Repairs & maintenance
- −$1,991
- − Management
- −$1,991
- − Depreciation
- −$1,018
- Taxable income
- $16,720
- Est. tax owed @ 24.0%
- −$4,013
- After-tax cash flow
- $12,239/yr
For passive investors: Depreciation is non-cash, so a rental often shows a tax loss while cash-flowing — sheltering income. Rental losses are passive: they offset passive income freely, and up to $25,000/yr can offset ordinary (W-2) income if you actively participate and your MAGI is under $100k (phasing out to $0 by $150k); unused losses carry forward. On sale, claimed depreciation is recaptured at up to 25%, and gains may owe capital-gains tax (a 1031 exchange can defer both). Figures are a year-1 estimate at your 24.0% rate — not tax advice; consult a CPA.
Schools (NCES district)
- District
- Auburn City School District
- NCES district ID
- 3603480
- Math proficiency
- 31% ▼ -17.00%
- Reading proficiency
- 39% ▲ 2.00%
- Median HH income
- $43,567
- Composite
- 29.71/100
- National rank
- #6452
- State rank
- #558 of 590 in NY
Livability — Auburn
- Score
- 74/100
- State rank
- #298
- US rank
- #4814
Category grades
Schools grade is shown separately in the Schools card above.
Census & demographics
- Census place
- Auburn, NY
- County
- Cayuga County · 37,247 people
- City population
- 37,247
- Metro
- Auburn, NY
- Population (ZIP)
- 37,247
- Household income
- $60,712
- Rent vs Own
- Severe rent burden
- 1449.0
Population outlook (Cayuga County) Hauer SSP2
- Today (2025)
- 74,820 people
- By 2030
- 72,402 · -3.2%
- By 2040
- 66,917 · -10.6%
- By 2050
- 61,007 · -18.5%
- By 2075
- 48,047 · -35.8%
- By 2100
- 34,512 · -53.9%
Race, ethnicity, and origin ACS 2023
- Neighborhood character
- Predominantly White (87%)
- Race & ethnicity
- White 87% Two or more races 7% Black 3% Hispanic / Latino 3%
- Common ancestry
- Romanian 8% Subsaharan African 3% Lithuanian 2%
- Foreign-born
- 2% · Canada
- Languages at home
- 95% English-only · Spanish 2% Other Indo-European 1% German/W. Germanic 1%
Political lean MEDSL · Cayuga
- 2024 margin
- R (+13.0) · D 43.5% · R 56.5%
- 2008→2024 swing
- -21.5pp toward R · 2008: 8.5pp · 2024: -13.0pp
- All cycles
- 2024: R+13.0 2020: R+9.2 2016: R+13.2 2012: D+10.8 2008: D+8.5
Not yet ingested
- Civics
- —
Market trends
- HPI YoY
- ▼ -97.53%
- Current HPI
- 338.5537
- Rent YoY
- —
- Metro
- Auburn, NY
- State GDP YoY
- ▲ 2.60%
- F500 in state
- 92
Industry mix (Fortune 500 HQ in NY)
| Industry | F500 HQs | Revenue |
|---|---|---|
| Financial Services | 10 | $950B |
|
||
| Consumer Goods | 9 | $162B |
|
||
| Insurance | 4 | $225B |
|
||
| Telecommunications | 2 | $144B |
|
||
| Pharmaceuticals | 2 | $112B |
|
||
| Media / Entertainment | 2 | $69B |
|
||
Price history
-23.7% since first listed19 events — show timeline
- 2026-05-26 Listed $35,000 CNYIS
- 2026-03-31 Listing Removed — CNYIS
- 2026-03-31 Listing Removed — CNYIS
- 2025-11-07 Listing Removed — CNYIS
- 2025-11-07 Listed $35,000 CNYIS
- 2025-11-07 Listed $35,000 CNYIS
- 2024-11-09 Pending — CNYIS
- 2024-11-09 Pending — CNYIS
- 2024-11-07 Listing Removed — CNYIS
- 2024-07-23 Price Changed $35,000 CNYIS
- 2024-07-23 Price Changed $35,000 CNYIS
- 2024-04-20 Price Changed $45,000 CNYIS
- 2024-04-20 Price Changed $45,000 CNYIS
- 2024-02-16 Price Changed $55,000 CNYIS
- 2024-02-16 Price Changed $55,000 CNYIS
- 2023-12-29 Listed $65,000 CNYIS
- 2023-12-29 Listed $65,000 CNYIS
- 2000-06-30 Sold (Public Records) $40,000 Public Records
- 2000-06-06 Sold (Public Records) $45,900 Public Records
Property tax history
-8.2%/yrLatest (2025): $1,036 · +140.8% YoY. Source: county tax records.
Cash-flow waterfall
monthlySold comps — $/sqft
last 12 mo · ≤1 miLoading sold comps…