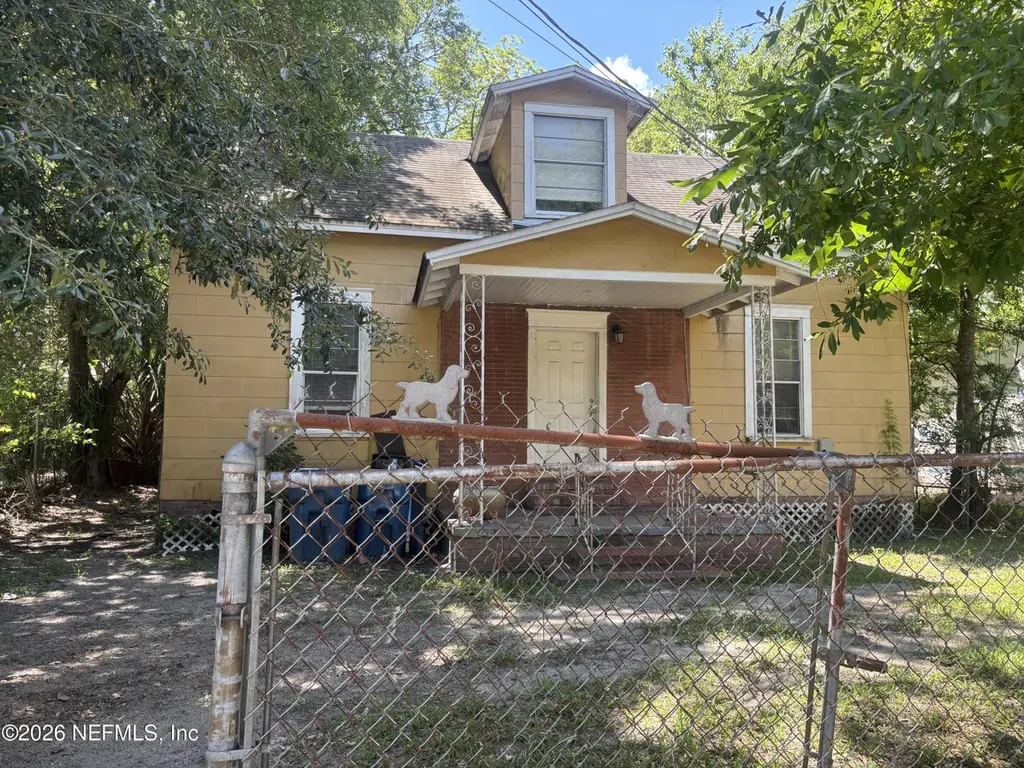
1836 Meharry Ave · Jacksonville, FL
Flood risk 6/10 · Moderate
- FEMA flood zone
- X (unshaded)
- Chance of flooding over 30 yrs
- 0.7%
- Est. flood insurance / yr
- $507 – $1,088
Fire risk 1/10 · Minimal
- Est. fire insurance / yr
- $947 – $1,759
Heat risk 9/10 · Severe
- Hot days now (above 107°F)
- 7 days/yr
- Hot days in 30 yrs
- 19 days/yr
Wind risk 9/10 · Severe
- Chance of severe wind over 30 yrs
- 99.0%
Air-quality risk 4/10 · Minor
- Unhealthy air days now
- 6 days/yr
- Unhealthy air days in 30 yrs
- 6 days/yr
Risk factors via First Street. Map © Google.
Why this score? — see what drove the B- grade
The composite is a weighted blend of 9 inputs, each scored 0–100. Each bar is that input's sub-score; the figure is the points it added to the 100-point composite (weight × sub-score).
- Cash flow +30.0/30.0
- DSCR +10.0/10.0
- 1% rule +8.0/10.0
- ARV discount +7.5/15.0
- Livability +4.2/5.0
- Schools +3.9/10.0
- Rent growth +3.0/5.0
- Condition / age +2.5/5.0
- Appreciation +0.0/10.0
$105,000
🖨 Deal sheet 📄 Offer letter ✓ Due diligence
Listing remarks MLS
INVESTOR SPECIAL! Come see the potential of this property.Lovely lot . Convenient located needs work, ready for renovations bring your tools and your offer. selling AS-IS. Fix and Flip or Buy and Hold .
Key facts
- 5,227 sq ft lot
- Garage
- Built 1938
Property features AI
Finance
- HOA & community: Not a senior community
Exterior
- Parking: Attached garage
- Utilities: Cable available; Electricity available; Sewer available; Water available
- Home design: Single family residence; Currently used as an investment property
- Exterior features: No private pool; Lot is approximately 0.12 acres
Interior
- Kitchen: Electric range; Refrigerator
- Bedrooms: 3 bedrooms
- Bathrooms: 1 full bathroom
- Interior features: Central heating; Central air
Neighborhood map
What this means for you Summary
Snapshot
- This is a 3-bed/1.0-bath single-family listed at $105k.
Deal economics
- At list price, monthly cash flow is $419 ($5k/yr) — positive.
- The deal already cash-flows at list — no discount required.
- Meets the 1% rule at list price ($1k rent vs $105k).
- Recommended offer: $103k (1.5% below list) — sets the bar for market timing.
- Cap rate 11.1% vs local median 4.0% in Jacksonville — top-decile yield for the area; either an underpriced asset or a hidden risk that comps aren't pricing in. Stress-test before assuming the spread holds.
Location & tenants
- Location reads 83/100 on livability (#50 in FL, #911 nationally) — a professional / high-income tenant draw. Strengths: amenities A+, commute A+, housing A+.
- Duval (urban): math 46% / reading 45% proficiency, ranked #48 of 73 in FL (top 66%) — families likely to look elsewhere, expect single-tenant / working-renter base with shorter leases.
- Market conditions: Rents rising (+1.8%/yr); 394 active listings in the ZIP; 40 comparable units currently listed for rent nearby; rentals at typical pace (median 24d on market — plan ~3-4 weeks tenant-placement turnaround); lower-income renter base — watch delinquency; 6,503 units permitted in Duval County in 2024 (1,131 in 5+ unit buildings).
- At $1,365/mo this rent would consume 54% of the median local household income ($31k/yr) (locally 2921% of renters already pay >50% of income on rent) — very limited rent-growth headroom before tenants either downsize or default.
Forward outlook
- Local home prices are declining (-3.0%/yr); year-one equity from $726 of loan paydown is wiped out by about $3k of value loss. Plan a longer hold.
- Duval County population projected at +19% by 2050 — long-run rental-demand tailwind backs the buy-and-hold thesis.
- At projected returns (-3.0% appreciation + 1.8% rent growth), your $29k cash investment doubles in ~8 years — after that, you're playing with house money.
Negotiation context
- It's been on market 23 days — a 2% lower offer ($103k) is reasonable based on typical stale-listing flexibility.
- 2 sale attempts since 9y ago with the ask held roughly flat each time — persistent listings suggest the price (not the market) is what's stuck; bring a comps-based counter.
- Current owner paid $22k; list at $105k implies a 377% gain — meaningful room to come down on a strong offer.
Risks & watch-outs
- Watch-outs: built in 1938 — expect roof / HVAC / electrical / plumbing capex.
- Climate carrying-cost: major flood risk; severe wind risk, 99% chance of damaging wind over 30y; extreme-heat days projected 7→19/yr by 2055 (HVAC capex compounding) — expect insurance premiums to compound above CPI over the hold.
Questions for the listing agent
- Built in 1938 — when were the roof, HVAC, electrical panel, plumbing, and water heater last replaced?
- Is there a deadline driving the sale (1031 exchange, divorce, estate, relocation)? That informs how much negotiation room exists.
- Schools are B-rated — typically a magnet for longer-tenancy family renters. What's the average tenant stay here, and is there a school-zone premium baked into asking?
- What's the average days-on-market for RENTAL listings here right now (not sales)? A rising rental-DOM trend means longer vacancies and softer asking-rent achievability than the comps imply.
- What's the recent tenant-quality profile in this submarket — average credit score on applications, eviction rate, late-payment / NSF rate, and stable-employment percentage? A property-management company in the area should have these aggregated.
- How much new for-sale + rental construction is in the pipeline within 1–3 miles? Heavy new supply typically softens prices + rents 12–24 months out; constrained supply supports both.
Investment metrics
- 1% rule
- 1.30% ✓
- Cap rate
- 11.08%
- Cash-on-cash
- 17.10%
- DSCR
- 1.76
- GRM
- 6.4
CMA / ARV
- ARV (on-the-fly)
- $214,508
- Comps found
- 12
Show comp detail 12 sales within ~0.75 mi
| Address | Dist | Beds/Ba | Sqft | Sold | Price | $/sf | Match |
|---|---|---|---|---|---|---|---|
| 2004 Benedict Rd | 0.20mi | 3/1.0 | 1,215 (-8%) | 3mo | $65,000 | $53 | 75 |
| 1988 Talladega Rd | 0.18mi | 3/2.0 | 1,215 (-8%) | 6mo | $195,017 | $161 | 70 |
| 5755 Teeler Ave | 0.32mi | 3/2.0 | 1,267 (-4%) | 6mo | $229,000 | $181 | 70 |
| 5741 Castellano Ave | 0.38mi | 4/2.0 (+1) | 1,320 (+0%) | 4mo | $99,200 | $75 | 70 |
| 2005 Benedict Rd | 0.20mi | 3/2.0 | 1,209 (-8%) | 8mo | $225,000 | $186 | 67 |
| 5906 Diamond St | 0.48mi | 3/2.0 | 1,262 (-4%) | 1mo | $245,000 | $194 | 66 |
| 1961 Spring Drive Rd | 0.26mi | 4/2.0 (+1) | 1,223 (-7%) | 4mo | $189,000 | $155 | 64 |
| 1719 W 42nd St | 0.46mi | 3/2.0 | 1,262 (-4%) | 7mo | $235,000 | $186 | 62 |
| 1918 Spring Drive Rd | 0.29mi | 4/2.0 (+1) | 1,427 (+8%) | 10mo | $150,000 | $105 | 55 |
| 2239 W 45th St | 0.43mi | 3/2.0 | 1,169 (-11%) | 5mo | $193,020 | $165 | 53 |
| 4139 Fairfax St | 0.72mi | 3/1.0 | 1,137 (-14%) | 5mo | $107,000 | $94 | 39 |
| 1636 W 34th St W | 0.75mi | 4/2.0 (+1) | 1,169 (-11%) | 3mo | $190,000 | $163 | 35 |
Match score weights: distance 35% · size 25% · config 20% · recency 20%. Top-matched comps best support the ARV.
Projected returns pro-forma
-3.0% appreciation · 1.81% rent growth · sell at horizon
- IRR
- 7.1%
- Equity multiple
- 1.27×
- Total profit
- $8,034
- Equity at exit
- $15,656
- IRR
- 15.4%
- Equity multiple
- 2.18×
- Total profit
- $34,803
- Equity at exit
- $9,078
Cash invested: $29,400 (down + closing). Projections, not guarantees.
Landlord ↔ Tenant lean methodology
- Overall (STATE)
- 87 Strongly Landlord-Friendly
- State Florida
- 87 Strongly Landlord-Friendly · R+3
- County
- — inherits STATE
- City
- — inherits STATE
ZIP-level market 32209
- Home prices YoY
- -22.1%
- Rents YoY
- 1.8%
- Active inventory
- 394
- Price-to-rent
- 6.4×
Monthly cashflow live
- Estimated rent
- $1,365 high interval (Pro) →
- Mortgage (P&I)
- −$551
- Tax from tax record
- −$65 /mo · $782/yr
- Insurance
- −$44
- HOA
- −$0
- Vacancy / Maint / Mgmt
- −$287
- Net cashflow
- $419
Break-even live
UW: 25.0% down · 7.5% · 30yr · 1.5% tax · 5.0% vac · 8.0% maint · 8.0% mgmt
Financing live
Cash to close
- Down payment
- $26,250
- Closing costs
- $3,150
- Reserves months
- —
- Total cash needed
- —
Loan-product check · same deal, 3 products live
Conventional
25% down · 7.5% · 30yr
- Down + closing
- —
- Monthly P&I
- —
- Monthly cashflow
- —
- DSCR
- —
- Eligible?
- —
Personal DTI + credit; lowest rate.
DSCR
20% down · 8.5% · 30yr
- Down + closing
- —
- Monthly P&I
- —
- Monthly cashflow
- —
- DSCR
- —
- Eligible?
- —
No personal income docs; deal must DSCR.
Hard money
10% down · 12.0% · 12mo
- Down + closing
- —
- Monthly P&I
- —
- Monthly cashflow
- —
- DSCR
- —
- Eligible?
- —
Short-term bridge; refi at stabilization.
Rent comps 40 comps
| Address | Beds | Baths | Sqft | Rent | $/sqft | DOM | Units | Dist |
|---|---|---|---|---|---|---|---|---|
| 1834 Meharry Ave Jacksonville, FL | 3.0 | 1.0 | 1291 | $1,295 | $1.00 | 4d | 1 | 0.03mi |
| 1959 W 45th St Jacksonville, FL | 2.0 | 1.0 | 895 | $1,245 | $1.39 | 14d | 1 | 0.15mi |
| 1823 W 44th St Jacksonville, FL | 3.0 | 2.0 | 1066 | $1,500 | $1.41 | 24d | 1 | 0.25mi |
| 2069 Talladega Rd Jacksonville, FL | 4.0 | 2.0 | 1152 | $1,298 | $1.13 | 4d | 1 | 0.27mi |
| 5352 Dodge Rd Jacksonville, FL | 3.0 | 2.0 | 1050 | $1,261 | $1.20 | 24d | 1 | 0.30mi |
| 1750 Rutledge Ave Jacksonville, FL | 3.0 | 2.0 | 1250 | $1,358 | $1.09 | 15d | 1 | 0.31mi |
| 5350 Dodge Rd Jacksonville, FL | 3.0 | 1.0 | 1000 | $1,500 | $1.50 | 24d | 1 | 0.31mi |
| 2108 Talladega Rd Jacksonville, FL | 3.0 | 2.0 | 1160 | $1,579 | $1.36 | 4d | 1 | 0.33mi |
| 1867 W 41st St Jacksonville, FL | 3.0 | 2.0 | 1218 | $1,325 | $1.09 | 17d | 1 | 0.37mi |
| 2151 Wilberforce Rd Jacksonville, FL | 3.0 | 2.0 | 1166 | $1,249 | $1.07 | 24d | 1 | 0.42mi |
| 5306 Paris Ave Jacksonville, FL | 3.0 | 1.0 | 944 | $1,150 | $1.22 | 24d | 1 | 0.47mi |
| 5816 Paris Ave Jacksonville, FL | 4.0 | 2.0 | 1701 | $1,599 | $0.94 | 24d | 1 | 0.50mi |
| 2050 W 40th St Jacksonville, FL | 3.0 | 1.0 | 1010 | $1,350 | $1.34 | 16d | 1 | 0.52mi |
| 2268 W 44th St Jacksonville, FL | 3.0 | 2.0 | 1077 | $1,440 | $1.34 | 4d | 1 | 0.53mi |
| 1567 Rutledge Ave Jacksonville, FL | 3.0 | 2.0 | 1050 | $1,113 | $1.06 | 24d | 1 | 0.58mi |
| 5903 Droad St Jacksonville, FL | 3.0 | 1.0 | 1161 | $1,400 | $1.21 | 3d | 1 | 0.69mi |
| 5035 Campenella Dr Jacksonville, FL | 3.0 | 1.0 | 875 | $1,095 | $1.25 | 24d | 1 | 0.71mi |
| 5531 Agra Ct Jacksonville, FL | 3.0 | 1.0 | 988 | $1,295 | $1.31 | 15d | 1 | 0.73mi |
| 6114 Strawflower Pl Jacksonville, FL | 3.0 | 1.0 | 1030 | $1,200 | $1.17 | 24d | 1 | 0.75mi |
| 5565 Minosa Cir E Jacksonville, FL | 3.0 | 1.0 | 1227 | $1,400 | $1.14 | 4d | 1 | 0.78mi |
| 1863 W 29th St Jacksonville, FL | 3.0 | 2.0 | 956 | $1,190 | $1.24 | 21d | 1 | 0.83mi |
| 5326 Mays Dr Jacksonville, FL | 3.0 | 1.0 | 900 | $1,200 | $1.33 | 24d | 1 | 0.85mi |
| 5217 Mays Dr Jacksonville, FL | 3.0 | 1.0 | 900 | $1,250 | $1.39 | 8d | 1 | 0.85mi |
| 1837 W 28th St Jacksonville, FL | 3.0 | 2.0 | 1333 | $1,600 | $1.20 | 24d | 1 | 0.88mi |
| 1490 W 33rd St Jacksonville, FL | 4.0 | 1.5 | 1150 | $1,150 | $1.00 | 24d | 1 | 0.90mi |
| 1587 W 30th St Jacksonville, FL | 3.0 | 1.0 | 1363 | $1,450 | $1.06 | 14d | 1 | 0.91mi |
| 1737 W 28th St Jacksonville, FL | 3.0 | 1.0 | 1105 | $700 | $0.63 | 24d | 1 | 0.91mi |
| 1744 W 28th St Jacksonville, FL | 3.0 | 2.0 | 1556 | $1,750 | $1.12 | 24d | 1 | 0.93mi |
| 1830 W 27th St Jacksonville, FL | 3.0 | 2.0 | 952 | $1,375 | $1.44 | 24d | 1 | 0.95mi |
| 5821 Begonia Rd Jacksonville, FL | 3.0 | 2.0 | 1230 | $1,155 | $0.94 | 4d | 1 | 0.96mi |
| 1636 W 28th St Jacksonville, FL | 3.0 | 2.0 | 912 | $1,375 | $1.51 | 24d | 1 | 0.97mi |
| 5227 Bunche Dr Jacksonville, FL | 3.0 | 2.0 | 1174 | $1,450 | $1.24 | 24d | 1 | 0.97mi |
| 5814 Begonia Rd Unit 1 Jacksonville, FL | 3.0 | 1.5 | 1500 | $1,655 | $1.10 | 24d | 1 | 0.99mi |
| 1348 Crestwood St Jacksonville, FL | 3.0 | 1.0 | 1300 | $1,100 | $0.85 | 24d | 1 | 0.99mi |
| 1842 W 26th St Jacksonville, FL | 3.0 | 2.0 | 933 | $1,200 | $1.29 | 24d | 1 | 1.00mi |
| 5428 Bunche Dr Jacksonville, FL | 3.0 | 1.0 | 900 | $1,600 | $1.78 | 24d | 1 | 1.00mi |
| 2312 Palmdale St Jacksonville, FL | 3.0 | 2.0 | 972 | $1,231 | $1.27 | 24d | 1 | 1.02mi |
| 1530 W 29th St Jacksonville, FL | 3.0 | 2.0 | 1164 | $1,385 | $1.19 | 24d | 1 | 1.02mi |
| 1417 W 31st St Jacksonville, FL | 3.0 | 1.0 | 880 | $1,100 | $1.25 | 2d | 1 | 1.04mi |
| 5838 Abelia Rd Jacksonville, FL | 3.0 | 1.0 | 1135 | $1,150 | $1.01 | 24d | 1 | 1.05mi |
Listing history 20 events
-
2026-06-18days on market $105,000 Active 23 DOM
-
2026-06-17days on market $105,000 Active 22 DOM
-
2026-06-16days on market $105,000 Active 21 DOM
-
2026-06-15days on market $105,000 Active 20 DOM
-
2026-06-13days on market $105,000 Active 18 DOM
-
2026-06-13days on market $105,000 Active 17 DOM
-
2026-06-10days on market $105,000 Active 14 DOM
-
2026-06-08days on market $105,000 Active 13 DOM
-
2026-06-07days on market $105,000 Active 12 DOM
-
2026-06-05days on market $105,000 Active 9 DOM
-
2026-06-03days on market $105,000 Active 8 DOM
-
2026-06-02days on market $105,000 Active 7 DOM
-
2026-06-01days on market $105,000 Active 6 DOM
-
2026-05-31days on market $105,000 Active 5 DOM
-
2026-05-26$105,000 Active
-
2022-08-05price $1,175
-
2017-08-31soldstatus $22,000 Sold 205-char remark
Show marketing remark (205 chars)
INVESTOR SPECIAL! Come see the potential of this property.Lovely lot . Convenient located needs work, ready for renovations bring your tools and your offer. selling AS-IS. Fix and Flip or Buy and Hold .
-
2017-08-16status Pending 205-char remark
Show marketing remark (205 chars)
INVESTOR SPECIAL! Come see the potential of this property.Lovely lot . Convenient located needs work, ready for renovations bring your tools and your offer. selling AS-IS. Fix and Flip or Buy and Hold .
-
2017-07-30price $29,500 205-char remark
Show marketing remark (205 chars)
INVESTOR SPECIAL! Come see the potential of this property.Lovely lot . Convenient located needs work, ready for renovations bring your tools and your offer. selling AS-IS. Fix and Flip or Buy and Hold .
-
2017-07-02$30,500 Active 205-char remark
Show marketing remark (205 chars)
INVESTOR SPECIAL! Come see the potential of this property.Lovely lot . Convenient located needs work, ready for renovations bring your tools and your offer. selling AS-IS. Fix and Flip or Buy and Hold .
ⓘ Source: listings_history table (triggers on properties + properties_extension) + one-shot
backfill from property_details.listing_events for pre-trigger history.
Tax reassessment forecast FL · Resets to sale price
- Current annual tax
- $782 · $65/mo
- Projected year-2 tax
- $872 · $73/mo
- Expected delta
- +$89/yr (+$7/mo · 11.4%)
ⓘ Screening estimate from a state-policy table — verify with the county assessor before closing.
Climate risk First Street
- Flood 6/10 Major FEMA zone X (unshaded) · 70% chance over 30 yrs
- Wildfire 1/10 Low
- Heat 9/10 Extreme 7 d/yr ≥107°F today · 19 d/yr by 30 yrs out
- Wind 9/10 Extreme 99% chance of damaging wind over 30 yrs
- Air quality 4/10 Moderate 6 unhealthy d/yr today · 6 by 30 yrs out
Nearby sold comps map
Loading sold comps map…
Walkable amenities ~0.75 mi
Loading nearby amenities…
Taxation est. · year 1
- Rental income
- $16,383
- − Mortgage interest
- −$5,882
- − Property taxes
- −$782
- − Insurance
- −$525
- − Repairs & maintenance
- −$1,311
- − Management
- −$1,311
- − Depreciation
- −$3,055
- Taxable income
- $3,518
- Est. tax owed @ 24.0%
- −$844
- After-tax cash flow
- $4,183/yr
For passive investors: Depreciation is non-cash, so a rental often shows a tax loss while cash-flowing — sheltering income. Rental losses are passive: they offset passive income freely, and up to $25,000/yr can offset ordinary (W-2) income if you actively participate and your MAGI is under $100k (phasing out to $0 by $150k); unused losses carry forward. On sale, claimed depreciation is recaptured at up to 25%, and gains may owe capital-gains tax (a 1031 exchange can defer both). Figures are a year-1 estimate at your 24.0% rate — not tax advice; consult a CPA.
Schools (NCES district)
- District
- Duval
- NCES district ID
- 1200480
- Math proficiency
- 46% ▼ -11.00%
- Reading proficiency
- 45% ▼ -4.00%
- Median HH income
- $48,987
- Composite
- 38.97/100
- National rank
- #4076
- State rank
- #48 of 73 in FL
Livability — Jacksonville
- Score
- 83/100
- State rank
- #50
- US rank
- #911
Category grades
Schools grade is shown separately in the Schools card above.
Census & demographics
- Census place
- Jacksonville, FL
- County
- Duval County · 1,015,274 people
- City population
- 979,034
- Metro
- Jacksonville, FL
- Population (ZIP)
- 34,657
- Household income
- $30,514
- Rent vs Own
- Severe rent burden
- 2921.0
Population outlook (Duval County) Hauer SSP2
- Today (2025)
- 1,013,010 people
- By 2030
- 1,059,228 · +4.6%
- By 2040
- 1,141,439 · +12.7%
- By 2050
- 1,205,258 · +19.0%
- By 2075
- 1,324,282 · +30.7%
- By 2100
- 1,319,620 · +30.3%
Race, ethnicity, and origin ACS 2023
- Neighborhood character
- Predominantly Black (88%)
- Race & ethnicity
- Black 88% White 5% Hispanic / Latino 5% Two or more races 2%
- Hispanic origin (detail)
- Puerto Rican 3%
- Common ancestry
- Hispanic 1% Romanian 1%
- Foreign-born
- 3% · Canada
- Languages at home
- 95% English-only · Spanish 4% French/Haitian/Cajun 1%
Political lean MEDSL · Duval
- 2024 margin
- Toss-up / Even · D 48.7% · R 50.1% · Other 1.2%
- 2008→2024 swing
- +0.4pp no change · 2008: -1.9pp · 2024: -1.5pp
- All cycles
- 2024: R+1.5 2020: D+3.8 2016: R+1.5 2012: R+3.6 2008: R+1.9
Not yet ingested
- Civics
- —
Market trends
- HPI YoY
- ▼ -53.92%
- Current HPI
- 189.5977
- Rent YoY
- ▲ 1.81%
- Metro
- Jacksonville, FL
- State GDP YoY
- ▲ 3.28%
- F500 in state
- 36
Industry mix (Fortune 500 HQ in FL)
| Industry | F500 HQs | Revenue |
|---|---|---|
| Industrial Technology | 2 | $29B |
|
||
| Insurance | 2 | $17B |
|
||
| Retail | 1 | $60B |
|
||
| Technology Distribution | 1 | $58B |
|
||
| Homebuilding | 1 | $35B |
|
||
| Technology Manufacturing | 1 | $35B |
|
||
Price history
+244.3% since first listed6 events — show timeline
- 2026-05-26 Listed $105,000 realMLS
- 2022-08-05 Price Changed $1,175 RENT.
- 2017-08-31 Sold (MLS) $22,000 realMLS
- 2017-08-16 Pending — realMLS
- 2017-07-30 Price Changed $29,500 realMLS
- 2017-07-02 Listed $30,500 realMLS
Property tax history
+0.4%/yrLatest (2025): $782 · +31.2% YoY. Source: county tax records.
Cash-flow waterfall
monthlySold comps — $/sqft
last 12 mo · ≤1 miLoading sold comps…