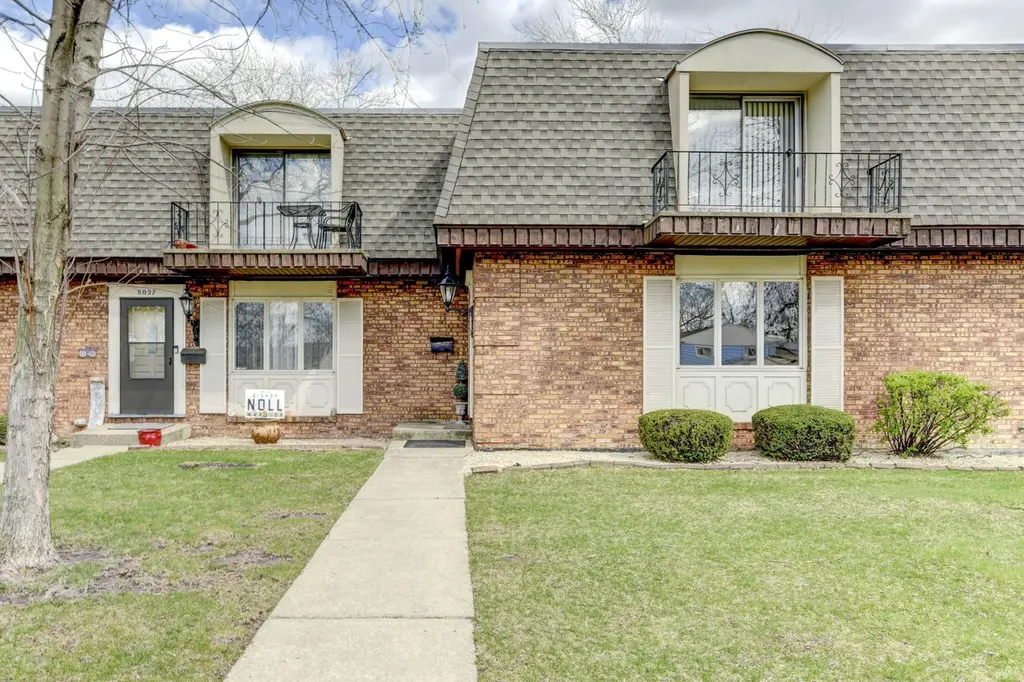
8029 Jefferson Ave · Munster, IN
Flood risk 1/10 · Minimal
- FEMA flood zone
- X (shaded)
- Chance of flooding over 30 yrs
- 0.0%
- Est. flood insurance / yr
- $473 – $860
Fire risk 1/10 · Minimal
- Est. fire insurance / yr
- $717 – $1,331
Heat risk 3/10 · Minor
- Hot days now (above 102°F)
- 7 days/yr
- Hot days in 30 yrs
- 15 days/yr
Wind risk 2/10 · Minimal
- Chance of severe wind over 30 yrs
- 0.0%
Air-quality risk 4/10 · Minor
- Unhealthy air days now
- 5 days/yr
- Unhealthy air days in 30 yrs
- 6 days/yr
Risk factors via First Street. Map © Google.
Why this score? — see what drove the C- grade
The composite is a weighted blend of 9 inputs, each scored 0–100. Each bar is that input's sub-score; the figure is the points it added to the 100-point composite (weight × sub-score).
- Cash flow +18.1/30.0
- ARV discount +8.4/15.0
- 1% rule +6.2/10.0
- DSCR +5.7/10.0
- Schools +5.7/10.0
- Livability +4.0/5.0
- Rent growth +2.5/5.0
- Condition / age +2.5/5.0
- Appreciation +0.0/10.0
$239,900
🖨 Deal sheet 📄 Offer letter ✓ Due diligence
Listing remarks MLS
Spacious and well-maintained 3 bed, 1.5 bath townhome offering 1,689 finished sq ft! The main level features a large living room with durable laminate flooring and a separate dining room with hardwood floors and a patio slider leading to a beautiful backyard with a NEW fence and expansive concrete patio--perfect for outdoor entertaining. The kitchen includes oak cabinets and a convenient breakfast bar, along with an updated half bath on the main level. Upstairs, you'll find three generously sized bedrooms, all with laminate flooring. The spacious primary bedroom features a walk-in closet and private balcony, while the additional bedrooms offer ample closet space. Full bath with tub shower combo. The partially finished basement provides a comfortable family room for extra living space, along with a laundry/utility room that includes a washer and dryer, NEW water heater, and a walk-in shower. Ideally located near highways, schools, shopping, and the new South Shore train station, this home offers both comfort and convenience!
Key facts
- Oak cabinets
- Private balcony
- Walk-in closet
Tags
Neighborhood map
What this means for you Summary
Snapshot
- This is a 2-bed/1.5-bath townhouse listed at $240k.
Deal economics
- At list price, monthly cash flow is $211 ($3k/yr) — positive.
- The deal already cash-flows at list — no discount required.
- Meets the 1% rule at list price ($3k rent vs $240k).
- Recommended offer: $233k (3.0% below list) — sets the bar for market timing.
- Cap rate 7.3% vs local median 5.0% in Munster — top-decile yield for the area; either an underpriced asset or a hidden risk that comps aren't pricing in. Stress-test before assuming the spread holds.
Location & tenants
- Location reads 81/100 on livability (#17 in IN, #1,427 nationally) — a professional / high-income tenant draw. Strengths: schools A+, crime A+, employment A+; Watch: amenities F, commute F.
- School Town Of Munster (suburban): math 65% / reading 64% proficiency, ranked #6 of 301 in IN (top 2%) — acceptable for families but not a draw, mixed tenant base, ~2y average lease; only 14% free/reduced lunch — higher-income household profile.
- Market conditions: 112 active listings in the ZIP; 7 comparable units currently listed for rent nearby; rentals leasing fast (median 2d on market — plan ~1-2 weeks tenant-placement turnaround); high-income renter base; 1,642 units permitted in Lake County in 2024 (14 in 5+ unit buildings).
Forward outlook
- Local home prices are declining (-3.0%/yr); year-one equity from $2k of loan paydown is wiped out by about $7k of value loss. Plan a longer hold.
- Lake County population projected to shrink 7% by 2050 — rents likely to lag national; underwrite the cash flow, not the appreciation.
Negotiation context
- It's been on market 46 days — a 3% lower offer ($233k) is reasonable based on typical stale-listing flexibility.
- 5 sale attempts since 27y ago with the ask held roughly flat each time — persistent listings suggest the price (not the market) is what's stuck; bring a comps-based counter.
- Current owner paid $101k; list at $240k implies a 138% gain — meaningful room to come down on a strong offer.
Questions for the listing agent
- It's been on market 46 days. Have you received any prior offers? Is the seller open to a 3% concession, seller financing, or rate buy-down credit?
- Built in 1973 — when were the roof, HVAC, electrical panel, plumbing, and water heater last replaced?
- What does the HOA fee cover, when was the last increase, and are there any pending special assessments or reserve-fund shortfalls?
- Is there a deadline driving the sale (1031 exchange, divorce, estate, relocation)? That informs how much negotiation room exists.
- Schools are A-rated — typically a magnet for longer-tenancy family renters. What's the average tenant stay here, and is there a school-zone premium baked into asking?
- What's the average days-on-market for RENTAL listings here right now (not sales)? A rising rental-DOM trend means longer vacancies and softer asking-rent achievability than the comps imply.
- What's the recent tenant-quality profile in this submarket — average credit score on applications, eviction rate, late-payment / NSF rate, and stable-employment percentage? A property-management company in the area should have these aggregated.
- How much new for-sale + rental construction is in the pipeline within 1–3 miles? Heavy new supply typically softens prices + rents 12–24 months out; constrained supply supports both.
Investment metrics
- 1% rule
- 1.12% ✓
- Cap rate
- 7.35%
- Cash-on-cash
- 3.77%
- DSCR
- 1.17
- GRM
- 7.4
CMA / ARV
- ARV (median comp)
- $244,789
- List price
- $239,900
- Delta
- -2.00%
- Verdict
- FAIR
- Comps
- 20 within 1.0 mi
Show comp detail 8 sales within ~0.75 mi
| Address | Dist | Beds/Ba | Sqft | Sold | Price | $/sf | Match |
|---|---|---|---|---|---|---|---|
| 7935 Jefferson Ave | 0.12mi | 2/1.5 | 1,344 (0%) | 18mo | $240,000 | $179 | 80 |
| 7847 Jefferson Ave | 0.21mi | 2/1.5 | 1,288 (-4%) | 15mo | $219,900 | $171 | 71 |
| 643 South St #204 | 0.48mi | 2/1.5 | 1,260 (-6%) | 3mo | $156,000 | $124 | 65 |
| 8147 Hohman Ave | 0.64mi | 2/2.0 | 1,296 (-4%) | 3mo | $212,000 | $164 | 60 |
| 314 Belmont Pl | 0.50mi | 2/2.0 | 1,440 (+7%) | 4mo | $215,000 | $149 | 60 |
| 8421 Manor Ave #203 | 0.65mi | 2/2.0 | 1,300 (-3%) | 22mo | $225,000 | $173 | 44 |
| 8445 Manor Ave #103 | 0.70mi | 2/2.0 | 1,300 (-3%) | 21mo | $222,000 | $171 | 42 |
| 8445 Manor Ave #404 | 0.70mi | 2/2.0 | 1,450 (+8%) | 23mo | $218,000 | $150 | 33 |
Match score weights: distance 35% · size 25% · config 20% · recency 20%. Top-matched comps best support the ARV.
Projected returns pro-forma
-3.0% appreciation · 3.0% rent growth · sell at horizon
- IRR
- -10.3%
- Equity multiple
- 0.62×
- Total profit
- $-25,220
- Equity at exit
- $35,770
- IRR
- -0.8%
- Equity multiple
- 0.94×
- Total profit
- $-3,828
- Equity at exit
- $20,742
Cash invested: $67,172 (down + closing). Projections, not guarantees.
Landlord ↔ Tenant lean methodology
- Overall (STATE)
- 90 Strongly Landlord-Friendly
- State Indiana
- 90 Strongly Landlord-Friendly · R+11
- County
- — inherits STATE
- City
- — inherits STATE
ZIP-level market 46321
- Active inventory
- 112
- Price-to-rent
- 7.4×
Monthly cashflow live
- Estimated rent
- $2,691 high interval (Pro) →
- Mortgage (P&I)
- −$1,258
- Tax from tax record
- −$357 /mo · $4,282/yr
- Insurance
- −$100
- HOA
- −$200
- Vacancy / Maint / Mgmt
- −$565
- Net cashflow
- $211
Break-even live
UW: 25.0% down · 7.5% · 30yr · 1.5% tax · 5.0% vac · 8.0% maint · 8.0% mgmt
Financing live
Cash to close
- Down payment
- $59,975
- Closing costs
- $7,197
- Reserves months
- —
- Total cash needed
- —
Loan-product check · same deal, 3 products live
Conventional
25% down · 7.5% · 30yr
- Down + closing
- —
- Monthly P&I
- —
- Monthly cashflow
- —
- DSCR
- —
- Eligible?
- —
Personal DTI + credit; lowest rate.
DSCR
20% down · 8.5% · 30yr
- Down + closing
- —
- Monthly P&I
- —
- Monthly cashflow
- —
- DSCR
- —
- Eligible?
- —
No personal income docs; deal must DSCR.
Hard money
10% down · 12.0% · 12mo
- Down + closing
- —
- Monthly P&I
- —
- Monthly cashflow
- —
- DSCR
- —
- Eligible?
- —
Short-term bridge; refi at stabilization.
Rent comps 7 comps
| Address | Beds | Baths | Sqft | Rent | $/sqft | DOM | Units | Dist |
|---|---|---|---|---|---|---|---|---|
| 232 Gregory Ave Munster, IN | 3.0 | 1.5 | 1600 | $2,450 | $1.53 | 1d | 1 | 0.69mi |
| 7610 Manor Ave Munster, IN | 3.0 | 2.0 | 1700 | $4,750 | $2.79 | 1d | 1 | 0.77mi |
| 7611 Kinsley Pl Munster, IN | 3.0 | 2.0 | 1700 | $4,700 | $2.76 | 1d | 1 | 0.80mi |
| 7234 Columbia Ave Hammond, IN | 2.0 | 1.0 | 960 | $1,300 | $1.35 | 24d | 1 | 1.13mi |
| 3649 173rd Ct Lansing, IL | 2.0 | 2.0 | 972 | $1,357 | $1.40 | 24d | 1 | 1.22mi |
| 18335 Sherman St Unit 3 Lansing, IL | 3.0 | 1.0 | 1000 | $1,700 | $1.70 | 1d | 1 | 1.23mi |
| 7129 Columbia Ave Unit 1E Hammond, IN | 2.0 | 1.0 | 900 | $1,195 | $1.33 | 11d | 1 | 1.27mi |
HOA detail
- Monthly dues
- $200 · $2,400/yr
- Likely covers
- water
Listing history 16 events
-
2026-06-18price $239,900 Active 46 DOM
-
2026-06-18days on market $247,500 Active 46 DOM
-
2026-06-17status $247,500 Active 45 DOM
-
2026-06-04status $247,500 Pending 45 DOM
-
2026-06-03days on market $247,500 Active 45 DOM
-
2026-06-02days on market $247,500 Active 44 DOM
-
2026-06-01days on market $247,500 Active 43 DOM
-
2026-05-31statusdays on market $247,500 Active 42 DOM
-
2026-04-09$247,500 Active 1039-char remark
Show marketing remark (1039 chars)
Spacious and well-maintained 3 bed, 1.5 bath townhome offering 1,689 finished sq ft! The main level features a large living room with durable laminate flooring and a separate dining room with hardwood floors and a patio slider leading to a beautiful backyard with a NEW fence and expansive concrete patio--perfect for outdoor entertaining. The kitchen includes oak cabinets and a convenient breakfast bar, along with an updated half bath on the main level. Upstairs, you'll find three generously sized bedrooms, all with laminate flooring. The spacious primary bedroom features a walk-in closet and private balcony, while the additional bedrooms offer ample closet space. Full bath with tub shower combo. The partially finished basement provides a comfortable family room for extra living space, along with a laundry/utility room that includes a washer and dryer, NEW water heater, and a walk-in shower. Ideally located near highways, schools, shopping, and the new South Shore train station, this home offers both comfort and convenience!
-
2017-03-01soldstatus $101,000 551-char remark
Show marketing remark (551 chars)
Well maintained, Brick, 3 bedroom 2+ bath townhome-style condo features basement with shower, one car garage, open concept design, kitchen and formal dining room with new oak wood floors and appliances included. newer Laminate flooring in Living room. Upper level with 3 bed, full bath, and balcony. Private fenced back patio, Nicely landscaped, brand new roof, furnace, Water Heater, and updated Electric approx. 8 years old, Taxes approx. $2000 with exemptions. 3% Ins. Conv. Program Available. Home warranty. Immediate possession. MUNSTER schools!
-
2016-10-07$115,000 551-char remark
Show marketing remark (551 chars)
Well maintained, Brick, 3 bedroom 2+ bath townhome-style condo features basement with shower, one car garage, open concept design, kitchen and formal dining room with new oak wood floors and appliances included. newer Laminate flooring in Living room. Upper level with 3 bed, full bath, and balcony. Private fenced back patio, Nicely landscaped, brand new roof, furnace, Water Heater, and updated Electric approx. 8 years old, Taxes approx. $2000 with exemptions. 3% Ins. Conv. Program Available. Home warranty. Immediate possession. MUNSTER schools!
-
2009-01-31historical
-
2008-07-02$134,910
-
2008-07-01historical
-
2007-09-26$149,888
-
1999-05-14$103,000
ⓘ Source: listings_history table (triggers on properties + properties_extension) + one-shot
backfill from property_details.listing_events for pre-trigger history.
Tax reassessment forecast IN · Partial reset (capped growth)
- Current annual tax
- $4,282 · $357/mo
- Projected year-2 tax
- $4,282 · $357/mo
- Expected delta
- $0/yr ($0/mo · 0.0%)
ⓘ Screening estimate from a state-policy table — verify with the county assessor before closing.
Climate risk First Street
- Flood 1/10 Low FEMA zone X (shaded) · 0% chance over 30 yrs
- Wildfire 1/10 Low
- Heat 3/10 Moderate 7 d/yr ≥102°F today · 15 d/yr by 30 yrs out
- Wind 2/10 Low 0% chance of damaging wind over 30 yrs
- Air quality 4/10 Moderate 5 unhealthy d/yr today · 6 by 30 yrs out
Nearby sold comps map
Loading sold comps map…
Walkable amenities ~0.75 mi
Loading nearby amenities…
Taxation est. · year 1
- Rental income
- $32,295
- − Mortgage interest
- −$13,438
- − Property taxes
- −$4,282
- − Insurance
- −$1,200
- − Repairs & maintenance
- −$2,584
- − Management
- −$2,584
- − HOA
- −$2,400
- − Depreciation
- −$6,979
- Taxable loss
- −$1,170
- Est. tax savings @ 24.0%
- +$281
- After-tax cash flow
- $2,816/yr
For passive investors: Depreciation is non-cash, so a rental often shows a tax loss while cash-flowing — sheltering income. Rental losses are passive: they offset passive income freely, and up to $25,000/yr can offset ordinary (W-2) income if you actively participate and your MAGI is under $100k (phasing out to $0 by $150k); unused losses carry forward. On sale, claimed depreciation is recaptured at up to 25%, and gains may owe capital-gains tax (a 1031 exchange can defer both). Figures are a year-1 estimate at your 24.0% rate — not tax advice; consult a CPA.
Schools (NCES district)
- District
- School Town Of Munster
- NCES district ID
- 1807350
- Math proficiency
- 65% ▼ -1.00%
- Reading proficiency
- 64% ▼ -4.00%
- Median HH income
- $71,901
- Composite
- 56.91/100
- National rank
- #1115
- State rank
- #6 of 301 in IN
Livability — Munster
- Score
- 81/100
- State rank
- #17
- US rank
- #1427
Category grades
Schools grade is shown separately in the Schools card above.
Census & demographics
- Census place
- Munster, IN
- County
- Lake County · 422,878 people
- City population
- 23,733
- Metro
- Chicago-Naperville-Elgin, IL-IN-WI
- Population (ZIP)
- 23,733
- Household income
- $110,187
- Rent vs Own
- Severe rent burden
- 338.0
Population outlook (Lake County) Hauer SSP2
- Today (2025)
- 484,026 people
- By 2030
- 478,091 · -1.2%
- By 2040
- 462,974 · -4.3%
- By 2050
- 449,894 · -7.1%
- By 2075
- 436,169 · -9.9%
- By 2100
- 426,607 · -11.9%
Race, ethnicity, and origin ACS 2023
- Neighborhood character
- Predominantly White (71%)
- Race & ethnicity
- White 71% Hispanic / Latino 14% Two or more races 8% Black 7% Asian 6%
- Hispanic origin (detail)
- Mexican 11% Puerto Rican 2%
- Common ancestry
- Romanian 16% Iranian 4% Lithuanian 1%
- Foreign-born
- 9% · Canada, South Korea, China
- Languages at home
- 86% English-only · Spanish 6% Russian/Polish/Slavic 3% Other Indo-European 2%
Political lean MEDSL · Lake
- 2024 margin
- Lean D (+5.6) · D 52.1% · R 46.5% · Other 1.5%
- 2008→2024 swing
- -28.6pp toward R · 2008: 34.3pp · 2024: 5.6pp
- All cycles
- 2024: D+5.6 2020: D+15.1 2016: D+20.6 2012: D+31.0 2008: D+34.3
Not yet ingested
- Civics
- —
Market trends
- HPI YoY
- ▼ -213.34%
- Current HPI
- 232.4818
- Rent YoY
- —
- Metro
- Chicago-Naperville-Elgin, IL-IN-WI
- State GDP YoY
- ▲ 2.90%
- F500 in state
- 18
Industry mix (Fortune 500 HQ in IN)
| Industry | F500 HQs | Revenue |
|---|---|---|
| Industrial Machinery | 2 | $37B |
|
||
| Healthcare | 1 | $177B |
|
||
| Pharmaceuticals | 1 | $45B |
|
||
| Metals / Steel | 1 | $18B |
|
||
| Agriculture | 1 | $17B |
|
||
| Packaging | 1 | $12B |
|
||
Price history
+140.3% since first listed8 events — show timeline
- 2026-04-09 Listed $247,500 NIRA MLS as Distributed by MLS Grid
- 2017-03-01 Sold (MLS) $101,000 NIRA MLS as Distributed by MLS Grid
- 2016-10-07 Listed $115,000 NIRA MLS as Distributed by MLS Grid
- 2009-01-31 Listing Removed — NIRA MLS as Distributed by MLS Grid
- 2008-07-02 Listed $134,910 NIRA MLS as Distributed by MLS Grid
- 2008-07-01 Listing Removed — NIRA MLS as Distributed by MLS Grid
- 2007-09-26 Listed $149,888 NIRA MLS as Distributed by MLS Grid
- 1999-05-14 Listed $103,000 NIRA MLS as Distributed by MLS Grid
Property tax history
-0.4%/yrLatest (2024): $4,282 · +1.5% YoY. Source: county tax records.
Cash-flow waterfall
monthlySold comps — $/sqft
last 12 mo · ≤1 miLoading sold comps…