 Fourplex
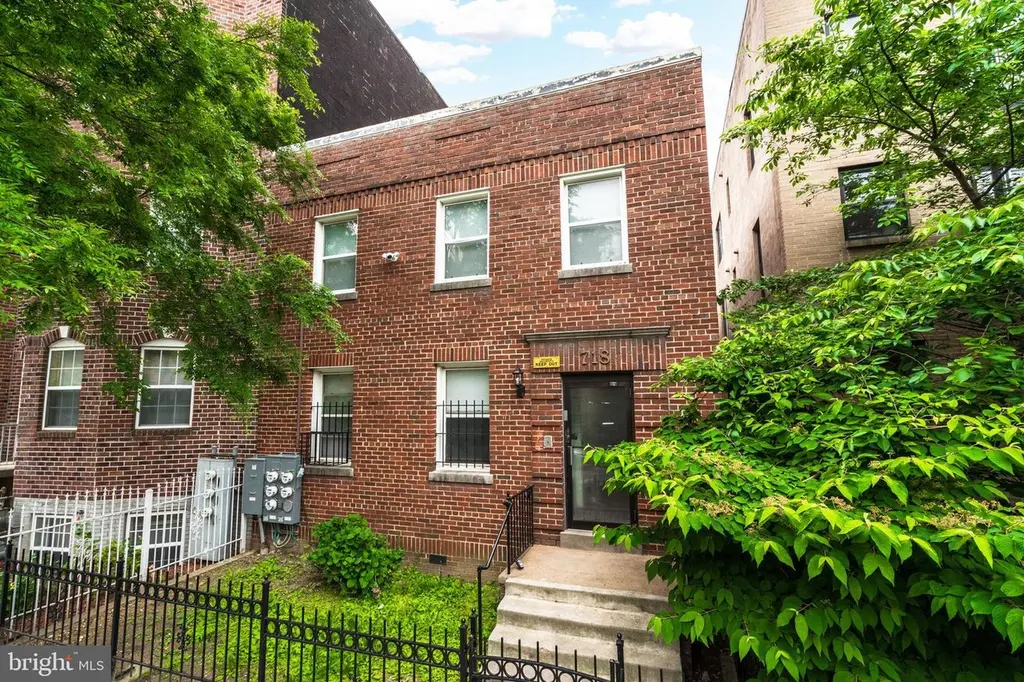
718 Lamont St NW · Washington, DC
Flood risk 1/10 · Minimal
- FEMA flood zone
- X (unshaded)
- Chance of flooding over 30 yrs
- 0.0%
- Est. flood insurance / yr
- $507 – $1,088
Fire risk 1/10 · Minimal
- Est. fire insurance / yr
- $631 – $1,173
Heat risk 7/10 · Major
- Hot days now (above 105°F)
- 7 days/yr
- Hot days in 30 yrs
- 15 days/yr
Wind risk 4/10 · Minor
- Chance of severe wind over 30 yrs
- 16.0%
Air-quality risk 4/10 · Minor
- Unhealthy air days now
- 4 days/yr
- Unhealthy air days in 30 yrs
- 5 days/yr
Risk factors via First Street. Map © Google.
Why this score? — see what drove the D- grade
The composite is a weighted blend of 9 inputs, each scored 0–100. Each bar is that input's sub-score; the figure is the points it added to the 100-point composite (weight × sub-score).
- Cash flow +15.8/30.0
- DSCR +4.9/10.0
- Livability +3.7/5.0
- Schools +3.6/10.0
- 1% rule +3.5/10.0
- Rent growth +2.6/5.0
- Condition / age +2.5/5.0
- ARV discount +0.0/15.0
- Appreciation +0.0/10.0
$1,199,999
🖨 Deal sheet (PDF) 📄 Offer letter ✓ Due diligence
Multi-family units
County records classify this as Multi-Family (2-4 Unit). Listing-text estimate: 4 units. confirmed
Listing remarks MLS
Investor Alert!!! 4-unit building for sale. Current layout includes 1-two bedroom and 3-one bedroom units with separated utilities (except water). This property can be used as a buy and hold with major upgrades to the units or converted to luxury condos in booming Petworth neighborhood. Building has RF-1 zoning restrictions, but has plenty of potential including adding parking in the large rear lot. Agents, please follow CDC guidelines when showing property and leave all lights off after showing.
Key facts
- Central hvac
- Rent control exempt
- 3,563 sq ft lot
Tags
Property features AI
Finance
- Financial info: Fee simple ownership
Exterior
- Parking: On-street parking
- Utilities: Public water; Public sewer; Electric hot water
- Home design: Brick construction; 4-unit multifamily property; Above-grade and below-grade structures
- Construction: Brick exterior; Estimated year built
- Exterior features: No tidal water
Interior
- Bedrooms: Three 2-bedroom units and one 3-bedroom unit
- Heating & cooling: Hot water heating; Central air conditioning (electric)
- Interior features: Estimated living area
Neighborhood map
What this means for you Summary
Snapshot
- This is a 3×2bd/1ba + 1×3bd/1ba units multifamily listed at $1.20M.
Deal economics
- At list price, monthly cash flow is $541 ($6k/yr) — positive. Per door: $135/mo.
- The deal already cash-flows at list — no discount required.
- To meet the 1% rule (rent ≥ 1% of price), the offer needs to be $1.02M (14.9% below list).
- Recommended offer: $1.02M (14.9% below list) — sets the bar for 1% rule.
- Cap rate 6.8% vs local median 2.5% in Washington — top-decile yield for the area; either an underpriced asset or a hidden risk that comps aren't pricing in. Stress-test before assuming the spread holds.
Location & tenants
- Location reads 73/100 on livability (#1 in DC) — a middle-class / working-renter tenant base. Strengths: amenities A+, commute A+, employment A+; Watch: crime F, cost of living F.
- District Of Columbia Public Schools (urban): math 33% / reading 40% proficiency, ranked #8 of 32 in DC (top 25%) — families likely to look elsewhere, expect single-tenant / working-renter base with shorter leases; 65% free/reduced lunch — lower-income household profile, screen leases tightly.
- Zoned schools: Tubman Es (540 students, 0% FRL); Cardozo Education Campus (639 students, 0% FRL) — zoned schools average 0% FRL vs 65% district-wide (65 pts lower); this property's tenant base skews higher-income than the district average.
- Market conditions: Rents flat; 178 active listings in the ZIP; 40 comparable units currently listed for rent nearby; rentals at typical pace (median 21d on market — plan ~3-4 weeks tenant-placement turnaround); high-income renter base; 1,737 units permitted in District of Columbia in 2024 (1,506 in 5+ unit buildings).
- At $10,213/mo this rent would consume 107% of the median local household income ($114k/yr) (locally 1344% of renters already pay >50% of income on rent) — very limited rent-growth headroom before tenants either downsize or default.
Forward outlook
- Local home prices are declining (-3.0%/yr); year-one equity from $8k of loan paydown is wiped out by about $36k of value loss. Plan a longer hold.
- District of Columbia County population projected at +50% by 2050 — long-run rental-demand tailwind backs the buy-and-hold thesis.
Negotiation context
- It's been on market 41 days — a 3% lower offer ($1.16M) is reasonable based on typical stale-listing flexibility.
- 4 sale attempts since 5y ago; this cycle's ask has dropped $350k (23%) from the opening price — seller is motivated, your offer sets the floor, not the list.
Risks & watch-outs
- Watch-outs: built in 1940 — expect roof / HVAC / electrical / plumbing capex.
- Climate carrying-cost: extreme-heat days projected 7→15/yr by 2055 (HVAC capex compounding) — expect insurance premiums to compound above CPI over the hold.
Questions for the listing agent
- It's been on market 41 days. Have you received any prior offers? Is the seller open to a 15% concession, seller financing, or rate buy-down credit?
- Can we see the unit-by-unit rent roll, current vacancy, and any below-market leases? What's the average tenancy length?
- What capital expenditures (roof, boiler, parking lot, exteriors) have been made in the last 5 years, and what's planned in the next 2?
- Built in 1940 — when were the roof, HVAC, electrical panel, plumbing, and water heater last replaced?
- Is there a deadline driving the sale (1031 exchange, divorce, estate, relocation)? That informs how much negotiation room exists.
- Crime grade is F in this area — have there been break-ins, vandalism, or insurance claims at this property in the last 3 years? What carrier currently insures it and at what premium?
- The area grade is low — what's the realistic commute time and amenity access for the typical tenant pool here? Any planned neighborhood developments (good or bad) we should know about?
- What's the average days-on-market for RENTAL listings here right now (not sales)? A rising rental-DOM trend means longer vacancies and softer asking-rent achievability than the comps imply.
- What's the recent tenant-quality profile in this submarket — average credit score on applications, eviction rate, late-payment / NSF rate, and stable-employment percentage? A property-management company in the area should have these aggregated.
- How much new apartment / multifamily construction is in the pipeline within 1–3 miles? Heavy new supply (>2% of stock underway) typically softens rents 12–24 months out; light construction supports rent growth.
Investment metrics
- 1% rule
- 0.85% ✗
- Cap rate
- 6.83%
- Cash-on-cash
- 1.93%
- DSCR
- 1.09
- GRM
- 9.8
CMA / ARV
- ARV (on-the-fly)
- $926,016
- Comps found
- 1
Show comp detail 1 sale within ~0.75 mi
| Address | Dist | Beds/Ba | Sqft | Sold | Price | $/sf | Match |
|---|---|---|---|---|---|---|---|
| 3542 6th St NW | 0.26mi | 4/4.0 | 2,880 (-3%) | 5mo | $899,900 | $312 | 79 |
Match score weights: distance 35% · size 25% · config 20% · recency 20%. Top-matched comps best support the ARV.
Projected returns pro-forma
-3.0% appreciation · 0.3% rent growth · sell at horizon
- IRR
- -16.1%
- Equity multiple
- 0.44×
- Total profit
- $-187,352
- Equity at exit
- $178,924
- IRR
- -12.8%
- Equity multiple
- 0.33×
- Total profit
- $-225,120
- Equity at exit
- $103,754
Cash invested: $336,000 (down + closing). Projections, not guarantees.
Landlord ↔ Tenant lean methodology
- Overall (CITY)
- 0 Strongly Tenant-Friendly
- State District of Columbia
- 12 Strongly Tenant-Friendly · D+43
- County
- — inherits STATE
- City Washington
- 0 Strongly Tenant-Friendly · D+43
ZIP-level market 20010
- Rents YoY
- 0.3%
- Active inventory
- 178
- Price-to-rent
- 41.3×
Monthly cashflow live
- Estimated rent
- $10,213 high interval (Pro) →
- Mortgage (P&I)
- −$6,293
- Tax from tax record
- −$735 /mo · $8,817/yr
- Insurance
- −$500
- HOA
- −$0
- Vacancy / Maint / Mgmt
- −$2,145
- Net cashflow
- $541
Break-even live
Sensitivity live
| Price | -10% $1,220 | -5% $880 | +0% $541 | +5% $201 | +10% $-139 |
|---|---|---|---|---|---|
| Rent | -10% $-266 | -5% $137 | +0% $541 | +5% $944 | +10% $1,347 |
| Rate | -1.0pp $1,145 | -0.5pp $846 | base $541 | +0.5pp $230 | +1.0pp $-87 |
4-unit breakdown (identical units grouped — click to expand)
| Units | Beds | Baths | Est. rent |
|---|---|---|---|
| 3× units | 2 | 1 | $7,266 |
| #1 | 2 | 1 | $2,422 |
| #2 | 2 | 1 | $2,422 |
| #3 | 2 | 1 | $2,422 |
| 1× unit | 3 | 1 | $2,946 |
| Total (4 units) | $10,213 | ||
UW: 25.0% down · 7.5% · 30yr · 1.5% tax · 5.0% vac · 8.0% maint · 8.0% mgmt
Financing live
Cash to close
- Down payment
- $300,000
- Closing costs
- $36,000
- Reserves months
- —
- Total cash needed
- —
Loan-product check · same deal, 3 products live
Conventional
25% down · 7.5% · 30yr
- Down + closing
- —
- Monthly P&I
- —
- Monthly cashflow
- —
- DSCR
- —
- Eligible?
- —
Personal DTI + credit; lowest rate.
DSCR
20% down · 8.5% · 30yr
- Down + closing
- —
- Monthly P&I
- —
- Monthly cashflow
- —
- DSCR
- —
- Eligible?
- —
No personal income docs; deal must DSCR.
Hard money
10% down · 12.0% · 12mo
- Down + closing
- —
- Monthly P&I
- —
- Monthly cashflow
- —
- DSCR
- —
- Eligible?
- —
Short-term bridge; refi at stabilization.
Rent comps 40 comps
| Address | Beds | Baths | Sqft | Rent | $/sqft | DOM | Units | Dist |
|---|---|---|---|---|---|---|---|---|
| 739 Morton St NW Washington, DC | 5.0 | 4.0 | 3200 | $4,995 | $1.56 | 17d | 1 | 0.08mi |
| 1008 Park Rd NW Washington, DC | 5.0 | 3.5 | 3120 | $5,750 | $1.84 | 26d | 1 | 0.14mi |
| 1022 Park Rd NW Unit 1 Washington, DC | 5.0 | 3.5 | 3005 | $6,200 | $2.06 | 20d | 1 | 0.16mi |
| 1023 Columbia Rd NW Washington, DC | 5.0 | 3.5 | 3081 | $6,200 | $2.01 | 21d | 1 | 0.23mi |
| 636 Columbia Rd NW Washington, DC | 4.0 | 2.5 | 2070 | $4,900 | $2.37 | 17d | 1 | 0.26mi |
| 636 Columbia Rd NW Washington, DC | 5.0 | 2.5 | 2070 | $4,900 | $2.37 | 26d | 1 | 0.26mi |
| 520 Irving St NW Washington, DC | 5.0 | 3.5 | 2600 | $6,700 | $2.58 | 4d | 1 | 0.29mi |
| 447 Lamont St NW Washington, DC | 5.0 | 2.5 | 2000 | $5,600 | $2.80 | 7d | 1 | 0.29mi |
| 738 Gresham Pl NW Washington, DC | 5.0 | 3.0 | 2166 | $5,500 | $2.54 | 26d | 1 | 0.32mi |
| 787 Fairmont St NW Washington, DC | 4.0 | 2.5 | 2350 | $4,950 | $2.11 | 20d | 1 | 0.41mi |
| 2707 11th St NW Washington, DC | 3.0 | 1.0 | 2223 | $2,999 | $1.35 | 26d | 1 | 0.42mi |
| 2717 13th St NW Unit B Washington, DC | 4.0 | 3.5 | 2127 | $5,600 | $2.63 | 26d | 1 | 0.46mi |
| 2715 13th ST NW Unit A Washington, DC | 4.0 | 2.5 | 2780 | $6,700 | $2.41 | 16d | 1 | 0.47mi |
| 1017 Euclid St NW #1 Washington, DC | 5.0 | 2.0 | 2048 | $6,999 | $3.42 | 26d | 1 | 0.47mi |
| 3716 13th St NW #1 Washington, DC | 3.0 | 3.5 | 2500 | $4,650 | $1.86 | 0d | 1 | 0.51mi |
| 3716 13th St NW Washington, DC | 3.0 | 3.0 | 2500 | $4,650 | $1.86 | 4d | 1 | 0.51mi |
| 3716 13th St NW Washington, DC | 3.0 | 3.0 | 2180 | $5,100 | $2.34 | 6d | 1 | 0.51mi |
| 3815 New Hampshire Ave NW Washington, DC | 4.0 | 3.5 | 2300 | $5,150 | $2.24 | 6d | 1 | 0.51mi |
| 2533 11th St NW Washington, DC | 3.0 | 2.5 | 2220 | $4,000 | $1.80 | 14d | 1 | 0.53mi |
| 1113 Clifton St NW Washington, DC | 4.0 | 2.5 | 2076 | $5,700 | $2.75 | 26d | 1 | 0.59mi |
| 1432 Perry Pl NW Washington, DC | 5.0 | 3.0 | 2350 | $4,495 | $1.91 | 22d | 1 | 0.62mi |
| 4023 New Hampshire Ave NW Washington, DC | 4.0 | 3.5 | 1946 | $5,950 | $3.06 | 26d | 1 | 0.69mi |
| 33 Lower Service Ct NW Washington, DC | 4.0 | 4.5 | 2250 | $7,950 | $3.53 | 20d | 1 | 0.88mi |
| 1821 Kilbourne Pl NW Washington, DC | 4.0 | 2.0 | 2356 | $6,000 | $2.55 | 26d | 1 | 0.93mi |
| 4208 16th St NW Washington, DC | 4.0 | 2.5 | 3373 | $4,650 | $1.38 | 18d | 1 | 1.01mi |
| 2519 N Capitol St NE Washington, DC | 5.0 | 3.5 | 2750 | $5,350 | $1.95 | 17d | 1 | 1.04mi |
| 2519 N Capitol St NE Washington, DC | 5.0 | 4.0 | 2750 | $4,625 | $1.68 | 12d | 1 | 1.04mi |
| 2206 First St NW Unit A Washington, DC | 5.0 | 3.5 | 3374 | $5,650 | $1.67 | 26d | 1 | 1.04mi |
| 909 T St NW Washington, DC | 4.0 | 2.5 | 2500 | $6,100 | $2.44 | 9d | 1 | 1.05mi |
| 1920 6th St NW Washington, DC | 3.0 | 2.5 | 1928 | $5,500 | $2.85 | 21d | 1 | 1.05mi |
| 1349 Wallach Pl NW Washington, DC | 4.0 | 4.5 | 3200 | $10,000 | $3.12 | 26d | 1 | 1.06mi |
| 1944 3rd St NW Washington, DC | 3.0 | 2.5 | 2124 | $4,195 | $1.98 | 26d | 1 | 1.06mi |
| 2404 N Capitol St NW Unit A Washington, DC | 3.0 | 3.0 | 3554 | $5,300 | $1.49 | 17d | 1 | 1.06mi |
| 2404 N Capitol St NW Unit B Washington, DC | 3.0 | 3.0 | 3554 | $5,600 | $1.58 | 17d | 1 | 1.06mi |
| 4605 Georgia Ave NW Washington, DC | 4.0 | 3.0 | 2000 | $4,500 | $2.25 | 9d | 1 | 1.06mi |
| 613 Florida Ave NW #2 Washington, DC | 3.0 | 2.0 | 2400 | $4,600 | $1.92 | 6d | 1 | 1.07mi |
| 32 Adams St NW Washington, DC | 5.0 | 4.5 | 3088 | $8,000 | $2.59 | 26d | 1 | 1.10mi |
| 1852 5th St NW Washington, DC | 5.0 | 4.0 | 2684 | $5,895 | $2.20 | 26d | 1 | 1.13mi |
| 2017 Klingle Rd NW Washington, DC | 4.0 | 3.5 | 3047 | $7,950 | $2.61 | 19d | 1 | 1.15mi |
| 58 V St NW Unit A Washington, DC | 3.0 | 2.5 | 2150 | $5,200 | $2.42 | 21d | 1 | 1.18mi |
Listing history 26 events
-
2026-06-21days on market $1,199,999 Active 41 DOM
-
2026-06-18days on market $1,199,999 Active 38 DOM
-
2026-06-17days on market $1,199,999 Active 37 DOM
-
2026-06-16days on market $1,199,999 Active 36 DOM
-
2026-06-15days on market $1,199,999 Active 35 DOM
-
2026-06-13days on market $1,199,999 Active 33 DOM
-
2026-06-09days on market $1,199,999 Active 29 DOM
-
2026-06-08days on market $1,199,999 Active 28 DOM
-
2026-06-07days on market $1,199,999 Active 27 DOM
-
2026-06-04days on market $1,199,999 Active 24 DOM
-
2026-06-03days on market $1,199,999 Active 23 DOM
-
2026-06-02days on market $1,199,999 Active 22 DOM
-
2026-06-01days on market $1,199,999 Active 21 DOM
-
2026-05-31days on market $1,199,999 Active 20 DOM
-
2026-05-12price $1,199,999
-
2026-05-11$1,550,000 Active
-
2026-03-13historical
-
2025-11-17price $1,550,000
-
2025-10-03$1,650,000 Active
-
2021-08-06soldstatus $1,265,000
-
2021-07-06soldstatus $1,265,000 Closed 503-char remark
Show marketing remark (503 chars)
Investor Alert!!! 4-unit building for sale. Current layout includes 1-two bedroom and 3-one bedroom units with separated utilities (except water). This property can be used as a buy and hold with major upgrades to the units or converted to luxury condos in booming Petworth neighborhood. Building has RF-1 zoning restrictions, but has plenty of potential including adding parking in the large rear lot. Agents, please follow CDC guidelines when showing property and leave all lights off after showing.
-
2021-06-01status Pending 503-char remark
Show marketing remark (503 chars)
Investor Alert!!! 4-unit building for sale. Current layout includes 1-two bedroom and 3-one bedroom units with separated utilities (except water). This property can be used as a buy and hold with major upgrades to the units or converted to luxury condos in booming Petworth neighborhood. Building has RF-1 zoning restrictions, but has plenty of potential including adding parking in the large rear lot. Agents, please follow CDC guidelines when showing property and leave all lights off after showing.
-
2021-05-17status Active Under Contract 503-char remark
Show marketing remark (503 chars)
Investor Alert!!! 4-unit building for sale. Current layout includes 1-two bedroom and 3-one bedroom units with separated utilities (except water). This property can be used as a buy and hold with major upgrades to the units or converted to luxury condos in booming Petworth neighborhood. Building has RF-1 zoning restrictions, but has plenty of potential including adding parking in the large rear lot. Agents, please follow CDC guidelines when showing property and leave all lights off after showing.
-
2021-05-14historical 503-char remark
Show marketing remark (503 chars)
Investor Alert!!! 4-unit building for sale. Current layout includes 1-two bedroom and 3-one bedroom units with separated utilities (except water). This property can be used as a buy and hold with major upgrades to the units or converted to luxury condos in booming Petworth neighborhood. Building has RF-1 zoning restrictions, but has plenty of potential including adding parking in the large rear lot. Agents, please follow CDC guidelines when showing property and leave all lights off after showing.
-
2021-05-02$1,300,000 Active 503-char remark
Show marketing remark (503 chars)
Investor Alert!!! 4-unit building for sale. Current layout includes 1-two bedroom and 3-one bedroom units with separated utilities (except water). This property can be used as a buy and hold with major upgrades to the units or converted to luxury condos in booming Petworth neighborhood. Building has RF-1 zoning restrictions, but has plenty of potential including adding parking in the large rear lot. Agents, please follow CDC guidelines when showing property and leave all lights off after showing.
-
1985-01-22soldstatus $88,600
ⓘ Source: listings_history table (triggers on properties + properties_extension) + one-shot
backfill from property_details.listing_events for pre-trigger history.
Tax reassessment forecast DC · Partial reset (capped growth)
- Current annual tax
- $8,817 · $735/mo
- Projected year-2 tax
- $8,817 · $735/mo
- Expected delta
- $0/yr ($0/mo · 0.0%)
ⓘ Screening estimate from a state-policy table — verify with the county assessor before closing.
Climate risk First Street
- Flood 1/10 Low FEMA zone X (unshaded) · 0% chance over 30 yrs
- Wildfire 1/10 Low
- Heat 7/10 Severe 7 d/yr ≥105°F today · 15 d/yr by 30 yrs out
- Wind 4/10 Moderate 16% chance of damaging wind over 30 yrs
- Air quality 4/10 Moderate 4 unhealthy d/yr today · 5 by 30 yrs out
Nearby sold comps map
Loading sold comps map…
Walkable amenities ~0.75 mi
Loading nearby amenities…
Taxation est. · year 1
- Rental income
- $122,556
- − Mortgage interest
- −$67,219
- − Property taxes
- −$8,817
- − Insurance
- −$6,000
- − Repairs & maintenance
- −$9,804
- − Management
- −$9,804
- − Depreciation
- −$34,909
- Taxable loss
- −$13,997
- Est. tax savings @ 24.0%
- +$3,359
- After-tax cash flow
- $9,847/yr
For passive investors: Depreciation is non-cash, so a rental often shows a tax loss while cash-flowing — sheltering income. Rental losses are passive: they offset passive income freely, and up to $25,000/yr can offset ordinary (W-2) income if you actively participate and your MAGI is under $100k (phasing out to $0 by $150k); unused losses carry forward. On sale, claimed depreciation is recaptured at up to 25%, and gains may owe capital-gains tax (a 1031 exchange can defer both). Figures are a year-1 estimate at your 24.0% rate — not tax advice; consult a CPA.
Schools (NCES district)
- District
- District Of Columbia Public Schools
- NCES district ID
- 1100030
- Math proficiency
- 33% ▲ 3.00%
- Reading proficiency
- 40% ▲ 5.00%
- Median HH income
- $67,671
- Composite
- 35.84/100
- National rank
- #9606
- State rank
- #8 of 32 in DC
Livability — Washington
- Score
- 73/100
- State rank
- #1
- US rank
- #5327
Category grades
Schools grade is shown separately in the Schools card above.
Census & demographics
- Census place
- Washington, DC
- County
- District of Columbia · 671,873 people
- City population
- 671,873
- Metro
- Washington-Arlington-Alexandria, DC-VA-MD-WV
- Population (ZIP)
- 31,808
- Household income
- $114,126
- Rent vs Own
- Severe rent burden
- 1344.0
Population outlook (District of Columbia County) Hauer SSP2
- Today (2025)
- 821,926 people
- By 2030
- 899,517 · +9.4%
- By 2040
- 1,061,162 · +29.1%
- By 2050
- 1,231,493 · +49.8%
- By 2075
- 1,603,312 · +95.1%
- By 2100
- 1,847,141 · +124.7%
Race, ethnicity, and origin ACS 2023
- Neighborhood character
- Highly diverse neighborhood (Simpson 0.72)
- Race & ethnicity
- White 38% Hispanic / Latino 29% Black 21% Two or more races 13% Asian 6%
- Hispanic origin (detail)
- Mexican 8%
- Common ancestry
- Romanian 3% Slovak 2% Lithuanian 2%
- Foreign-born
- 25% · Canada, Vietnam, Jamaica
- Languages at home
- 64% English-only · Spanish 26% French/Haitian/Cajun 2% Other Indo-European 2%
Political lean MEDSL · District of Columbia
- 2024 margin
- Solid D (+86.1) · D 91.2% · R 5.1% · Other 3.8%
- 2008→2024 swing
- +0.1pp no change · 2008: 85.9pp · 2024: 86.1pp
- All cycles
- 2024: D+86.1 2020: D+86.8 2016: D+88.7 2012: D+84.2 2008: D+85.9
Not yet ingested
- Civics
- —
Market trends
- HPI YoY
- ▼ -1053.82%
- Current HPI
- 380.8513
- Rent YoY
- ▲ 0.30%
- Metro
- Washington-Arlington-Alexandria, DC-VA-MD-WV
- State GDP YoY
- ▲ 1.33%
- F500 in state
- 6
Industry mix (Fortune 500 HQ in DC)
| Industry | F500 HQs | Revenue |
|---|---|---|
| Financial Services | 1 | $153B |
|
||
| Life Sciences / Industrials | 1 | $25B |
|
||
| Industrial Machinery | 1 | $8B |
|
||
Price history
+1254.4% since first listed12 events — show timeline
- 2026-05-12 Price Changed $1,199,999 BRIGHT MLS
- 2026-05-11 Listed $1,550,000 BRIGHT MLS
- 2026-03-13 Listing Removed — BRIGHT MLS
- 2025-11-17 Price Changed $1,550,000 BRIGHT MLS
- 2025-10-03 Listed $1,650,000 BRIGHT MLS
- 2021-08-06 Sold (Public Records) $1,265,000 Public Records
- 2021-07-06 Sold (MLS) $1,265,000 BRIGHT MLS
- 2021-06-01 Pending — BRIGHT MLS
- 2021-05-17 Relisted — BRIGHT MLS
- 2021-05-14 Listing Removed — BRIGHT MLS
- 2021-05-02 Listed $1,300,000 BRIGHT MLS
- 1985-01-22 Sold (Public Records) $88,600 Public Records
Property tax history
+3.8%/yrLatest (2025): $8,817 · +1.1% YoY. Source: county tax records.
Cash-flow waterfall
monthlySold comps — $/sqft
last 12 mo · ≤1 miLoading sold comps…