1434 Okeefe Ln · Augusta-Richmond County consolidated government (balance), GA
Flood risk 4/10 · Minor
- FEMA flood zone
- X (unshaded)
- Chance of flooding over 30 yrs
- 0.22%
- Est. flood insurance / yr
- $507 – $1,088
Fire risk 3/10 · Minor
- Est. fire insurance / yr
- $963 – $1,789
Heat risk 8/10 · Major
- Hot days now (above 108°F)
- 7 days/yr
- Hot days in 30 yrs
- 17 days/yr
Wind risk 6/10 · Moderate
- Chance of severe wind over 30 yrs
- 65.0%
Air-quality risk 4/10 · Minor
- Unhealthy air days now
- 4 days/yr
- Unhealthy air days in 30 yrs
- 4 days/yr
Risk factors via First Street. Map © Google.
Why this score? — see what drove the B+ grade
The composite is a weighted blend of 9 inputs, each scored 0–100. Each bar is that input's sub-score; the figure is the points it added to the 100-point composite (weight × sub-score).
- Cash flow +30.0/30.0
- 1% rule +10.0/10.0
- DSCR +10.0/10.0
- Appreciation +9.1/10.0
- ARV discount +7.5/15.0
- Livability +2.5/5.0
- Condition / age +2.5/5.0
- Rent growth +2.2/5.0
- Schools +1.3/10.0
$55,000
🖨 Deal sheet (PDF) 📄 Offer letter ✓ Due diligence
Listing remarks
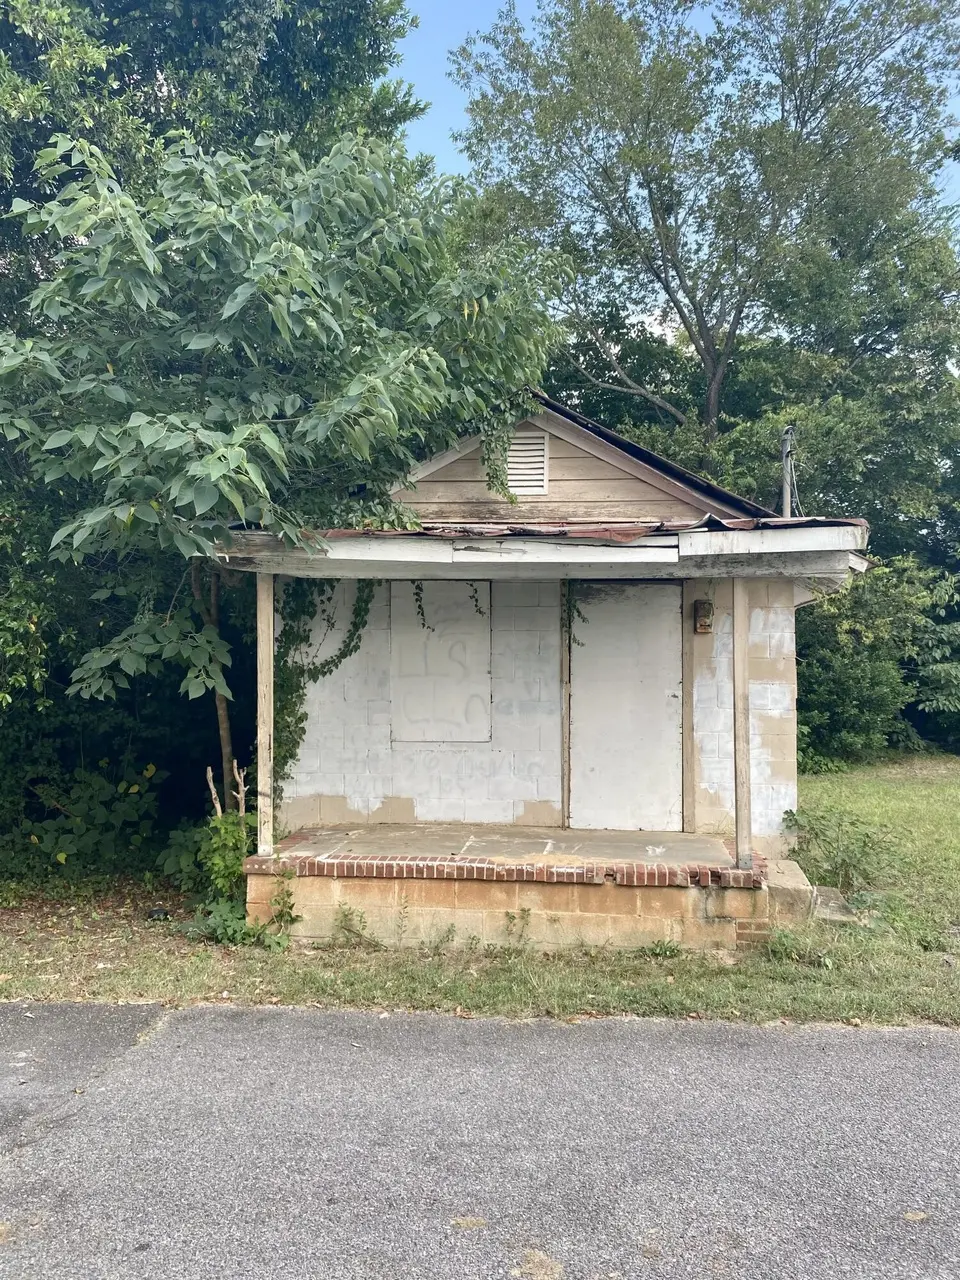
Unique development opportunity at 1434 O'Keefe Lane, Augusta, GA, located within a designated revitalization zone. This versatile property offers the potential to establish up to five individual addresses on a single lot, providing flexibility for residential development, multi-unit use, or investment purposes (subject to zoning and city approval). Positioned in an area experiencing renewed growth and improvement, the property offers convenient access to major roads, shopping, schools, and employment centers. An excellent opportunity for builders, developers, or investors seeking to capitalize on Augusta's ongoing revitalization efforts.
Key facts
- Convenient access
- Multi-unit use
- Investment purposes
Tags
Neighborhood map
What this means for you Summary
Snapshot
- This is a 1-bed/1.0-bath single-family listed at $55k.
Deal economics
- At list price, monthly cash flow is $481 ($6k/yr) — positive.
- The deal already cash-flows at list — no discount required.
- Meets the 1% rule at list price ($1k rent vs $55k).
- Recommended offer: $54k (1.5% below list) — sets the bar for market timing.
- Cap rate 16.8% vs local median 5.3% in Augusta-Richmond County consolidated government (balance) — top-decile yield for the area; either an underpriced asset or a hidden risk that comps aren't pricing in. Stress-test before assuming the spread holds.
Location & tenants
- Location reads: area grade B — affects rentability + tenant quality, not the cash-flow math above.
- Richmond County (urban): math 12% / reading 20% proficiency, ranked #154 of 174 in GA (top 88%) — low school quality limits family demand, transient renter base, plan for 1-2y turnover; 72% free/reduced lunch — lower-income household profile, screen leases tightly.
- Market conditions: Rents soft (-1.3%/yr); 130 active listings in the ZIP; 23 comparable units currently listed for rent nearby; rentals lingering (median 45d on market — plan ~5-8 weeks vacancy on turnover, expect pricing pressure); 65% of comp listings sitting > 30 days — soft ceiling on asking rent; lower-income renter base — watch delinquency; 561 units permitted in Richmond County in 2024 (0 in 5+ unit buildings).
Forward outlook
- In year one you build about $5k of equity ($380 loan paydown + $4k appreciation (8.2% local appreciation)).
- Richmond County population projected to shrink 5% by 2050 — rents likely to lag national; underwrite the cash flow, not the appreciation.
- At projected returns (8.2% appreciation + 0.0% rent growth), your $15k cash investment doubles in ~2 years — after that, you're playing with house money.
- By year 7, paydown + projected appreciation supports a ~$34k cash-out refi (75% LTV) — recoverable capital for the next deal without selling this one.
Negotiation context
- It's been on market 15 days — a 2% lower offer ($54k) is reasonable based on typical stale-listing flexibility.
- 15 sale attempts since 5y ago with the ask held roughly flat each time — persistent listings suggest the price (not the market) is what's stuck; bring a comps-based counter.
- Current owner paid $34k; list at $55k implies a 62% gain — meaningful room to come down on a strong offer.
Risks & watch-outs
- Watch-outs: built in 1891 — expect roof / HVAC / electrical / plumbing capex.
- Climate carrying-cost: major wind risk, 65% chance of damaging wind over 30y; extreme-heat days projected 7→17/yr by 2055 (HVAC capex compounding) — expect insurance premiums to compound above CPI over the hold.
Questions for the listing agent
- Built in 1891 — when were the roof, HVAC, electrical panel, plumbing, and water heater last replaced?
- Is there a deadline driving the sale (1031 exchange, divorce, estate, relocation)? That informs how much negotiation room exists.
- What's the average days-on-market for RENTAL listings here right now (not sales)? A rising rental-DOM trend means longer vacancies and softer asking-rent achievability than the comps imply.
- What's the recent tenant-quality profile in this submarket — average credit score on applications, eviction rate, late-payment / NSF rate, and stable-employment percentage? A property-management company in the area should have these aggregated.
- How much new for-sale + rental construction is in the pipeline within 1–3 miles? Heavy new supply typically softens prices + rents 12–24 months out; constrained supply supports both.
Investment metrics
- 1% rule
- 1.88% ✓
- Cap rate
- 16.79%
- Cash-on-cash
- 37.50%
- DSCR
- 2.67
- GRM
- 4.4
CMA / ARV
- ARV (median comp)
- $34,318
- List price
- $55,000
- Delta
- 60.27%
- Verdict
- OVERPRICED
- Comps
- 20 within 1.0 mi
Show comp detail 1 sale within ~0.75 mi
| Address | Dist | Beds/Ba | Sqft | Sold | Price | $/sf | Match |
|---|---|---|---|---|---|---|---|
| 1524 Chestnut St | 0.22mi | 1/1.0 | 618 (+10%) | 20mo | $14,000 | $23 | 56 |
Match score weights: distance 35% · size 25% · config 20% · recency 20%. Top-matched comps best support the ARV.
Projected returns pro-forma
8.18% appreciation · 0.0% rent growth · sell at horizon
- IRR
- 48.6%
- Equity multiple
- 4.31×
- Total profit
- $50,904
- Equity at exit
- $42,461
- IRR
- 42.4%
- Equity multiple
- 8.75×
- Total profit
- $119,377
- Equity at exit
- $84,939
Cash invested: $15,400 (down + closing). Projections, not guarantees.
Landlord ↔ Tenant lean methodology
- Overall (STATE)
- 90 Strongly Landlord-Friendly
- State Georgia
- 90 Strongly Landlord-Friendly · R+3
- County
- — inherits STATE
- City
- — inherits STATE
ZIP-level market 30901
- Home prices YoY
- 4.1%
- Rents YoY
- -1.3%
- Active inventory
- 130
- Price-to-rent
- 4.4×
Monthly cashflow live
- Estimated rent
- $1,033 high interval (Pro) →
- Mortgage (P&I)
- −$288
- Tax from tax record
- −$23 /mo · $278/yr
- Insurance
- −$23
- HOA
- −$0
- Vacancy / Maint / Mgmt
- −$217
- Net cashflow
- $481
Break-even live
Sensitivity live
| Price | -10% $512 | -5% $497 | +0% $481 | +5% $466 | +10% $450 |
|---|---|---|---|---|---|
| Rent | -10% $400 | -5% $440 | +0% $481 | +5% $522 | +10% $563 |
| Rate | -1.0pp $509 | -0.5pp $495 | base $481 | +0.5pp $467 | +1.0pp $452 |
UW: 25.0% down · 7.5% · 30yr · 1.5% tax · 5.0% vac · 8.0% maint · 8.0% mgmt
Financing live
Cash to close
- Down payment
- $13,750
- Closing costs
- $1,650
- Reserves months
- —
- Total cash needed
- —
Loan-product check · same deal, 3 products live
Conventional
25% down · 7.5% · 30yr
- Down + closing
- —
- Monthly P&I
- —
- Monthly cashflow
- —
- DSCR
- —
- Eligible?
- —
Personal DTI + credit; lowest rate.
DSCR
20% down · 8.5% · 30yr
- Down + closing
- —
- Monthly P&I
- —
- Monthly cashflow
- —
- DSCR
- —
- Eligible?
- —
No personal income docs; deal must DSCR.
Hard money
10% down · 12.0% · 12mo
- Down + closing
- —
- Monthly P&I
- —
- Monthly cashflow
- —
- DSCR
- —
- Eligible?
- —
Short-term bridge; refi at stabilization.
Rent comps 23 comps
| Address | Beds | Baths | Sqft | Rent | $/sqft | DOM | Units | Dist |
|---|---|---|---|---|---|---|---|---|
| 1425 Lee Beard Way Augusta, GA | 1.0–2.0 | 1.0 | 776 | $923 | $1.19 | 45d | 1 | 0.30mi |
| 1601 12th St Unit 1601 Augusta, GA | 2.0 | 1.0 | 550 | $875 | $1.59 | 45d | 1 | 0.36mi |
| 1601 12th St Unit 1603 Augusta, GA | 1.0 | 1.0 | 550 | $875 | $1.59 | 22d | 1 | 0.36mi |
| 1480 Wrightsboro Rd Augusta, GA | 1.0–3.0 | 1.0–2.0 | 1046 | $1,350 | $1.29 | 22d | 13 | 0.43mi |
| 1016 Laney Walker Blvd Augusta, GA | 1.0–2.0 | 1.0 | 794 | $740 | $0.93 | 24d | 4 | 0.55mi |
| 1399 Walton Way Augusta, GA | 1.0 | 1.0 | 582 | $1,401 | $2.41 | 45d | 1 | 0.84mi |
| 709 Hall St Augusta, GA | 2.0 | 1.0 | 600 | $990 | $1.65 | 45d | 1 | 0.93mi |
| 1240 Holden Dr Augusta, GA | 2.0 | 1.0 | 675 | $1,095 | $1.62 | 45d | 1 | 0.96mi |
| 1220 Holden Dr Augusta, GA | 2.0 | 1.0 | 675 | $1,095 | $1.62 | 45d | 1 | 1.01mi |
| 1202 Holden Dr Augusta, GA | 2.0 | 1.0 | 675 | $1,150 | $1.70 | 45d | 1 | 1.09mi |
| 1450 Greene St Augusta, GA | 1.0 | 1.0 | 720 | $1,480 | $2.06 | 45d | 1 | 1.10mi |
| 1750 Essie McIntyre Blvd Augusta, GA | 2.0 | 1.0 | 720 | $950 | $1.32 | 45d | 1 | 1.13mi |
| 513 James Brown Blvd Augusta, GA | 1.0 | 1.0 | 718 | $1,375 | $1.91 | 15d | 2 | 1.20mi |
| 1926 Howard Ave Unit B Augusta, GA | 1.0 | 1.0 | 400 | $800 | $2.00 | 45d | 1 | 1.21mi |
| 1204 Broad St Unit 1 Augusta, GA | 1.0 | 1.0 | 750 | $1,100 | $1.47 | 24d | 1 | 1.30mi |
| 1204 Broad St Unit 1 Augusta, GA | 1.0 | 1.0 | 750 | $1,125 | $1.50 | 45d | 1 | 1.30mi |
| 1022 Broad St Apt A Augusta, GA | 1.0 | 1.0 | 665 | $1,075 | $1.62 | 45d | 1 | 1.35mi |
| 936 Broad St #415 Augusta, GA | 1.0 | 1.0 | 701 | $1,750 | $2.50 | 45d | 1 | 1.38mi |
| 1730 Hicks St Apt A Augusta, GA | 2.0 | 1.0 | 750 | $750 | $1.00 | 15d | 1 | 1.40mi |
| 1838 Watkins St Augusta, GA | 2.0 | 1.0 | 672 | $1,050 | $1.56 | 24d | 1 | 1.41mi |
| 537 Watkins St Unit B Augusta, GA | 1.0 | 1.0 | 725 | $705 | $0.97 | 45d | 1 | 1.42mi |
| 828 Broad St Unit B Augusta, GA | 2.0 | 1.0 | 750 | $995 | $1.33 | 45d | 1 | 1.45mi |
| 828 Broad St Augusta, GA | 2.0 | 1.0 | 750 | $995 | $1.33 | 24d | 1 | 1.45mi |
Listing history 29 events
-
2026-05-11historical
-
2026-05-11historical
-
2026-05-11historical
-
2026-05-11historical
-
2026-03-26status Active
-
2026-03-26historical
-
2026-02-21status Active
-
2026-02-20historical
-
2026-02-08status Active
-
2026-01-25$55,000 Active
-
2026-01-25historical
-
2026-01-25$55,000 Active
-
2024-12-31historical
-
2023-08-23$79,900
-
2023-08-23$79,900
-
2023-03-15soldstatus $34,000
-
2023-03-15soldstatus $34,000
-
2022-12-19$55,000
-
2022-12-19$55,000
-
2022-01-18historical
-
2021-10-25$55,000
-
2021-10-25$55,000
-
2021-06-18soldstatus $15,000
-
2021-06-18soldstatus $15,000
-
2021-04-28$10,000
-
2021-04-28$10,000
-
2021-04-28$10,000
-
2021-04-28historical
-
2021-04-28$10,000
ⓘ Source: listings_history table (triggers on properties + properties_extension) + one-shot
backfill from property_details.listing_events for pre-trigger history.
Tax reassessment forecast GA · Resets to sale price
- Current annual tax
- $278 · $23/mo
- Projected year-2 tax
- $506 · $42/mo
- Expected delta
- +$228/yr (+$19/mo · 82.1%)
ⓘ Screening estimate from a state-policy table — verify with the county assessor before closing.
Climate risk First Street
- Flood 4/10 Moderate FEMA zone X (unshaded) · 22% chance over 30 yrs
- Wildfire 3/10 Moderate
- Heat 8/10 Severe 7 d/yr ≥108°F today · 17 d/yr by 30 yrs out
- Wind 6/10 Major 65% chance of damaging wind over 30 yrs
- Air quality 4/10 Moderate 4 unhealthy d/yr today · 4 by 30 yrs out
Nearby sold comps map
Loading sold comps map…
Walkable amenities ~0.75 mi
Loading nearby amenities…
Taxation est. · year 1
- Rental income
- $12,391
- − Mortgage interest
- −$3,081
- − Property taxes
- −$278
- − Insurance
- −$275
- − Repairs & maintenance
- −$991
- − Management
- −$991
- − Depreciation
- −$1,600
- Taxable income
- $5,175
- Est. tax owed @ 24.0%
- −$1,242
- After-tax cash flow
- $4,533/yr
For passive investors: Depreciation is non-cash, so a rental often shows a tax loss while cash-flowing — sheltering income. Rental losses are passive: they offset passive income freely, and up to $25,000/yr can offset ordinary (W-2) income if you actively participate and your MAGI is under $100k (phasing out to $0 by $150k); unused losses carry forward. On sale, claimed depreciation is recaptured at up to 25%, and gains may owe capital-gains tax (a 1031 exchange can defer both). Figures are a year-1 estimate at your 24.0% rate — not tax advice; consult a CPA.
Schools (NCES district)
- District
- Richmond County
- NCES district ID
- 1304380
- Math proficiency
- 12% ▼ -9.00%
- Reading proficiency
- 20% ▼ -6.00%
- Median HH income
- $38,069
- Composite
- 13.43/100
- National rank
- #9524
- State rank
- #154 of 174 in GA
Livability — Augusta-Richmond County consolidated government (balance)
No livability data for this city. (Only ~50 U.S. cities are tracked.)
Census & demographics
- Census place
- Augusta-Richmond County consolidated government (balance), GA
- County
- Richmond County · 190,917 people
- City population
- 154,035
- Metro
- Augusta-Richmond County, GA-SC
- Population (ZIP)
- 16,484
- Household income
- $25,163
- Rent vs Own
- Severe rent burden
- 2063.0
Population outlook (Richmond County) Hauer SSP2
- Today (2025)
- 200,753 people
- By 2030
- 200,232 · -0.3%
- By 2040
- 196,813 · -2.0%
- By 2050
- 190,347 · -5.2%
- By 2075
- 172,496 · -14.1%
- By 2100
- 146,284 · -27.1%
Race, ethnicity, and origin ACS 2023
- Neighborhood character
- Predominantly Black (78%)
- Race & ethnicity
- Black 78% White 15% Two or more races 4% Hispanic / Latino 2%
- Common ancestry
- Lithuanian 1% Slovak 1%
- Foreign-born
- 1% · Canada
- Languages at home
- 97% English-only · Spanish 1%
Political lean MEDSL · Richmond
- 2024 margin
- Solid D (+36.1) · D 67.8% · R 31.7%
- 2008→2024 swing
- +4.3pp toward D · 2008: 31.8pp · 2024: 36.1pp
- All cycles
- 2024: D+36.1 2020: D+37.2 2016: D+32.4 2012: D+33.8 2008: D+31.8
Not yet ingested
- Civics
- —
Market trends
- HPI YoY
- ▲ 8.18%
- Current HPI
- 206.3145
- Rent YoY
- ▼ -1.31%
- Metro
- Augusta-Richmond County, GA-SC
- State GDP YoY
- ▲ 2.66%
- F500 in state
- 28
Industry mix (Fortune 500 HQ in GA)
| Industry | F500 HQs | Revenue |
|---|---|---|
| Paper / Packaging | 2 | $29B |
|
||
| Retail | 1 | $160B |
|
||
| Transportation / Logistics | 1 | $91B |
|
||
| Airlines | 1 | $62B |
|
||
| Consumer Goods | 1 | $47B |
|
||
| Utilities | 1 | $25B |
|
||
Price history
+450.0% since first listed30 events — show timeline
- 2026-05-15 Listing Removed — Hive MLS
- 2026-05-11 Listing Removed — Hive MLS
- 2026-05-11 Listing Removed — Hive MLS
- 2026-05-11 Listing Removed — Hive MLS
- 2026-05-11 Listing Removed — Hive MLS
- 2026-03-26 Relisted — Hive MLS
- 2026-03-26 Listing Removed — Hive MLS
- 2026-02-21 Relisted — Hive MLS
- 2026-02-20 Listing Removed — Hive MLS
- 2026-02-08 Relisted — Hive MLS
- 2026-01-25 Listed $55,000 Hive MLS
- 2026-01-25 Listing Removed — Hive MLS
- 2026-01-25 Listed $55,000 Hive MLS
- 2024-12-31 Listing Removed — Hive MLS
- 2023-08-23 Listed $79,900 Hive MLS
- 2023-08-23 Listed $79,900 Hive MLS
- 2023-03-15 Sold (MLS) $34,000 Hive MLS
- 2023-03-15 Sold (MLS) $34,000 Hive MLS
- 2022-12-19 Listed $55,000 Hive MLS
- 2022-12-19 Listed $55,000 Hive MLS
- 2022-01-18 Listing Removed — Hive MLS
- 2021-10-25 Listed $55,000 Hive MLS
- 2021-10-25 Listed $55,000 Hive MLS
- 2021-06-18 Sold (MLS) $15,000 Hive MLS
- 2021-06-18 Sold (MLS) $15,000 Hive MLS
- 2021-04-28 Listed $10,000 Hive MLS
- 2021-04-28 Listing Removed — Hive MLS
- 2021-04-28 Listed $10,000 Hive MLS
- 2021-04-28 Listed $10,000 Hive MLS
- 2021-04-28 Listed $10,000 Hive MLS
Property tax history
-2.2%/yrLatest (2025): $278 · +30.0% YoY. Source: county tax records.
Cash-flow waterfall
monthlySold comps — $/sqft
last 12 mo · ≤1 miLoading sold comps…