14649 Peridot Ter NW · Ramsey, MN
Flood risk 1/10 · Minimal
- FEMA flood zone
- X (unshaded)
- Chance of flooding over 30 yrs
- 0.0%
- Est. flood insurance / yr
- $507 – $1,088
Fire risk 2/10 · Minimal
- Est. fire insurance / yr
- $888 – $1,650
Heat risk 3/10 · Minor
- Hot days now (above 98°F)
- 7 days/yr
- Hot days in 30 yrs
- 14 days/yr
Wind risk 2/10 · Minimal
- Chance of severe wind over 30 yrs
- —
Air-quality risk 2/10 · Minimal
- Unhealthy air days now
- 1 days/yr
- Unhealthy air days in 30 yrs
- 2 days/yr
Risk factors via First Street. Map © Google.
Why this score? — see what drove the F grade
The composite is a weighted blend of 9 inputs, each scored 0–100. Each bar is that input's sub-score; the figure is the points it added to the 100-point composite (weight × sub-score).
- ARV discount +7.5/15.0
- Cash flow +6.3/30.0
- Schools +4.7/10.0
- Rent growth +3.6/5.0
- Livability +3.5/5.0
- 1% rule +2.9/10.0
- Condition / age +2.5/5.0
- DSCR +0.6/10.0
- Appreciation +0.0/10.0
$249,900
🖨 Deal sheet 📄 Offer letter ✓ Due diligence
Listing remarks
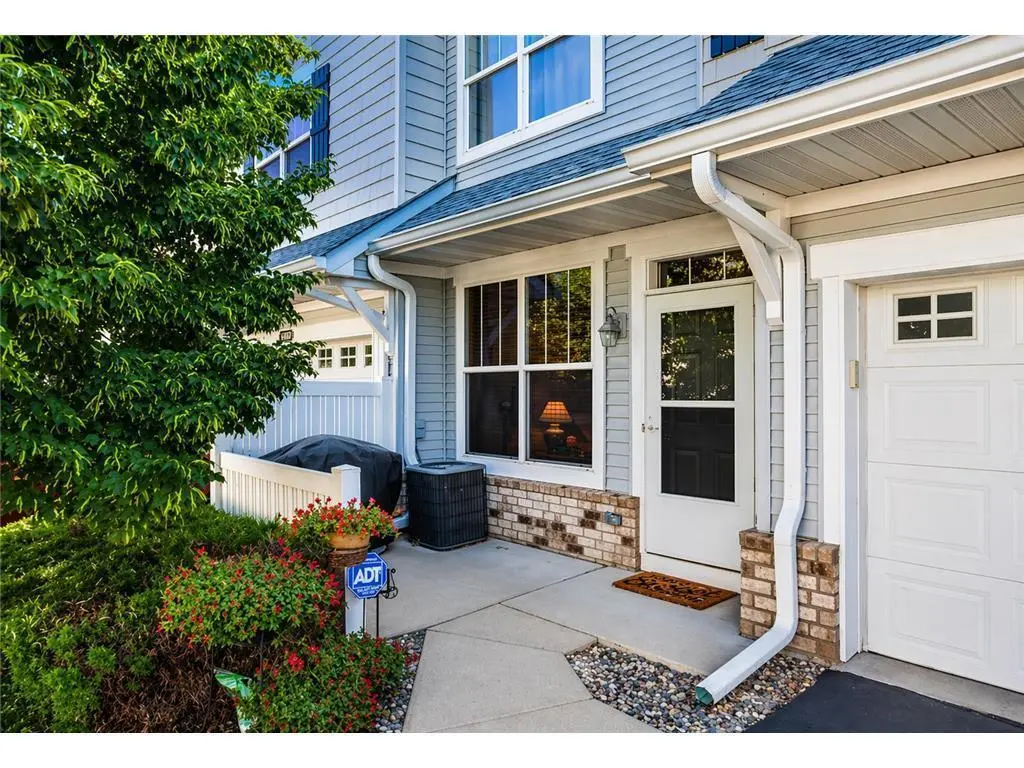
Welcome to 14649 Peridot Terrace in the highly desirable Symphony at Town Center community in Ramsey. This clean, move-in ready 2-bedroom, 2-bathroom home offers low-maintenance living in one of Ramsey’s most convenient and walkable locations. Situated less than a mile from the Northstar Commuter Rail station, this home is ideal for commuters while still offering a neighborhood feel. Enjoy being just steps from The Draw Park, scenic walking trails, the amphitheater, and Ramsey City Hall. Inside, you’ll find a well-kept layout with two spacious bedrooms, two bathrooms, and abundant storage, rare at this price point. The pet-friendly association adds flexibility for homeowners. Pe
Key facts
- Walkable locations
- $372 HOA
- 2 garage spots
Tags
Property features AI
Finance
- HOA & community: Symphony at Town Center Condominium Association; Monthly HOA fee of $372 (includes hazard insurance, lawn care, grounds maintenance, sewer, snow removal, water)
Exterior
- Parking: Attached 2-car garage (20x18)
- Utilities: City water; City sewer; Natural gas; 100 amp electric service with circuit breakers
- Home design: Residential attached property; Two levels; Entry level: Main; Above-grade finished area 1,560 square feet
- Construction: Slab foundation; Asphalt roof (age 8 years or less)
- Exterior features: Patio; Stone and vinyl exterior; Light tree coverage
Interior
- Kitchen: Range; Dishwasher; Refrigerator
- Bedrooms: 2 bedrooms (primary upstairs)
- Bathrooms: 1 full bath (upper level); 1 half bath (main floor)
- Heating & cooling: Forced air heating; Central air conditioning
- Interior features: Ceiling fan(s); Vaulted ceiling(s); Sun room; Walk-in closet(s)
- Laundry & utility: Washer and dryer included; Laundry sink; Second-floor laundry; Washer/dryer hookup
Neighborhood map
What this means for you Summary
Snapshot
- This is a 2-bed/2.0-bath condo listed at $250k.
Deal economics
- At list price, monthly cash flow is $-441 ($-5k/yr) — negative.
- To cash-flow at today's rent, offer at most $172k (31.2% below list).
- To meet the 1% rule (rent ≥ 1% of price), the offer needs to be $198k (20.8% below list).
- Recommended offer: $172k (31.2% below list) — sets the bar for cash-flow.
- Cap rate 4.2% vs local median 3.3% in Ramsey — meaningfully above typical; check what's discounted (condition, days-on-market, listing class) to confirm the premium yield is real.
Location & tenants
- Location reads 69/100 on livability (#354 in MN) — a middle-class / working-renter tenant base. Strengths: crime A+, employment A+, housing A+; Watch: cost of living C-, amenities F, commute F.
- Anoka-Hennepin Public School District (suburban): math 49% / reading 55% proficiency, ranked #71 of 301 in MN (top 24%) — acceptable for families but not a draw, mixed tenant base, ~2y average lease.
- Market conditions: Rents rising fast (+4.3%/yr); 341 active listings in the ZIP; 5 comparable units currently listed for rent nearby; rentals leasing fast (median 2d on market — plan ~1-2 weeks tenant-placement turnaround); solid renter incomes; 1,083 units permitted in Anoka County in 2024 (134 in 5+ unit buildings).
Forward outlook
- Local home prices are declining (-3.0%/yr); year-one equity from $2k of loan paydown is wiped out by about $7k of value loss. Plan a longer hold.
- Anoka County population projected at +11% by 2050 — modest demand growth; plan on rents tracking national, not racing it.
Negotiation context
- Only 11 days on market — expect competitive offers; lowballing is unlikely to land.
- 5 sale attempts since 7y ago; this cycle's ask is 10100% above the opening price — seller raised mid-cycle; expect resistance to lowballs.
Questions for the listing agent
- What do current leases actually rent for vs. the listed asking? Can we see a recent rent roll and the last 12 months of T-12 income?
- What does the HOA fee cover, when was the last increase, and are there any pending special assessments or reserve-fund shortfalls?
- Any open or pending special assessments — roof, HVAC, plumbing, elevator, façade? What's the per-unit balance and payoff schedule, and is the seller paying it off at close or rolling it to the buyer?
- Is there a deadline driving the sale (1031 exchange, divorce, estate, relocation)? That informs how much negotiation room exists.
- Schools are B-rated — typically a magnet for longer-tenancy family renters. What's the average tenant stay here, and is there a school-zone premium baked into asking?
- The area grade is low — what's the realistic commute time and amenity access for the typical tenant pool here? Any planned neighborhood developments (good or bad) we should know about?
- What's the average days-on-market for RENTAL listings here right now (not sales)? A rising rental-DOM trend means longer vacancies and softer asking-rent achievability than the comps imply.
- What's the recent tenant-quality profile in this submarket — average credit score on applications, eviction rate, late-payment / NSF rate, and stable-employment percentage? A property-management company in the area should have these aggregated.
- How much new apartment / multifamily construction is in the pipeline within 1–3 miles? Heavy new supply (>2% of stock underway) typically softens rents 12–24 months out; light construction supports rent growth.
Investment metrics
- 1% rule
- 0.79% ✗
- Cap rate
- 4.17%
- Cash-on-cash
- -7.57%
- DSCR
- 0.66
- GRM
- 10.5
CMA / ARV
No comps found within radius.
Projected returns pro-forma
-3.0% appreciation · 4.31% rent growth · sell at horizon
- IRR
- -27.7%
- Equity multiple
- 0.06×
- Total profit
- $-65,757
- Equity at exit
- $37,261
- IRR
- -20.9%
- Equity multiple
- -0.16×
- Total profit
- $-81,498
- Equity at exit
- $21,607
Cash invested: $69,972 (down + closing). Projections, not guarantees.
Landlord ↔ Tenant lean methodology
- Overall (STATE)
- 46 Balanced
- State Minnesota
- 46 Balanced · D+2
- County
- — inherits STATE
- City
- — inherits STATE
ZIP-level market 55303
- Rents YoY
- 4.3%
- Active inventory
- 341
- Price-to-rent
- 10.5×
Monthly cashflow live
- Estimated rent
- $1,979 high interval (Pro) →
- Mortgage (P&I)
- −$1,311
- Tax from tax record
- −$218 /mo · $2,620/yr
- Insurance
- −$104
- HOA
- −$372
- Vacancy / Maint / Mgmt
- −$416
- Net cashflow
- $-441
Break-even live
UW: 25.0% down · 7.5% · 30yr · 1.5% tax · 5.0% vac · 8.0% maint · 8.0% mgmt
Financing live
Cash to close
- Down payment
- $62,475
- Closing costs
- $7,497
- Reserves months
- —
- Total cash needed
- —
Loan-product check · same deal, 3 products live
Conventional
25% down · 7.5% · 30yr
- Down + closing
- —
- Monthly P&I
- —
- Monthly cashflow
- —
- DSCR
- —
- Eligible?
- —
Personal DTI + credit; lowest rate.
DSCR
20% down · 8.5% · 30yr
- Down + closing
- —
- Monthly P&I
- —
- Monthly cashflow
- —
- DSCR
- —
- Eligible?
- —
No personal income docs; deal must DSCR.
Hard money
10% down · 12.0% · 12mo
- Down + closing
- —
- Monthly P&I
- —
- Monthly cashflow
- —
- DSCR
- —
- Eligible?
- —
Short-term bridge; refi at stabilization.
Rent comps 5 comps
| Address | Beds | Baths | Sqft | Rent | $/sqft | DOM | Units | Dist |
|---|---|---|---|---|---|---|---|---|
| 14649 Peridot Ter NW Anoka, MN | 2.0 | 2.0 | 1560 | $2,250 | $1.44 | 5d | 1 | 0.03mi |
| 7279 147 Ln NW Unit 1 Ramsey, MN | 3.0 | 1.5 | 1460 | $2,150 | $1.47 | 22d | 1 | 0.16mi |
| 14450 Rhinestone St NW Anoka, MN | 1.0–3.0 | 1.0–2.0 | 1064 | $1,952 | $1.83 | 2d | 7 | 0.29mi |
| 7555 145th Ave NW Anoka, MN | 1.0–3.0 | 1.0–2.0 | 1096 | $1,904 | $1.74 | 2d | 5 | 0.33mi |
| 7700 Sunwood Dr NW Anoka, MN | 2.0 | 1.0–2.0 | 857 | $1,975 | $2.30 | 2d | 15 | 0.53mi |
HOA detail condo
- Monthly dues
- $372 · $4,464/yr
- Assessments
- None detected in remarks — confirm with the listing agent.
Listing history 15 events
-
2026-05-08historical
-
2026-05-08$249,900 Active 923-char remark
-
2026-04-17price $250,000
-
2026-03-24price $255,000
-
2026-03-17$260,000 Active
-
2026-03-17historical
-
2026-02-25price $260,000
-
2026-02-12$265,000 Active
-
2026-02-10historical
-
2019-11-14soldstatus $185,000
-
2019-11-08soldstatus $185,000 Sold
-
2019-10-02historical
-
2019-09-26price $179,900
-
2019-08-29price $187,000
-
2019-08-01$199,900 Active
ⓘ Source: listings_history table (triggers on properties + properties_extension) + one-shot
backfill from property_details.listing_events for pre-trigger history.
Tax reassessment forecast MN · Partial reset (capped growth)
- Current annual tax
- $2,620 · $218/mo
- Projected year-2 tax
- $2,709 · $226/mo
- Expected delta
- +$89/yr (+$7/mo · 3.4%)
ⓘ Screening estimate from a state-policy table — verify with the county assessor before closing.
Climate risk First Street
- Flood 1/10 Low FEMA zone X (unshaded) · 0% chance over 30 yrs
- Wildfire 2/10 Low
- Heat 3/10 Moderate 7 d/yr ≥98°F today · 14 d/yr by 30 yrs out
- Wind 2/10 Low
- Air quality 2/10 Low 1 unhealthy d/yr today · 2 by 30 yrs out
Nearby sold comps map
Loading sold comps map…
Walkable amenities ~0.75 mi
Loading nearby amenities…
Taxation est. · year 1
- Rental income
- $23,752
- − Mortgage interest
- −$13,998
- − Property taxes
- −$2,620
- − Insurance
- −$1,250
- − Repairs & maintenance
- −$1,900
- − Management
- −$1,900
- − HOA
- −$4,464
- − Depreciation
- −$7,270
- Taxable loss
- −$9,650
- Est. tax savings @ 24.0%
- +$2,316
- After-tax cash flow
- $-2,980/yr
For passive investors: Depreciation is non-cash, so a rental often shows a tax loss while cash-flowing — sheltering income. Rental losses are passive: they offset passive income freely, and up to $25,000/yr can offset ordinary (W-2) income if you actively participate and your MAGI is under $100k (phasing out to $0 by $150k); unused losses carry forward. On sale, claimed depreciation is recaptured at up to 25%, and gains may owe capital-gains tax (a 1031 exchange can defer both). Figures are a year-1 estimate at your 24.0% rate — not tax advice; consult a CPA.
Schools (NCES district)
- District
- Anoka-Hennepin Public School District
- NCES district ID
- 2703180
- Math proficiency
- 49% ▼ -14.00%
- Reading proficiency
- 55% ▼ -10.00%
- Median HH income
- $73,837
- Composite
- 46.7/100
- National rank
- #2400
- State rank
- #71 of 301 in MN
Livability — Ramsey
- Score
- 69/100
- State rank
- #354
- US rank
- #8271
Category grades
Schools grade is shown separately in the Schools card above.
Census & demographics
- Census place
- Ramsey, MN
- County
- Anoka County · 277,116 people
- City population
- 52,614
- Metro
- Minneapolis-St. Paul-Bloomington, MN-WI
- Population (ZIP)
- 52,614
- Household income
- $102,986
- Rent vs Own
- Severe rent burden
- 1060.0
Population outlook (Anoka County) Hauer SSP2
- Today (2025)
- 375,223 people
- By 2030
- 387,850 · +3.4%
- By 2040
- 407,239 · +8.5%
- By 2050
- 417,541 · +11.3%
- By 2075
- 448,447 · +19.5%
- By 2100
- 464,954 · +23.9%
Race, ethnicity, and origin ACS 2023
- Neighborhood character
- Predominantly White (82%)
- Race & ethnicity
- White 82% Black 7% Two or more races 6% Hispanic / Latino 4% Asian 3%
- Common ancestry
- Portuguese 12% Romanian 5% Lithuanian 4%
- Foreign-born
- 7% · Canada, South Korea, Vietnam
- Languages at home
- 92% English-only · Other Asian/Pacific 2% Spanish 2% French/Haitian/Cajun 1%
Political lean MEDSL · Anoka
- 2024 margin
- Toss-up / Even · D 46.6% · R 51.0% · Other 2.4%
- 2008→2024 swing
- -2.0pp toward R · 2008: -2.4pp · 2024: -4.4pp
- All cycles
- 2024: R+4.4 2020: R+1.9 2016: R+9.7 2012: R+2.6 2008: R+2.4
Not yet ingested
- Civics
- —
Market trends
- HPI YoY
- ▼ -273.26%
- Current HPI
- 251.4034
- Rent YoY
- ▲ 4.31%
- Metro
- Minneapolis-St. Paul-Bloomington, MN-WI
- State GDP YoY
- ▲ 2.41%
- F500 in state
- 34
Industry mix (Fortune 500 HQ in MN)
| Industry | F500 HQs | Revenue |
|---|---|---|
| Healthcare | 2 | $407B |
|
||
| Retail | 2 | $150B |
|
||
| Consumer Goods | 2 | $32B |
|
||
| Industrial Machinery | 2 | $6B |
|
||
| Agriculture | 1 | $40B |
|
||
| Healthcare / Medical Devices | 1 | $32B |
|
||
Price history
-98.9% since first listed20 events — show timeline
- 2026-06-09 Price Changed $2,250 APPFOLIO
- 2026-06-08 Sold (MLS) $239,000 NORTHSTARMLS as Distributed by MLS Grid
- 2026-06-05 Price Changed $2,395 APPFOLIO
- 2026-05-29 Listed for Rent $2,450 APPFOLIO
- 2026-05-19 Pending — NORTHSTARMLS as Distributed by MLS Grid
- 2026-05-08 Listing Removed — NORTHSTARMLS as Distributed by MLS Grid
- 2026-05-08 Listed $249,900 NORTHSTARMLS as Distributed by MLS Grid
- 2026-04-17 Price Changed $250,000 NORTHSTARMLS as Distributed by MLS Grid
- 2026-03-24 Price Changed $255,000 NORTHSTARMLS as Distributed by MLS Grid
- 2026-03-17 Listing Removed — NORTHSTARMLS as Distributed by MLS Grid
- 2026-03-17 Listed $260,000 NORTHSTARMLS as Distributed by MLS Grid
- 2026-02-25 Price Changed $260,000 NORTHSTARMLS as Distributed by MLS Grid
- 2026-02-12 Listed $265,000 NORTHSTARMLS as Distributed by MLS Grid
- 2026-02-10 Coming Soon — NORTHSTARMLS as Distributed by MLS Grid
- 2019-11-14 Sold (Public Records) $185,000 Public Records
- 2019-11-08 Sold (MLS) $185,000 NORTHSTARMLS as Distributed by MLS Grid
- 2019-10-02 Listing Removed — NORTHSTARMLS as Distributed by MLS Grid
- 2019-09-26 Price Changed $179,900 NORTHSTARMLS as Distributed by MLS Grid
- 2019-08-29 Price Changed $187,000 NORTHSTARMLS as Distributed by MLS Grid
- 2019-08-01 Listed $199,900 NORTHSTARMLS as Distributed by MLS Grid
Property tax history
+5.8%/yrLatest (2026): $2,620 · +1.7% YoY. Source: county tax records.
Cash-flow waterfall
monthlySold comps — $/sqft
last 12 mo · ≤1 miLoading sold comps…