 Triplex
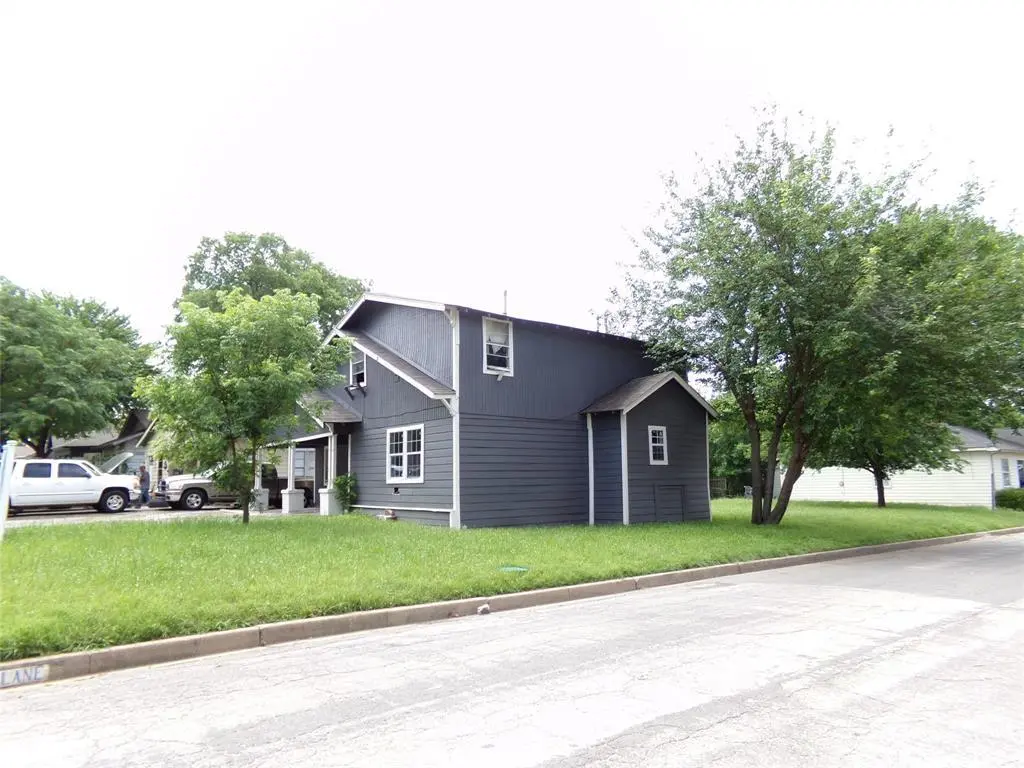
601 Cristler Ave · Dallas, TX
Flood risk 1/10 · Minimal
- FEMA flood zone
- X (unshaded)
- Chance of flooding over 30 yrs
- 0.0%
- Est. flood insurance / yr
- $507 – $1,088
Fire risk 1/10 · Minimal
- Est. fire insurance / yr
- $1,222 – $2,270
Heat risk 7/10 · Major
- Hot days now (above 109°F)
- 7 days/yr
- Hot days in 30 yrs
- 23 days/yr
Wind risk 6/10 · Moderate
- Chance of severe wind over 30 yrs
- 27.0%
Air-quality risk 2/10 · Minimal
- Unhealthy air days now
- 2 days/yr
- Unhealthy air days in 30 yrs
- 2 days/yr
Risk factors via First Street. Map © Google.
Why this score? — see what drove the B+ grade
The composite is a weighted blend of 9 inputs, each scored 0–100. Each bar is that input's sub-score; the figure is the points it added to the 100-point composite (weight × sub-score).
- Cash flow +30.0/30.0
- ARV discount +15.0/15.0
- 1% rule +10.0/10.0
- DSCR +10.0/10.0
- Livability +4.0/5.0
- Schools +2.8/10.0
- Rent growth +2.5/5.0
- Condition / age +2.5/5.0
- Appreciation +0.0/10.0
$325,000
🖨 Deal sheet 📄 Offer letter ✓ Due diligence
Multi-family units
County records classify this as Multi-Family (5+ Unit). Listing-text estimate: 3 units. estimate disagrees with records
5+ unit building — per-unit beds/baths from public records are typically unavailable; the breakdown below (if shown) is an estimate from the listing text.
Listing remarks
This property is being sold as is, excellent for rehab, and to keep it as a rental. True Triplex 3 separate gas and electric meters. Buyer and Agent to verify all information. Go and Show.
Key facts
- True triplex
- 7,144 sq ft lot
- 4 parking spots
Tags
Property features AI
Finance
- Other: Triplex with 3 total units across 1 building; Building area reported as 2060 (per public records); Property on a 0.164-acre lot; Parcel ID available; Directions: Off of I-30 Exit East Grand, go North; then on Cristler turn West; Located in Dallas County, United States; Subdivision: Mount Aubourn Add; Complex name: Cristler
- Financial info: Treated as clear loan type; Second mortgage present; Gross annual income and expenses not reported
- HOA & community: No association
Exterior
- Parking: Driveway; 4 parking spaces
- Utilities: City water; City sewer; Not in a municipal utility district
- Home design: Residential income property — Triplex
- Construction: Built in 1922; Siding exterior; Composition roof; Pillar/post/pier foundation
- Exterior features: Will subdivide
Interior
- Kitchen: No appliances listed
- Bedrooms: 4 bedrooms
- Flooring: Vinyl flooring
- Bathrooms: 3 full bathrooms
- Heating & cooling: Other heating; Other cooling
- Interior features: Two-level layout; Vinyl flooring; Other interior features
- Laundry & utility: No laundry appliances listed
Neighborhood map
What this means for you Summary
Snapshot
- This is a 3 × 4-bed/3.0-bath units multifamily listed at $325k.
Deal economics
- At list price, monthly cash flow is $3k ($32k/yr) — positive. Per door: $898/mo.
- The deal already cash-flows at list — no discount required.
- Meets the 1% rule at list price ($7k rent vs $325k).
- Recommended offer: $315k (3.0% below list) — sets the bar for market timing.
- Cap rate 16.2% vs local median 2.3% in Dallas — top-decile yield for the area; either an underpriced asset or a hidden risk that comps aren't pricing in. Stress-test before assuming the spread holds.
Location & tenants
- Location reads 81/100 on livability (#24 in TX, #1,380 nationally) — a professional / high-income tenant draw. Strengths: amenities A+, commute A+, housing A+; Watch: crime F.
- Dallas ISD (urban): math 31% / reading 36% proficiency, ranked #559 of 826 in TX (top 68%) — families likely to look elsewhere, expect single-tenant / working-renter base with shorter leases; 83% free/reduced lunch — lower-income household profile, screen leases tightly.
- Zoned schools: William Lipscomb El (math 22% / reading 32%, grade F, #2,791 of 4,322 statewide, top 68%, 434 students, 70% FRL).
- Market conditions: 88 active listings in the ZIP; 40 comparable units currently listed for rent nearby; rentals at typical pace (median 25d on market — plan ~3-4 weeks tenant-placement turnaround); 12,577 units permitted in Dallas County in 2024 (6,829 in 5+ unit buildings).
Forward outlook
- Local home prices are declining (-3.0%/yr); year-one equity from $2k of loan paydown is wiped out by about $10k of value loss. Plan a longer hold.
- Dallas County population projected at +35% by 2050 — long-run rental-demand tailwind backs the buy-and-hold thesis.
- At projected returns (-3.0% appreciation + 3.0% rent growth), your $91k cash investment doubles in ~4 years — after that, you're playing with house money.
Negotiation context
- It's been on market 41 days — a 3% lower offer ($315k) is reasonable based on typical stale-listing flexibility.
- 7 sale attempts since 25y ago with the ask held roughly flat each time — persistent listings suggest the price (not the market) is what's stuck; bring a comps-based counter.
- Current owner paid $42k; list at $325k implies a 676% gain — meaningful room to come down on a strong offer.
Risks & watch-outs
- Watch-outs: property tax is 2.9% of price; built in 1922 — expect roof / HVAC / electrical / plumbing capex.
- Climate carrying-cost: major wind risk, 27% chance of damaging wind over 30y; extreme-heat days projected 7→23/yr by 2055 (HVAC capex compounding) — expect insurance premiums to compound above CPI over the hold.
Questions for the listing agent
- It's been on market 41 days. Have you received any prior offers? Is the seller open to a 3% concession, seller financing, or rate buy-down credit?
- Can we see the unit-by-unit rent roll, current vacancy, and any below-market leases? What's the average tenancy length?
- What capital expenditures (roof, boiler, parking lot, exteriors) have been made in the last 5 years, and what's planned in the next 2?
- Built in 1922 — when were the roof, HVAC, electrical panel, plumbing, and water heater last replaced?
- Property tax is high relative to price — has the assessment been appealed recently, and will the sale trigger a re-assessment?
- Is there a deadline driving the sale (1031 exchange, divorce, estate, relocation)? That informs how much negotiation room exists.
- Crime grade is F in this area — have there been break-ins, vandalism, or insurance claims at this property in the last 3 years? What carrier currently insures it and at what premium?
- What's the average days-on-market for RENTAL listings here right now (not sales)? A rising rental-DOM trend means longer vacancies and softer asking-rent achievability than the comps imply.
- What's the recent tenant-quality profile in this submarket — average credit score on applications, eviction rate, late-payment / NSF rate, and stable-employment percentage? A property-management company in the area should have these aggregated.
- How much new apartment / multifamily construction is in the pipeline within 1–3 miles? Heavy new supply (>2% of stock underway) typically softens rents 12–24 months out; light construction supports rent growth.
Investment metrics
- 1% rule
- 2.07% ✓
- Cap rate
- 16.24%
- Cash-on-cash
- 35.54%
- DSCR
- 2.58
- GRM
- 4.0
CMA / ARV
- ARV (median comp)
- $473,239
- List price
- $325,000
- Delta
- -31.32%
- Verdict
- UNDERPRICED
- Comps
- 15 within 1.0 mi
Show comp detail 1 sale within ~0.75 mi
| Address | Dist | Beds/Ba | Sqft | Sold | Price | $/sf | Match |
|---|---|---|---|---|---|---|---|
| 5832 Victor St | 0.48mi | 3/2.0 | 2,096 (+2%) | 17mo | $475,000 | $227 | 57 |
Match score weights: distance 35% · size 25% · config 20% · recency 20%. Top-matched comps best support the ARV.
Projected returns pro-forma
-3.0% appreciation · 3.0% rent growth · sell at horizon
- IRR
- 31.2%
- Equity multiple
- 2.31×
- Total profit
- $119,317
- Equity at exit
- $48,459
- IRR
- 38.4%
- Equity multiple
- 4.59×
- Total profit
- $326,267
- Equity at exit
- $28,100
Cash invested: $91,000 (down + closing). Projections, not guarantees.
Landlord ↔ Tenant lean methodology
- Overall (STATE)
- 87 Strongly Landlord-Friendly
- State Texas
- 87 Strongly Landlord-Friendly · R+5
- County
- — inherits STATE
- City
- — inherits STATE
ZIP-level market 75223
- Home prices YoY
- -24.6%
- Active inventory
- 88
- Price-to-rent
- 12.1×
Monthly cashflow live
- Estimated rent
- $6,725 medium interval (Pro) →
- Mortgage (P&I)
- −$1,704
- Tax from tax record
- −$778 /mo · $9,335/yr
- Insurance
- −$135
- HOA
- −$0
- Vacancy / Maint / Mgmt
- −$1,412
- Net cashflow
- $2,695
Break-even live
3-unit breakdown (identical units grouped — click to expand)
| Units | Beds | Baths | Est. rent |
|---|---|---|---|
| 3× units | 4 | 3 | $6,726 |
| #1 | 4 | 3 | $2,242 |
| #2 | 4 | 3 | $2,242 |
| #3 | 4 | 3 | $2,242 |
| Total (3 units) | $6,725 | ||
UW: 25.0% down · 7.5% · 30yr · 1.5% tax · 5.0% vac · 8.0% maint · 8.0% mgmt
Financing live
Cash to close
- Down payment
- $81,250
- Closing costs
- $9,750
- Reserves months
- —
- Total cash needed
- —
Loan-product check · same deal, 3 products live
Conventional
25% down · 7.5% · 30yr
- Down + closing
- —
- Monthly P&I
- —
- Monthly cashflow
- —
- DSCR
- —
- Eligible?
- —
Personal DTI + credit; lowest rate.
DSCR
20% down · 8.5% · 30yr
- Down + closing
- —
- Monthly P&I
- —
- Monthly cashflow
- —
- DSCR
- —
- Eligible?
- —
No personal income docs; deal must DSCR.
Hard money
10% down · 12.0% · 12mo
- Down + closing
- —
- Monthly P&I
- —
- Monthly cashflow
- —
- DSCR
- —
- Eligible?
- —
Short-term bridge; refi at stabilization.
Rent comps 40 comps
| Address | Beds | Baths | Sqft | Rent | $/sqft | DOM | Units | Dist |
|---|---|---|---|---|---|---|---|---|
| 314 S Glasgow Dr Dallas, TX | 3.0 | 2.5 | 1837 | $3,500 | $1.91 | 24d | 1 | 0.15mi |
| 312 S Glasgow Dr Dallas, TX | 3.0 | 2.5 | 2017 | $3,750 | $1.86 | 19d | 1 | 0.16mi |
| 805 S Glasgow Dr Dallas, TX | 3.0 | 2.5 | 2342 | $3,850 | $1.64 | 5d | 1 | 0.18mi |
| 807 S Glasgow Dr Dallas, TX | 3.0 | 2.5 | 2342 | $3,950 | $1.69 | 5d | 1 | 0.19mi |
| 6129 Reiger Ave Dallas, TX | 2.0 | 1.5 | 1611 | $2,200 | $1.37 | 44d | 1 | 0.38mi |
| 6132 Victor St Dallas, TX | 3.0 | 2.0 | 1956 | $3,000 | $1.53 | 24d | 1 | 0.43mi |
| 6210 Victor St Dallas, TX | 2.0 | 2.0 | 1812 | $4,975 | $2.75 | 44d | 1 | 0.44mi |
| 5316 East Side Ave Dallas, TX | 3.0 | 2.5 | 2000 | $3,900 | $1.95 | 7d | 1 | 0.72mi |
| 402 S Henderson Ave Dallas, TX | 4.0 | 4.0 | 2200 | $4,250 | $1.93 | 24d | 1 | 0.74mi |
| 988 Shadyside Ln Dallas, TX | 3.0 | 2.5 | 2952 | $5,099 | $1.73 | 24d | 1 | 0.76mi |
| 5227 Lindsley Ave Dallas, TX | 3.0 | 2.5 | 2250 | $3,999 | $1.78 | 44d | 1 | 0.79mi |
| 6270 Oram St Unit 105 Dallas, TX | 2.0 | 2.5 | 1556 | $3,195 | $2.05 | 21d | 1 | 0.89mi |
| 6270 Oram St Unit 107 Dallas, TX | 2.0 | 2.5 | 1556 | $3,400 | $2.19 | 22d | 1 | 0.89mi |
| 6250 Oram St Unit 102 Dallas, TX | 2.0 | 2.5 | 1616 | $3,750 | $2.32 | 44d | 1 | 0.92mi |
| 709 S Munger Blvd Dallas, TX | 4.0 | 1.0 | 1610 | $2,100 | $1.30 | 7d | 1 | 0.98mi |
| 7450 Coronado Ave Dallas, TX | 1.0–3.0 | 1.0–3.0 | 1617 | $5,129 | $3.17 | 1d | 22 | 0.99mi |
| 4918 Garland Ave Dallas, TX | 3.0 | 2.5 | 1725 | $2,500 | $1.45 | 24d | 1 | 1.03mi |
| 6159 Oram St Dallas, TX | 1.0–3.0 | 1.5–3.0 | 1391 | $3,200 | $2.30 | 14d | 1 | 1.04mi |
| 6241 Richmond Ave #1 Dallas, TX | 2.0 | 2.0 | 2400 | $3,150 | $1.31 | 22d | 1 | 1.09mi |
| 6241 Richmond Ave Unit LOWER1 Dallas, TX | 2.0 | 2.0 | 2400 | $3,150 | $1.31 | 21d | 1 | 1.09mi |
| 6313 Belmont Ave Dallas, TX | 4.0 | 3.0 | 2698 | $6,500 | $2.41 | 24d | 1 | 1.11mi |
| 5637 Live Oak St Unit 201 Dallas, TX | 2.0 | 2.5 | 1533 | $3,400 | $2.22 | 7d | 1 | 1.12mi |
| 5633 Live Oak St Unit 102 Dallas, TX | 2.0 | 2.5 | 1533 | $3,400 | $2.22 | 7d | 1 | 1.12mi |
| 7532 E Grand Ave Dallas, TX | 1.0–3.0 | 1.0–3.0 | 1404 | $5,170 | $3.68 | 1d | 75 | 1.15mi |
| 5089 Gaston Ave #1002 Dallas, TX | 2.0 | 2.5 | 2083 | $3,395 | $1.63 | 17d | 1 | 1.15mi |
| 4807 Parry Ave Dallas, TX | 4.0 | 3.0 | 2024 | $2,800 | $1.38 | 44d | 1 | 1.19mi |
| 6017 Hudson St Unit 102 Dallas, TX | 2.0 | 2.5 | 1406 | $3,150 | $2.24 | 24d | 1 | 1.19mi |
| 4717 Garland Ave Dallas, TX | 3.0 | 2.5 | 2356 | $3,000 | $1.27 | 44d | 1 | 1.20mi |
| 5946 La Vista Dr Dallas, TX | 2.0 | 1.0 | 1428 | $1,895 | $1.33 | 44d | 1 | 1.20mi |
| 5916 Hudson St #10 Dallas, TX | 2.0 | 2.5 | 1820 | $3,500 | $1.92 | 22d | 1 | 1.20mi |
| 2508 Loving Ave Dallas, TX | 3.0 | 2.0 | 1700 | $3,200 | $1.88 | 2d | 1 | 1.22mi |
| 2508 Loving Ave Dallas, TX | 3.0 | 2.0 | 1697 | $3,300 | $1.94 | 44d | 1 | 1.22mi |
| 5816 Lindell Ave #2 Dallas, TX | 2.0 | 3.0 | 2187 | $4,200 | $1.92 | 24d | 1 | 1.24mi |
| 5810 Hudson St #102 Dallas, TX | 2.0 | 2.5 | 1618 | $3,600 | $2.22 | 44d | 1 | 1.27mi |
| 1333 S Fitzhugh Ave Dallas, TX | 4.0 | 2.0 | 1670 | $1,895 | $1.13 | 7d | 1 | 1.27mi |
| 5804 Hudson St Unit B Dallas, TX | 2.0 | 2.5 | 1992 | $4,500 | $2.26 | 7d | 1 | 1.27mi |
| 5714 Lindell Ave Dallas, TX | 2.0 | 3.0 | 1950 | $3,800 | $1.95 | 44d | 1 | 1.28mi |
| 5714 Lindell Ave Unit 103 Dallas, TX | 2.0 | 2.5 | 1440 | $3,600 | $2.50 | 7d | 1 | 1.28mi |
| 2655 Lakeforest Ct Dallas, TX | 3.0 | 2.5 | 2025 | $4,000 | $1.98 | 44d | 1 | 1.30mi |
| 1307 Halcyon Pl Dallas, TX | 2.0 | 2.5 | 1748 | $2,700 | $1.54 | 44d | 1 | 1.32mi |
Listing history 36 events
-
2026-06-18days on market $325,000 Active 41 DOM
-
2026-06-17days on market $325,000 Active 40 DOM
-
2026-06-16days on market $325,000 Active 39 DOM
-
2026-06-15days on market $325,000 Active 38 DOM
-
2026-06-13days on market $325,000 Active 36 DOM
-
2026-06-09days on market $325,000 Active 32 DOM
-
2026-06-08days on market $325,000 Active 31 DOM
-
2026-06-07days on market $325,000 Active 30 DOM
-
2026-06-04days on market $325,000 Active 27 DOM
-
2026-06-03days on market $325,000 Active 26 DOM
-
2026-06-02days on market $325,000 Active 25 DOM
-
2026-06-01days on market $325,000 Active 24 DOM
-
2026-05-31days on market $325,000 Active 23 DOM
-
2026-05-08$325,000 Active 188-char remark
-
2025-11-20historical
-
2025-10-22price $350,000
-
2025-08-21$375,000 Active
-
2025-05-11historical
-
2025-04-16$425,000 Active
-
2024-12-16soldstatus
-
2023-09-15historical
-
2023-05-23$499,000 Active
-
2021-10-05soldstatus
-
2021-09-29soldstatus Sold
-
2021-08-28status Pending
-
2021-08-17historical Active Option Contract
-
2021-08-12status Active
-
2021-08-10historical Active Option Contract
-
2021-07-11$295,000 Active
-
2012-09-13soldstatus
-
2011-12-13soldstatus
-
2002-08-22soldstatus
-
2002-03-14soldstatus
-
2002-02-23historical
-
2001-11-13$67,500
-
1997-10-06soldstatus $41,895
ⓘ Source: listings_history table (triggers on properties + properties_extension) + one-shot
backfill from property_details.listing_events for pre-trigger history.
Tax reassessment forecast TX · Resets to sale price
- Current annual tax
- $9,335 · $778/mo
- Projected year-2 tax
- $9,335 · $778/mo
- Expected delta
- $0/yr ($0/mo · 0.0%)
ⓘ Screening estimate from a state-policy table — verify with the county assessor before closing.
Climate risk First Street
- Flood 1/10 Low FEMA zone X (unshaded) · 0% chance over 30 yrs
- Wildfire 1/10 Low
- Heat 7/10 Severe 7 d/yr ≥109°F today · 23 d/yr by 30 yrs out
- Wind 6/10 Major 27% chance of damaging wind over 30 yrs
- Air quality 2/10 Low 2 unhealthy d/yr today · 2 by 30 yrs out
Nearby sold comps map
Loading sold comps map…
Walkable amenities ~0.75 mi
Loading nearby amenities…
Taxation est. · year 1
- Rental income
- $80,700
- − Mortgage interest
- −$18,205
- − Property taxes
- −$9,335
- − Insurance
- −$1,625
- − Repairs & maintenance
- −$6,456
- − Management
- −$6,456
- − Depreciation
- −$9,455
- Taxable income
- $29,168
- Est. tax owed @ 24.0%
- −$7,000
- After-tax cash flow
- $25,341/yr
For passive investors: Depreciation is non-cash, so a rental often shows a tax loss while cash-flowing — sheltering income. Rental losses are passive: they offset passive income freely, and up to $25,000/yr can offset ordinary (W-2) income if you actively participate and your MAGI is under $100k (phasing out to $0 by $150k); unused losses carry forward. On sale, claimed depreciation is recaptured at up to 25%, and gains may owe capital-gains tax (a 1031 exchange can defer both). Figures are a year-1 estimate at your 24.0% rate — not tax advice; consult a CPA.
Schools (NCES district)
- District
- Dallas ISD
- NCES district ID
- 4816230
- Math proficiency
- 31% ▼ -16.00%
- Reading proficiency
- 36% ▼ -4.00%
- Median HH income
- $42,881
- Composite
- 28.41/100
- National rank
- #6763
- State rank
- #559 of 826 in TX
Livability — Dallas
- Score
- 81/100
- State rank
- #24
- US rank
- #1380
Category grades
Schools grade is shown separately in the Schools card above.
Census & demographics
- Census place
- Dallas, TX
- County
- Dallas County · 2,612,404 people
- City population
- 1,168,437
- Metro
- Dallas-Fort Worth-Arlington, TX
- Population (ZIP)
- 11,994
- Household income
- $73,318
- Rent vs Own
- Severe rent burden
- 526.0
Population outlook (Dallas County) Hauer SSP2
- Today (2025)
- 2,979,839 people
- By 2030
- 3,191,823 · +7.1%
- By 2040
- 3,619,611 · +21.5%
- By 2050
- 4,026,915 · +35.1%
- By 2075
- 4,957,073 · +66.4%
- By 2100
- 5,508,725 · +84.9%
Race, ethnicity, and origin ACS 2023
- Neighborhood character
- Predominantly Hispanic (66%)
- Race & ethnicity
- Hispanic / Latino 66% Two or more races 19% White 18% Black 12% Asian 2%
- Hispanic origin (detail)
- Mexican 63% Dominican 1%
- Common ancestry
- Lithuanian 1% Portuguese 1% Slovak 1%
- Foreign-born
- 30% · Canada
- Languages at home
- 40% English-only · Spanish 59% Other Indo-European 1%
Political lean MEDSL · Dallas
- 2024 margin
- Strong D (+22.2) · D 60.2% · R 38.0% · Other 1.8%
- 2008→2024 swing
- +6.9pp toward D · 2008: 15.3pp · 2024: 22.2pp
- All cycles
- 2024: D+22.2 2020: D+31.6 2016: D+26.2 2012: D+15.4 2008: D+15.3
Not yet ingested
- Civics
- —
Market trends
- HPI YoY
- ▼ -121.38%
- Current HPI
- 372.672
- Rent YoY
- —
- Metro
- Dallas-Fort Worth-Arlington, TX
- State GDP YoY
- ▲ 3.95%
- F500 in state
- 110
Industry mix (Fortune 500 HQ in TX)
| Industry | F500 HQs | Revenue |
|---|---|---|
| Energy | 16 | $1,198B |
|
||
| Technology | 5 | $198B |
|
||
| Engineering / Construction | 4 | $72B |
|
||
| Energy Services | 3 | $60B |
|
||
| Utilities | 3 | $41B |
|
||
| Healthcare | 2 | $330B |
|
||
Price history
+675.7% since first listed23 events — show timeline
- 2026-05-08 Listed $325,000 NTREIS
- 2025-11-20 Listing Removed — NTREIS
- 2025-10-22 Price Changed $350,000 NTREIS
- 2025-08-21 Listed $375,000 NTREIS
- 2025-05-11 Listing Removed — NTREIS
- 2025-04-16 Listed $425,000 NTREIS
- 2024-12-16 Sold (Public Records) — Public Records
- 2023-09-15 Listing Removed — NTREIS
- 2023-05-23 Listed $499,000 NTREIS
- 2021-10-05 Sold (Public Records) — Public Records
- 2021-09-29 Sold (MLS) — NTREIS
- 2021-08-28 Pending — NTREIS
- 2021-08-17 Contingent — NTREIS
- 2021-08-12 Relisted — NTREIS
- 2021-08-10 Contingent — NTREIS
- 2021-07-11 Listed $295,000 NTREIS
- 2012-09-13 Sold (Public Records) — Public Records
- 2011-12-13 Sold (Public Records) — Public Records
- 2002-08-22 Sold (Public Records) — Public Records
- 2002-03-14 Sold (Public Records) — Public Records
- 2002-02-23 Listing Removed — NTREIS
- 2001-11-13 Listed $67,500 NTREIS
- 1997-10-06 Sold (Public Records) $41,895 Public Records
Property tax history
+8.3%/yrLatest (2025): $9,335 · -0.4% YoY. Source: county tax records.
Cash-flow waterfall
monthlySold comps — $/sqft
last 12 mo · ≤1 miLoading sold comps…