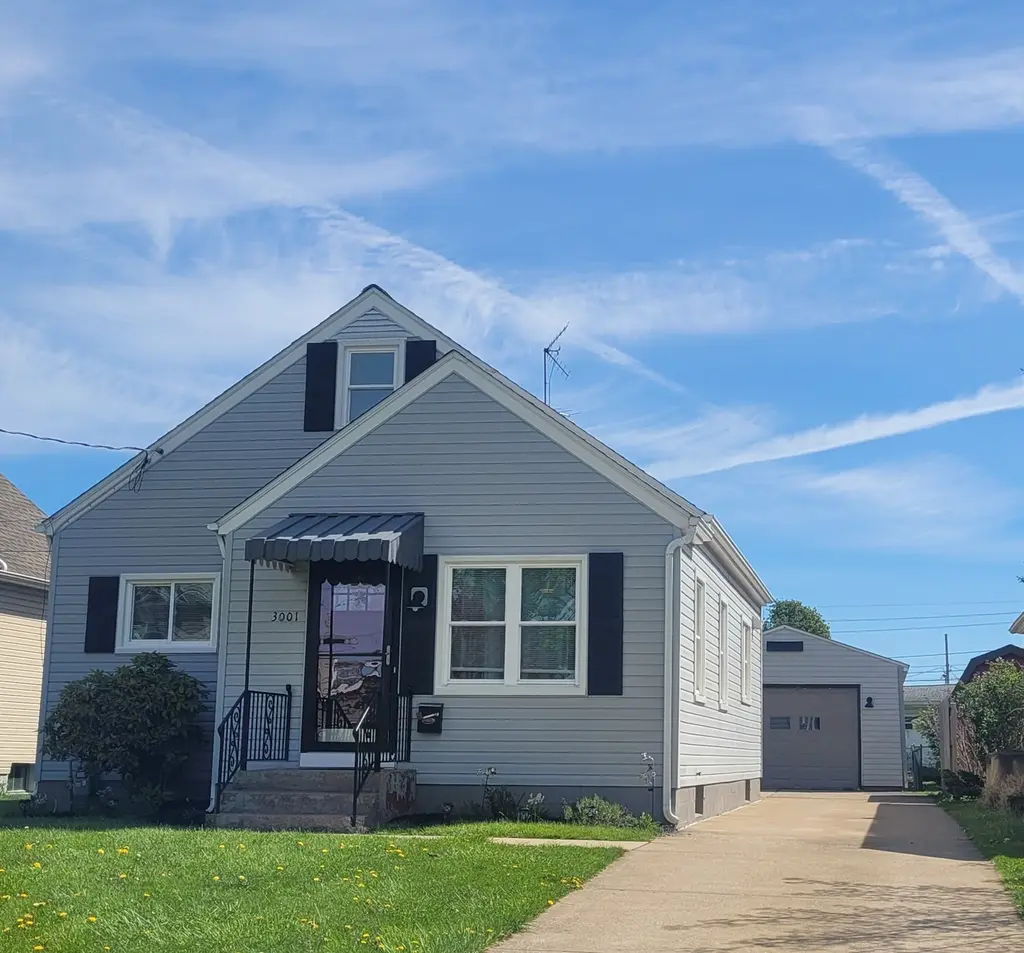
3001 Highland Rd · Erie, PA
Flood risk 1/10 · Minimal
- FEMA flood zone
- X (unshaded)
- Chance of flooding over 30 yrs
- 0.0%
- Est. flood insurance / yr
- $473 – $860
Fire risk 1/10 · Minimal
- Est. fire insurance / yr
- $511 – $949
Heat risk 2/10 · Minimal
- Hot days now (above 90°F)
- 7 days/yr
- Hot days in 30 yrs
- 17 days/yr
Wind risk 1/10 · Minimal
- Chance of severe wind over 30 yrs
- —
Air-quality risk 2/10 · Minimal
- Unhealthy air days now
- 1 days/yr
- Unhealthy air days in 30 yrs
- 3 days/yr
Risk factors via First Street. Map © Google.
Why this score? — see what drove the F grade
The composite is a weighted blend of 9 inputs, each scored 0–100. Each bar is that input's sub-score; the figure is the points it added to the 100-point composite (weight × sub-score).
- Cash flow +11.9/30.0
- Schools +4.8/10.0
- Livability +4.2/5.0
- DSCR +3.5/10.0
- 1% rule +3.0/10.0
- Rent growth +2.5/5.0
- Condition / age +2.5/5.0
- ARV discount +0.0/15.0
- Appreciation +0.0/10.0
$229,900
🖨 Deal sheet 📄 Offer letter ✓ Due diligence
Listing remarks
Beautifully Kept Millcreek Cape! Step into this charming home featuring a large living room with gleaming hardwood floors and a gorgeous eat-in kitchen with ceramic backsplash and tile flooring. The bathroom has been completely remodeled, and the home includes newer windows with screens. Enjoy efficient comfort with a forced-air gas furnace and hot water tank updated in 2022. The spacious second floor bedroom offers a large closet, and there’s an additional toilet in the basement for convenience. Outside, you’ll love the generous yard and detached garage with a covered cement patio—perfect for outdoor gatherings. Move-in ready and full of character!
Key facts
- 6,281 sq ft lot
- Garage
- Built 1950
Property features AI
Exterior
- Parking: Total 2 parking spaces; Detached 1-car garage; Paved driveway
- Utilities: Public water; Public sewer
- Home design: Single-family residence; One and one-half stories; Residential zoning
- Construction: Vinyl siding; Composition roof; Built with a full basement
- Exterior features: Patio; Landscaped lot; Paved road access
Interior
- Kitchen: Dishwasher; Gas oven; Gas range; Refrigerator
- Bedrooms: Total of 6 rooms (bedrooms included)
- Flooring: Carpet; Ceramic tile; Hardwood
- Bathrooms: 1 full bathroom
- Heating & cooling: Forced air heating; Central air conditioning; Ceiling fan(s)
- Interior features: Ceiling fans
- Laundry & utility: Has full basement
Neighborhood map
What this means for you Summary
Snapshot
- This is a 2-bed/1.0-bath single-family listed at $230k.
Deal economics
- At list price, monthly cash flow is $-59 ($-702/yr) — negative.
- To cash-flow at today's rent, offer at most $220k (4.5% below list).
- To meet the 1% rule (rent ≥ 1% of price), the offer needs to be $184k (19.9% below list).
- Recommended offer: $184k (19.9% below list) — sets the bar for 1% rule.
Location & tenants
- Location reads 83/100 on livability (#109 in PA, #840 nationally) — a professional / high-income tenant draw. Strengths: amenities A+, commute A+, cost of living A+; Watch: crime D+, employment F.
- Millcreek Township SD (suburban): math 46% / reading 65% proficiency, ranked #105 of 539 in PA (top 20%) — acceptable for families but not a draw, mixed tenant base, ~2y average lease.
- Market conditions: 96 active listings in the ZIP; 8 comparable units currently listed for rent nearby; rentals lingering (median 44d on market — plan ~5-8 weeks vacancy on turnover, expect pricing pressure); 100% of comp listings sitting > 30 days — soft ceiling on asking rent; solid renter incomes; 364 units permitted in Erie County in 2024 (188 in 5+ unit buildings).
Forward outlook
- Local home prices are declining (-3.0%/yr); year-one equity from $2k of loan paydown is wiped out by about $7k of value loss. Plan a longer hold.
- Erie County population projected at -14% by 2050 — secular population decline; favor cash flow + early exit over multi-decade hold.
Negotiation context
- Only 3 days on market — expect competitive offers; lowballing is unlikely to land.
Risks & watch-outs
- Watch-outs: built in 1950 — expect roof / HVAC / electrical / plumbing capex.
Questions for the listing agent
- What do current leases actually rent for vs. the listed asking? Can we see a recent rent roll and the last 12 months of T-12 income?
- Built in 1950 — when were the roof, HVAC, electrical panel, plumbing, and water heater last replaced?
- Is there a deadline driving the sale (1031 exchange, divorce, estate, relocation)? That informs how much negotiation room exists.
- Crime grade is D in this area — have there been break-ins, vandalism, or insurance claims at this property in the last 3 years? What carrier currently insures it and at what premium?
- The area grade is low — what's the realistic commute time and amenity access for the typical tenant pool here? Any planned neighborhood developments (good or bad) we should know about?
- What's the average days-on-market for RENTAL listings here right now (not sales)? A rising rental-DOM trend means longer vacancies and softer asking-rent achievability than the comps imply.
- What's the recent tenant-quality profile in this submarket — average credit score on applications, eviction rate, late-payment / NSF rate, and stable-employment percentage? A property-management company in the area should have these aggregated.
- How much new for-sale + rental construction is in the pipeline within 1–3 miles? Heavy new supply typically softens prices + rents 12–24 months out; constrained supply supports both.
Investment metrics
- 1% rule
- 0.80% ✗
- Cap rate
- 5.99%
- Cash-on-cash
- -1.09%
- DSCR
- 0.95
- GRM
- 10.4
CMA / ARV
- ARV (median comp)
- $184,125
- List price
- $229,900
- Delta
- 24.86%
- Verdict
- OVERPRICED
- Comps
- 20 within 1.0 mi
Show comp detail 12 sales within ~0.75 mi
| Address | Dist | Beds/Ba | Sqft | Sold | Price | $/sf | Match |
|---|---|---|---|---|---|---|---|
| 3001 Highland Rd | 0.00mi | 3/1.0 (+1) | 1,139 (0%) | 0mo | $240,000 | $211 | 95 |
| 3025 Berkley Rd | 0.08mi | 3/2.0 (+1) | 1,206 (+6%) | 5mo | $175,000 | $145 | 74 |
| 2511 W 32nd St | 0.15mi | 3/1.0 (+1) | 1,075 (-6%) | 9mo | $205,000 | $191 | 71 |
| 2408 W 36th St | 0.34mi | 3/1.5 (+1) | 1,114 (-2%) | 3mo | $279,900 | $251 | 71 |
| 2346 W 29th St | 0.15mi | 3/1.0 (+1) | 1,042 (-8%) | 9mo | $147,500 | $142 | 66 |
| 3723 Court Ave | 0.54mi | 3/1.0 (+1) | 1,162 (+2%) | 6mo | $85,000 | $73 | 61 |
| 2114 Canton Ave | 0.61mi | 3/1.0 (+1) | 1,104 (-3%) | 1mo | $153,000 | $139 | 60 |
| 2653 W 25th St | 0.40mi | 3/1.0 (+1) | 1,253 (+10%) | 4mo | $170,000 | $136 | 56 |
| 2918 Hudson Rd | 0.75mi | 3/1.0 (+1) | 1,199 (+5%) | 2mo | $162,900 | $136 | 50 |
| 2936 Rudolph Ave | 0.61mi | 2/1.5 | 996 (-13%) | 1mo | $191,500 | $192 | 48 |
| 2845 W 31st St | 0.46mi | 3/2.0 (+1) | 1,304 (+14%) | 1mo | $219,900 | $169 | 44 |
| 3510 Stough Ave | 0.67mi | 3/2.5 (+1) | 1,260 (+11%) | 9mo | $100,000 | $79 | 32 |
Match score weights: distance 35% · size 25% · config 20% · recency 20%. Top-matched comps best support the ARV.
Projected returns pro-forma
-3.0% appreciation · 3.0% rent growth · sell at horizon
- IRR
- -18.1%
- Equity multiple
- 0.36×
- Total profit
- $-41,001
- Equity at exit
- $34,279
- IRR
- -10.4%
- Equity multiple
- 0.37×
- Total profit
- $-40,579
- Equity at exit
- $19,878
Cash invested: $64,372 (down + closing). Projections, not guarantees.
Landlord ↔ Tenant lean methodology
- Overall (STATE)
- 62 Landlord-Friendly
- State Pennsylvania
- 62 Landlord-Friendly · EVEN
- County
- — inherits STATE
- City
- — inherits STATE
ZIP-level market 16506
- Active inventory
- 96
- Price-to-rent
- 10.4×
Monthly cashflow live
- Estimated rent
- $1,841 high interval (Pro) →
- Mortgage (P&I)
- −$1,206
- Tax from tax record
- −$212 /mo · $2,543/yr
- Insurance
- −$96
- HOA
- −$0
- Vacancy / Maint / Mgmt
- −$387
- Net cashflow
- $-59
Break-even live
UW: 25.0% down · 7.5% · 30yr · 1.5% tax · 5.0% vac · 8.0% maint · 8.0% mgmt
Financing live
Cash to close
- Down payment
- $57,475
- Closing costs
- $6,897
- Reserves months
- —
- Total cash needed
- —
Loan-product check · same deal, 3 products live
Conventional
25% down · 7.5% · 30yr
- Down + closing
- —
- Monthly P&I
- —
- Monthly cashflow
- —
- DSCR
- —
- Eligible?
- —
Personal DTI + credit; lowest rate.
DSCR
20% down · 8.5% · 30yr
- Down + closing
- —
- Monthly P&I
- —
- Monthly cashflow
- —
- DSCR
- —
- Eligible?
- —
No personal income docs; deal must DSCR.
Hard money
10% down · 12.0% · 12mo
- Down + closing
- —
- Monthly P&I
- —
- Monthly cashflow
- —
- DSCR
- —
- Eligible?
- —
Short-term bridge; refi at stabilization.
Rent comps 8 comps
| Address | Beds | Baths | Sqft | Rent | $/sqft | DOM | Units | Dist |
|---|---|---|---|---|---|---|---|---|
| 2857 Willowood Dr Unit 2901 Erie, PA | 2.0 | 1.5 | 1300 | $1,750 | $1.35 | 44d | 1 | 0.60mi |
| 4500 Hammocks Dr Erie, PA | 2.0–3.0 | 2.0 | 1312 | $1,945 | $1.48 | 44d | 7 | 0.94mi |
| 4536 Hammocks Dr Unit 536404 Erie, PA | 3.0 | 2.0 | 1416 | $2,290 | $1.62 | 44d | 1 | 0.97mi |
| 4536 Hammocks Dr Unit 542401 Erie, PA | 2.0 | 2.0 | 1327 | $2,160 | $1.63 | 44d | 1 | 0.97mi |
| 4536 Hammocks Dr Unit 536204 Erie, PA | 3.0 | 2.0 | 1416 | $2,275 | $1.61 | 44d | 1 | 0.97mi |
| 4024 Canterbury Dr Erie, PA | 2.0 | 1.5 | 1044 | $1,350 | $1.29 | 44d | 1 | 1.00mi |
| 3158 W 40th St Erie, PA | 2.0 | 2.0 | 1024 | $1,280 | $1.25 | 44d | 1 | 1.05mi |
| 2540 W 8th St Erie, PA | 1.0–2.0 | 1.0–2.0 | 550 | $1,711 | $3.11 | 44d | 1 | 1.49mi |
Listing history 5 events
-
2026-05-02status Pending 675-char remark
-
2026-04-29$229,900 Active 675-char remark
-
2020-03-13soldstatus $144,000
-
2019-07-26soldstatus $85,000
-
1977-09-29soldstatus $33,900
ⓘ Source: listings_history table (triggers on properties + properties_extension) + one-shot
backfill from property_details.listing_events for pre-trigger history.
Tax reassessment forecast PA · Partial reset (capped growth)
- Current annual tax
- $2,543 · $212/mo
- Projected year-2 tax
- $3,088 · $257/mo
- Expected delta
- +$545/yr (+$45/mo · 21.4%)
ⓘ Screening estimate from a state-policy table — verify with the county assessor before closing.
Climate risk First Street
- Flood 1/10 Low FEMA zone X (unshaded) · 0% chance over 30 yrs
- Wildfire 1/10 Low
- Heat 2/10 Low 7 d/yr ≥90°F today · 17 d/yr by 30 yrs out
- Wind 1/10 Low
- Air quality 2/10 Low 1 unhealthy d/yr today · 3 by 30 yrs out
Nearby sold comps map
Loading sold comps map…
Walkable amenities ~0.75 mi
Loading nearby amenities…
Taxation est. · year 1
- Rental income
- $22,098
- − Mortgage interest
- −$12,878
- − Property taxes
- −$2,543
- − Insurance
- −$1,150
- − Repairs & maintenance
- −$1,768
- − Management
- −$1,768
- − Depreciation
- −$6,688
- Taxable loss
- −$4,696
- Est. tax savings @ 24.0%
- +$1,127
- After-tax cash flow
- $425/yr
For passive investors: Depreciation is non-cash, so a rental often shows a tax loss while cash-flowing — sheltering income. Rental losses are passive: they offset passive income freely, and up to $25,000/yr can offset ordinary (W-2) income if you actively participate and your MAGI is under $100k (phasing out to $0 by $150k); unused losses carry forward. On sale, claimed depreciation is recaptured at up to 25%, and gains may owe capital-gains tax (a 1031 exchange can defer both). Figures are a year-1 estimate at your 24.0% rate — not tax advice; consult a CPA.
Schools (NCES district)
- District
- Millcreek Township SD
- NCES district ID
- 4215330
- Math proficiency
- 46% ▼ -13.00%
- Reading proficiency
- 65% ▼ -9.00%
- Median HH income
- $55,734
- Composite
- 47.82/100
- National rank
- #2224
- State rank
- #105 of 539 in PA
Livability — Erie
- Score
- 83/100
- State rank
- #109
- US rank
- #840
Category grades
Schools grade is shown separately in the Schools card above.
Census & demographics
- County
- Erie County · 92,215 people
- City population
- 92,215
- Metro
- Erie, PA
- Population (ZIP)
- 24,070
- Household income
- $81,060
- Rent vs Own
- Severe rent burden
- 894.0
Population outlook (Erie County) Hauer SSP2
- Today (2025)
- 272,159 people
- By 2030
- 266,299 · -2.2%
- By 2040
- 250,987 · -7.8%
- By 2050
- 234,925 · -13.7%
- By 2075
- 199,164 · -26.8%
- By 2100
- 162,985 · -40.1%
Race, ethnicity, and origin ACS 2023
- Neighborhood character
- Predominantly White (88%)
- Race & ethnicity
- White 88% Two or more races 5% Asian 4% Black 2% Hispanic / Latino 2%
- Common ancestry
- Romanian 11% Italian 2% Lithuanian 1%
- Foreign-born
- 5% · Canada, China
- Languages at home
- 93% English-only · Other Indo-European 2% Spanish 1% Russian/Polish/Slavic 1%
Political lean MEDSL · Erie
- 2024 margin
- Toss-up / Even · D 49.0% · R 50.0%
- 2008→2024 swing
- -20.9pp toward R · 2008: 19.9pp · 2024: -1.0pp
- All cycles
- 2024: R+1.0 2020: D+1.0 2016: R+2.0 2012: D+16.9 2008: D+19.9
Not yet ingested
- Civics
- —
Market trends
- HPI YoY
- ▼ -152.21%
- Current HPI
- 228.7506
- Rent YoY
- —
- Metro
- Erie, PA
- State GDP YoY
- ▲ 1.68%
- F500 in state
- 34
Industry mix (Fortune 500 HQ in PA)
| Industry | F500 HQs | Revenue |
|---|---|---|
| Healthcare | 2 | $309B |
|
||
| Insurance | 2 | $27B |
|
||
| Telecommunications / Media | 1 | $124B |
|
||
| Industrial Distribution | 1 | $22B |
|
||
| Financial Services | 1 | $20B |
|
||
| Chemicals / Materials | 1 | $18B |
|
||
Price history
+608.0% since first listed6 events — show timeline
- 2026-06-05 Sold (MLS) $240,000 GEBOR
- 2026-05-02 Pending — GEBOR
- 2026-04-29 Listed $229,900 GEBOR
- 2020-03-13 Sold (Public Records) $144,000 Public Records
- 2019-07-26 Sold (Public Records) $85,000 Public Records
- 1977-09-29 Sold (Public Records) $33,900 Public Records
Property tax history
+2.5%/yrLatest (2026): $2,543 · +3.6% YoY. Source: county tax records.
Cash-flow waterfall
monthlySold comps — $/sqft
last 12 mo · ≤1 miLoading sold comps…