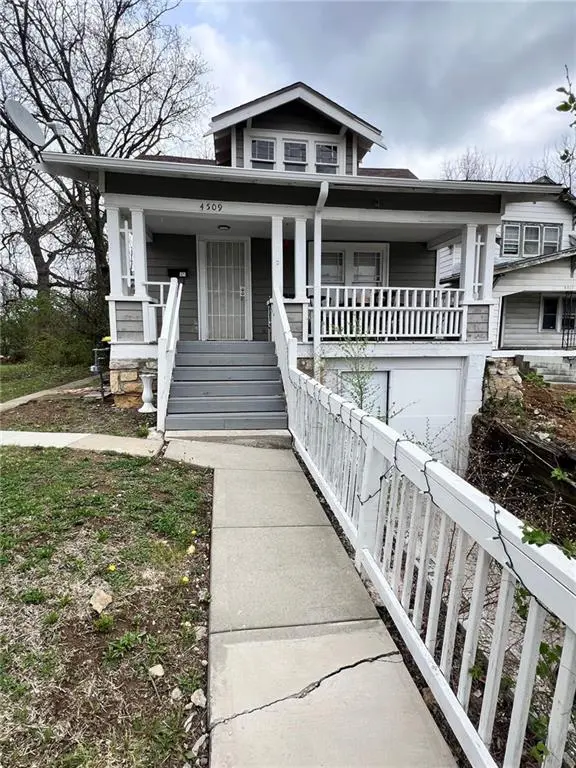
4509 Benton Blvd · Kansas City, MO
Flood risk 1/10 · Minimal
- FEMA flood zone
- X (unshaded)
- Chance of flooding over 30 yrs
- 0.0%
- Est. flood insurance / yr
- $473 – $860
Fire risk 1/10 · Minimal
- Est. fire insurance / yr
- $1,054 – $1,958
Heat risk 4/10 · Minor
- Hot days now (above 107°F)
- 7 days/yr
- Hot days in 30 yrs
- 16 days/yr
Wind risk 2/10 · Minimal
- Chance of severe wind over 30 yrs
- —
Air-quality risk 3/10 · Minor
- Unhealthy air days now
- 3 days/yr
- Unhealthy air days in 30 yrs
- 5 days/yr
Risk factors via First Street. Map © Google.
Why this score? — see what drove the D+ grade
The composite is a weighted blend of 9 inputs, each scored 0–100. Each bar is that input's sub-score; the figure is the points it added to the 100-point composite (weight × sub-score).
- Cash flow +19.4/30.0
- Appreciation +10.0/10.0
- DSCR +6.1/10.0
- Livability +3.9/5.0
- 1% rule +3.8/10.0
- Rent growth +2.5/5.0
- Condition / age +2.5/5.0
- Schools +1.5/10.0
- ARV discount +0.0/15.0
$140,000
🖨 Deal sheet 📄 Offer letter ✓ Due diligence
Listing remarks
Beautifully updated 3-bedroom, 2-bath home offering modern finishes and immediate income potential! Currently tenant occupied, this property is a great opportunity for investors looking to add a cash-flowing asset to their portfolio from day one. The home features an inviting layout with abundant natural light, updated bathrooms, and a stylish kitchen complete with granite countertops, sleek cabinetry, and plenty of storage. The spacious living area includes a charming faux fireplace, creating a warm and comfortable atmosphere perfect for everyday living. Conveniently located just minutes from Downtown Kansas City, the KC Zoo, shopping, dining, and major highway access. Whether you are look
Key facts
- Stylish kitchen
- Natural light
- Major highway access
Tags
Property features AI
Finance
- Other: Located out of flood plain; Living area reported as 1,512; Above-grade finished area reported as 861 (public records); Below-grade finished area reported as 651 (public records); Property age: 101 years or more
- HOA & community: No association fees
Exterior
- Parking: Other parking
- Utilities: Public water; Public sewer
- Home design: Single-family residence; Residential property; 1.5-story floor plan; Facing direction not specified
- Construction: Wood siding; Composition roof
- Exterior features: Porch; Property listed as fixer / fixer up
Interior
- Bedrooms: 3 bedrooms (one bedroom on the first floor)
- Flooring: Wood
- Bathrooms: 1 full bathroom
- Heating & cooling: Forced air heating; No central air
- Interior features: Wood flooring; Wood-burning fireplace in the family room; Basement with stone/rock finish
Neighborhood map
What this means for you Summary
Snapshot
- This is a 3-bed/1.0-bath single-family listed at $140k.
Deal economics
- At list price, monthly cash flow is $156 ($2k/yr) — positive.
- The deal already cash-flows at list — no discount required.
- To meet the 1% rule (rent ≥ 1% of price), the offer needs to be $124k (11.7% below list).
- Recommended offer: $124k (11.7% below list) — sets the bar for 1% rule.
- Cap rate 7.6% vs local median 3.9% in Kansas City — top-decile yield for the area; either an underpriced asset or a hidden risk that comps aren't pricing in. Stress-test before assuming the spread holds.
Location & tenants
- Location reads 78/100 on livability (#28 in MO, #2,671 nationally) — a middle-class / working-renter tenant base. Strengths: amenities A+, commute A+, cost of living A+; Watch: schools C-, crime F.
- Kansas City 33 (urban): math 12% / reading 24% proficiency, ranked #308 of 324 in MO (top 95%) — low school quality limits family demand, transient renter base, plan for 1-2y turnover; 75% free/reduced lunch — lower-income household profile, screen leases tightly.
- Market conditions: 21 active listings in the ZIP; 34 comparable units currently listed for rent nearby; rentals at typical pace (median 17d on market — plan ~3-4 weeks tenant-placement turnaround); 4,002 units permitted in Jackson County in 2024 (2,271 in 5+ unit buildings).
Forward outlook
- In year one you build about $15k of equity ($968 loan paydown + $14k appreciation (10.0% local appreciation)).
- Jackson County population projected at +4% by 2050 — modest demand growth; plan on rents tracking national, not racing it.
- At projected returns (10.0% appreciation + 3.0% rent growth), your $39k cash investment doubles in ~3 years — after that, you're playing with house money.
- By year 3, paydown + projected appreciation supports a ~$38k cash-out refi (75% LTV) — recoverable capital for the next deal without selling this one.
Negotiation context
- It's been on market 37 days — a 3% lower offer ($136k) is reasonable based on typical stale-listing flexibility.
- 4 sale attempts since 4y ago with the ask held roughly flat each time — persistent listings suggest the price (not the market) is what's stuck; bring a comps-based counter.
Risks & watch-outs
- Watch-outs: built in 1923 — expect roof / HVAC / electrical / plumbing capex.
Questions for the listing agent
- It's been on market 37 days. Have you received any prior offers? Is the seller open to a 12% concession, seller financing, or rate buy-down credit?
- Built in 1923 — when were the roof, HVAC, electrical panel, plumbing, and water heater last replaced?
- Is there a deadline driving the sale (1031 exchange, divorce, estate, relocation)? That informs how much negotiation room exists.
- Crime grade is F in this area — have there been break-ins, vandalism, or insurance claims at this property in the last 3 years? What carrier currently insures it and at what premium?
- The area grade is low — what's the realistic commute time and amenity access for the typical tenant pool here? Any planned neighborhood developments (good or bad) we should know about?
- What's the average days-on-market for RENTAL listings here right now (not sales)? A rising rental-DOM trend means longer vacancies and softer asking-rent achievability than the comps imply.
- What's the recent tenant-quality profile in this submarket — average credit score on applications, eviction rate, late-payment / NSF rate, and stable-employment percentage? A property-management company in the area should have these aggregated.
- How much new for-sale + rental construction is in the pipeline within 1–3 miles? Heavy new supply typically softens prices + rents 12–24 months out; constrained supply supports both.
Investment metrics
- 1% rule
- 0.88% ✗
- Cap rate
- 7.63%
- Cash-on-cash
- 4.77%
- DSCR
- 1.21
- GRM
- 9.4
CMA / ARV
- ARV (median comp)
- $119,701
- List price
- $140,000
- Delta
- 16.96%
- Verdict
- OVERPRICED
- Comps
- 20 within 1.0 mi
Show comp detail 12 sales within ~0.75 mi
| Address | Dist | Beds/Ba | Sqft | Sold | Price | $/sf | Match |
|---|---|---|---|---|---|---|---|
| 4214 Monroe Ave | 0.44mi | 2/1.0 (-1) | 858 (-0%) | 7mo | $50,000 | $58 | 68 |
| 4410 Myrtle Ave | 0.44mi | 3/1.0 | 912 (+6%) | 4mo | $80,000 | $88 | 66 |
| 4909 S Benton Ave | 0.54mi | 2/1.0 (-1) | 821 (-5%) | 5mo | $75,000 | $91 | 58 |
| 4016 Askew Ave | 0.63mi | 3/1.0 | 899 (+4%) | 6mo | $80,000 | $89 | 58 |
| 4327 Mersington Ave | 0.44mi | 2/1.0 (-1) | 940 (+9%) | 4mo | $50,000 | $53 | 56 |
| 4338 Myrtle Ave | 0.46mi | 2/1.0 (-1) | 780 (-9%) | 3mo | $125,000 | $160 | 55 |
| 4824 Agnes Ave | 0.49mi | 2/1.0 (-1) | 792 (-8%) | 4mo | $79,000 | $100 | 55 |
| 4218 Cleveland Ave | 0.47mi | 2/1.0 (-1) | 780 (-9%) | 6mo | $110,000 | $141 | 52 |
| 5030 Walrond Ave | 0.67mi | 2/1.0 (-1) | 770 (-11%) | 2mo | $64,900 | $84 | 45 |
| 3935 E 47th Ter | 0.57mi | 3/2.0 | 960 (+12%) | 13mo | $179,900 | $187 | 40 |
| 4738 Norton Cir | 0.58mi | 2/1.5 (-1) | 960 (+12%) | 10mo | $104,900 | $109 | 38 |
| 5000 Agnes Ave | 0.63mi | 2/1.0 (-1) | 969 (+12%) | 10mo | $80,000 | $83 | 36 |
Match score weights: distance 35% · size 25% · config 20% · recency 20%. Top-matched comps best support the ARV.
Projected returns pro-forma
10.0% appreciation · 3.0% rent growth · sell at horizon
- IRR
- 27.7%
- Equity multiple
- 3.20×
- Total profit
- $86,093
- Equity at exit
- $126,123
- IRR
- 24.2%
- Equity multiple
- 7.27×
- Total profit
- $245,589
- Equity at exit
- $271,989
Cash invested: $39,200 (down + closing). Projections, not guarantees.
Landlord ↔ Tenant lean methodology
- Overall (STATE)
- 81 Strongly Landlord-Friendly
- State Missouri
- 81 Strongly Landlord-Friendly · R+10
- County
- — inherits STATE
- City
- — inherits STATE
ZIP-level market 64126
- Active inventory
- 21
- Price-to-rent
- 9.4×
Monthly cashflow live
- Estimated rent
- $1,236 high interval (Pro) →
- Mortgage (P&I)
- −$734
- Tax from tax record
- −$28 /mo · $337/yr
- Insurance
- −$58
- HOA
- −$0
- Vacancy / Maint / Mgmt
- −$260
- Net cashflow
- $156
Break-even live
UW: 25.0% down · 7.5% · 30yr · 1.5% tax · 5.0% vac · 8.0% maint · 8.0% mgmt
Financing live
Cash to close
- Down payment
- $35,000
- Closing costs
- $4,200
- Reserves months
- —
- Total cash needed
- —
Loan-product check · same deal, 3 products live
Conventional
25% down · 7.5% · 30yr
- Down + closing
- —
- Monthly P&I
- —
- Monthly cashflow
- —
- DSCR
- —
- Eligible?
- —
Personal DTI + credit; lowest rate.
DSCR
20% down · 8.5% · 30yr
- Down + closing
- —
- Monthly P&I
- —
- Monthly cashflow
- —
- DSCR
- —
- Eligible?
- —
No personal income docs; deal must DSCR.
Hard money
10% down · 12.0% · 12mo
- Down + closing
- —
- Monthly P&I
- —
- Monthly cashflow
- —
- DSCR
- —
- Eligible?
- —
Short-term bridge; refi at stabilization.
Rent comps 34 comps
| Address | Beds | Baths | Sqft | Rent | $/sqft | DOM | Units | Dist |
|---|---|---|---|---|---|---|---|---|
| 4427 Agnes Ave Kansas City, MO | 3.0 | 1.0 | 1100 | $1,350 | $1.23 | 16d | 1 | 0.19mi |
| 4309 College Ave Kansas City, MO | 3.0 | 2.0 | 1040 | $1,550 | $1.49 | 16d | 1 | 0.25mi |
| 4534 S Benton Ave Kansas City, MO | 2.0 | 1.0 | 912 | $1,045 | $1.15 | 16d | 1 | 0.29mi |
| 4144 College Ave Kansas City, MO | 3.0 | 1.0 | 1108 | $1,095 | $0.99 | 23d | 1 | 0.41mi |
| 4216 Cleveland Ave Kansas City, MO | 2.0 | 1.0 | 780 | $1,125 | $1.44 | 16d | 1 | 0.46mi |
| 4911 S Benton Ave Kansas City, MO | 2.0 | 1.0 | 1000 | $1,100 | $1.10 | 17d | 1 | 0.57mi |
| 4917 S Benton Ave Kansas City, MO | 2.0 | 1.0 | 1000 | $1,100 | $1.10 | 23d | 1 | 0.58mi |
| 4005 Bales Ave Kansas City, MO | 2.0 | 1.0 | 792 | $1,050 | $1.33 | 43d | 1 | 0.64mi |
| 5013 S Benton Ave Kansas City, MO | 3.0 | 1.0 | 978 | $1,225 | $1.25 | 23d | 1 | 0.68mi |
| 4028 Myrtle Ave Kansas City, MO | 3.0 | 1.0 | 1100 | $1,490 | $1.35 | 43d | 1 | 0.70mi |
| 3017 E 51st St Kansas City, MO | 2.0 | 1.0 | 621 | $1,303 | $2.10 | 7d | 1 | 0.75mi |
| 3949 Doctor Martin Luther King Junior Blvd Kansas City, MO | 1.0–2.0 | 1.0–2.0 | 945 | $1,565 | $1.66 | 2d | 3 | 0.76mi |
| 2305 E 41st St Kansas City, MO | 2.0 | 1.0 | 750 | $1,000 | $1.33 | 7d | 1 | 0.80mi |
| 4930 Park Ave Kansas City, MO | 3.0 | 1.0 | 900 | $1,300 | $1.44 | 16d | 1 | 0.85mi |
| 3315 E 52nd St Kansas City, MO | 2.0 | 1.0 | 662 | $1,125 | $1.70 | 23d | 1 | 0.87mi |
| 3841 Olive St Kansas City, MO | 2.0 | 1.0 | 792 | $985 | $1.24 | 14d | 1 | 0.97mi |
| 5114 Brooklyn Ave Kansas City, MO | 3.0 | 1.5 | 1116 | $1,300 | $1.16 | 7d | 1 | 1.04mi |
| 4401 Wayne Ave Kansas City, MO | 2.0 | 1.5 | 955 | $1,300 | $1.36 | 23d | 1 | 1.06mi |
| 1500 E 46th St Kansas City, MO | 1.0–3.0 | 1.0 | 803 | $1,275 | $1.59 | 43d | 1 | 1.12mi |
| 3710 Wabash Ave Unit 2S Kansas City, MO | 2.0 | 1.0 | 875 | $850 | $0.97 | 23d | 1 | 1.14mi |
| 3736 Cypress Ave Kansas City, MO | 3.0 | 1.0 | 1100 | $1,200 | $1.09 | 7d | 1 | 1.18mi |
| 4209 Flora Ave Kansas City, MO | 2.0 | 1.0 | 778 | $1,200 | $1.54 | 16d | 1 | 1.18mi |
| 4206 Vineyard Rd Kansas City, MO | 4.0 | 1.5 | 1056 | $1,500 | $1.42 | 14d | 1 | 1.20mi |
| 4902 E 39th St Kansas City, MO | 2.0 | 1.0 | 820 | $1,300 | $1.59 | 16d | 1 | 1.31mi |
| 1214 Brush Creek Blvd Unit 03 Kansas City, MO | 2.0 | 1.0 | 950 | $1,050 | $1.11 | 17d | 1 | 1.33mi |
| 5614 Indiana Ave Kansas City, MO | 3.0 | 1.0 | 900 | $1,175 | $1.31 | 43d | 1 | 1.39mi |
| 5410 Euclid Ave Kansas City, MO | 3.0 | 2.0 | 1119 | $1,395 | $1.25 | 43d | 1 | 1.40mi |
| 4925 Tracy Ave Unit 1 Kansas City, MO | 2.0 | 1.0 | 1000 | $1,400 | $1.40 | 43d | 1 | 1.41mi |
| 3437 Jackson Ave Kansas City, MO | 2.0 | 1.0 | 700 | $1,150 | $1.64 | 16d | 1 | 1.42mi |
| 4119 Forest Ave Kansas City, MO | 2.0 | 1.0 | 950 | $1,400 | $1.47 | 12d | 1 | 1.44mi |
| 3330 Agnes Ave Kansas City, MO | 3.0 | 1.0 | 1000 | $1,410 | $1.41 | 43d | 1 | 1.46mi |
| 5332 Highland Ave Kansas City, MO | 3.0 | 1.0 | 1022 | $1,350 | $1.32 | 7d | 1 | 1.47mi |
| 3310 College Ave Kansas City, MO | 3.0 | 1.0 | 874 | $995 | $1.14 | 43d | 1 | 1.48mi |
| 3600 E 57th St Kansas City, MO | 3.0 | 1.0 | 1037 | $1,250 | $1.21 | 43d | 1 | 1.49mi |
Listing history 27 events
-
2026-06-18days on market $140,000 Active 37 DOM
-
2026-06-17days on market $140,000 Active 36 DOM
-
2026-06-16days on market $140,000 Active 35 DOM
-
2026-06-15days on market $140,000 Active 34 DOM
-
2026-06-13days on market $140,000 Active 32 DOM
-
2026-06-09days on market $140,000 Active 28 DOM
-
2026-06-08days on market $140,000 Active 27 DOM
-
2026-06-07days on market $140,000 Active 26 DOM
-
2026-06-05days on market $140,000 Active 23 DOM
-
2026-06-03days on market $140,000 Active 22 DOM
-
2026-06-02days on market $140,000 Active 21 DOM
-
2026-06-01days on market $140,000 Active 20 DOM
-
2026-05-31days on market $140,000 Active 19 DOM
-
2026-05-12$140,000 Active 833-char remark
-
2023-09-21soldstatus
-
2023-06-09soldstatus
-
2022-11-18historical
-
2022-08-22price $52,000
-
2022-08-20status Active
-
2022-08-18status Pending
-
2022-08-03status Active
-
2022-08-01status Pending
-
2022-07-29$60,000 Active
-
2022-02-02soldstatus
-
2020-08-14soldstatus
-
2019-08-12soldstatus
-
1990-05-07soldstatus
ⓘ Source: listings_history table (triggers on properties + properties_extension) + one-shot
backfill from property_details.listing_events for pre-trigger history.
Tax reassessment forecast MO · Resets to sale price
- Current annual tax
- $337 · $28/mo
- Projected year-2 tax
- $1,358 · $113/mo
- Expected delta
- +$1,021/yr (+$85/mo · 302.6%)
ⓘ Screening estimate from a state-policy table — verify with the county assessor before closing.
Climate risk First Street
- Flood 1/10 Low FEMA zone X (unshaded) · 0% chance over 30 yrs
- Wildfire 1/10 Low
- Heat 4/10 Moderate 7 d/yr ≥107°F today · 16 d/yr by 30 yrs out
- Wind 2/10 Low
- Air quality 3/10 Moderate 3 unhealthy d/yr today · 5 by 30 yrs out
Nearby sold comps map
Loading sold comps map…
Walkable amenities ~0.75 mi
Loading nearby amenities…
Taxation est. · year 1
- Rental income
- $14,830
- − Mortgage interest
- −$7,842
- − Property taxes
- −$337
- − Insurance
- −$700
- − Repairs & maintenance
- −$1,186
- − Management
- −$1,186
- − Depreciation
- −$4,073
- Taxable loss
- −$495
- Est. tax savings @ 24.0%
- +$119
- After-tax cash flow
- $1,987/yr
For passive investors: Depreciation is non-cash, so a rental often shows a tax loss while cash-flowing — sheltering income. Rental losses are passive: they offset passive income freely, and up to $25,000/yr can offset ordinary (W-2) income if you actively participate and your MAGI is under $100k (phasing out to $0 by $150k); unused losses carry forward. On sale, claimed depreciation is recaptured at up to 25%, and gains may owe capital-gains tax (a 1031 exchange can defer both). Figures are a year-1 estimate at your 24.0% rate — not tax advice; consult a CPA.
Schools (NCES district)
- District
- Kansas City 33
- NCES district ID
- 2916400
- Math proficiency
- 12% ▼ -8.00%
- Reading proficiency
- 24% ▬ 0.00%
- Median HH income
- $35,227
- Composite
- 14.8/100
- National rank
- #9387
- State rank
- #308 of 324 in MO
Livability — Kansas City
- Score
- 78/100
- State rank
- #28
- US rank
- #2671
Category grades
Schools grade is shown separately in the Schools card above.
Census & demographics
- Census place
- Kansas City, MO
- City population
- 439,467
- Population (ZIP)
- 6,433
Population outlook (Jackson County) Hauer SSP2
- Today (2025)
- 719,589 people
- By 2030
- 731,456 · +1.6%
- By 2040
- 746,689 · +3.8%
- By 2050
- 749,289 · +4.1%
- By 2075
- 736,227 · +2.3%
- By 2100
- 668,210 · -7.1%
Race, ethnicity, and origin ACS 2023
- Neighborhood character
- Diverse neighborhood (Simpson 0.62)
- Race & ethnicity
- Hispanic / Latino 57% Two or more races 29% White 19% Black 14% Asian 3% Native American 2%
- Hispanic origin (detail)
- Mexican 38% Cuban 4%
- Common ancestry
- Slovak 2% Iranian 1% Lithuanian 1%
- Foreign-born
- 36% · Canada
- Languages at home
- 44% English-only · Spanish 50% Vietnamese 1%
Political lean MEDSL · Jackson
- 2024 margin
- D (+19.3) · D 58.9% · R 39.5% · Other 1.6%
- 2008→2024 swing
- -6.1pp toward R · 2008: 25.4pp · 2024: 19.3pp
- All cycles
- 2024: D+19.3 2020: D+22.0 2016: D+16.6 2012: D+19.0 2008: D+25.4
Not yet ingested
- Civics
- —
Market trends
- HPI YoY
- ▲ 100.10%
- Current HPI
- 369.8782
- Rent YoY
- —
- Metro
- —
- State GDP YoY
- ▲ 1.84%
- F500 in state
- 20
Industry mix (Fortune 500 HQ in MO)
| Industry | F500 HQs | Revenue |
|---|---|---|
| Healthcare | 1 | $163B |
|
||
| Insurance | 1 | $21B |
|
||
| Industrial Technology | 1 | $17B |
|
||
| Retail | 1 | $16B |
|
||
| Industrial Distribution | 1 | $10B |
|
||
| Utilities | 1 | $9B |
|
||
Price history
+133.3% since first listed14 events — show timeline
- 2026-05-12 Listed $140,000 Heartland MLS as Distributed by MLS Grid
- 2023-09-21 Sold (Public Records) — Public Records
- 2023-06-09 Sold (Public Records) — Public Records
- 2022-11-18 Listing Removed — Heartland MLS as Distributed by MLS Grid
- 2022-08-22 Price Changed $52,000 Heartland MLS as Distributed by MLS Grid
- 2022-08-20 Relisted — Heartland MLS as Distributed by MLS Grid
- 2022-08-18 Pending — Heartland MLS as Distributed by MLS Grid
- 2022-08-03 Relisted — Heartland MLS as Distributed by MLS Grid
- 2022-08-01 Pending — Heartland MLS as Distributed by MLS Grid
- 2022-07-29 Listed $60,000 Heartland MLS as Distributed by MLS Grid
- 2022-02-02 Sold (Public Records) — Public Records
- 2020-08-14 Sold (Public Records) — Public Records
- 2019-08-12 Sold (Public Records) — Public Records
- 1990-05-07 Sold (Public Records) — Public Records
Property tax history
+3.6%/yrLatest (2025): $337 · -37.3% YoY. Source: county tax records.
Cash-flow waterfall
monthlySold comps — $/sqft
last 12 mo · ≤1 miLoading sold comps…