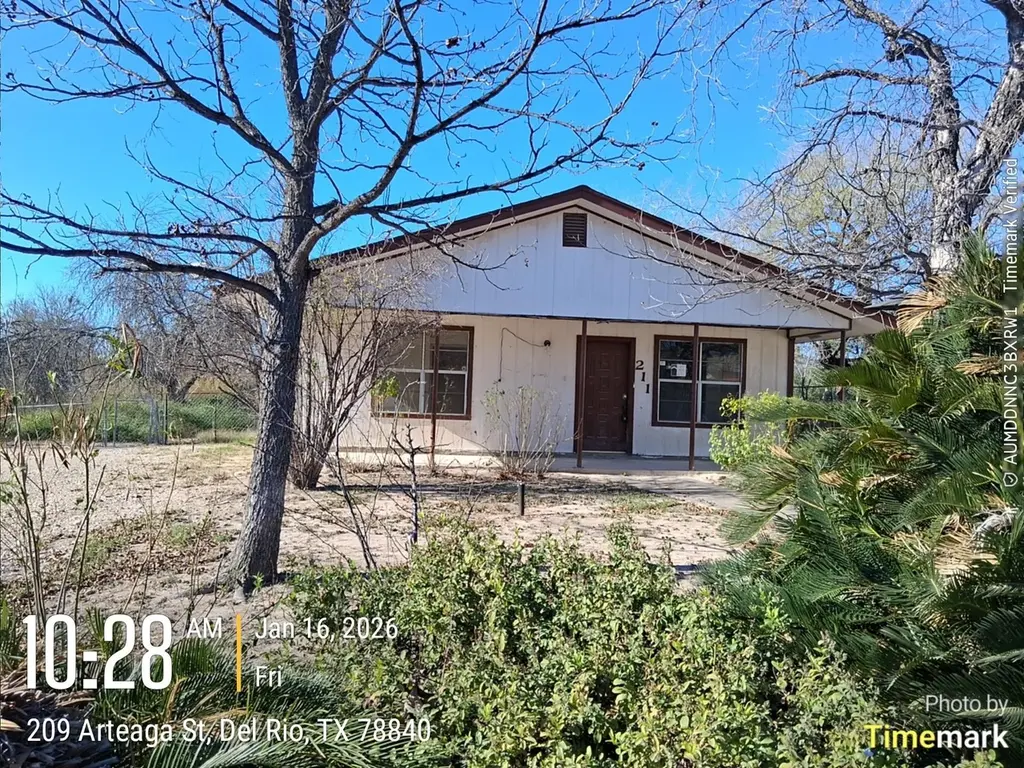
211 Arteaga St · Del Rio, TX
Flood risk 1/10 · Minimal
- FEMA flood zone
- X (unshaded)
- Chance of flooding over 30 yrs
- 0.0%
- Est. flood insurance / yr
- $507 – $1,088
Fire risk 6/10 · Moderate
- Est. fire insurance / yr
- $1,222 – $2,270
Heat risk 8/10 · Major
- Hot days now (above 108°F)
- 7 days/yr
- Hot days in 30 yrs
- 23 days/yr
Wind risk 4/10 · Minor
- Chance of severe wind over 30 yrs
- 12.0%
Air-quality risk 1/10 · Minimal
- Unhealthy air days now
- 0 days/yr
- Unhealthy air days in 30 yrs
- 0 days/yr
Risk factors via First Street. Map © Google.
Why this score? — see what drove the B+ grade
The composite is a weighted blend of 9 inputs, each scored 0–100. Each bar is that input's sub-score; the figure is the points it added to the 100-point composite (weight × sub-score).
- Cash flow +30.0/30.0
- ARV discount +14.6/15.0
- 1% rule +10.0/10.0
- DSCR +10.0/10.0
- Livability +3.5/5.0
- Rent growth +2.9/5.0
- Condition / age +2.5/5.0
- Schools +2.4/10.0
- Appreciation +0.0/10.0
$135,000
🖨 Deal sheet (PDF) 📄 Offer letter ✓ Due diligence
Listing remarks MLS
- This property is eligible under the First Look Initiative. All Owner Occupant offers will be responded to after 7 days on the market and Investor offers will be responded to after 30 days. However, all offers can be submitted during the First Look period. - All offers must be entered through propoffers.com. - An offer management fee of $200 (plus sales tax, where applicable) is charged by Pyramid Platform in connection with the use of Propoffers.com. This fee will be paid at closing from the agent representing the buyer as selling agent or transaction broker. - Subject to seller addendum - For financed offers EMD to be 1% or $1000 whichever is greater and for cash/hardmoney offers EMD to be 5% or $5000 whichever is greater. EMD to be held by seller's title or attorney. - All offers are subject to OFAC clearance.
Key facts
- 3,485 sq ft lot
- Built 1980
- Listed 113 days
Neighborhood map
What this means for you Summary
Snapshot
- This is a 4-bed/1.0-bath single-family listed at $135k.
Deal economics
- At list price, monthly cash flow is $596 ($7k/yr) — positive.
- The deal already cash-flows at list — no discount required.
- Meets the 1% rule at list price ($2k rent vs $135k).
- Recommended offer: $123k (9.0% below list) — sets the bar for market timing.
Location & tenants
- Location reads 70/100 on livability (#349 in TX) — a middle-class / working-renter tenant base. Strengths: cost of living A+, housing A+, crime A-; Watch: health & safety C-, employment D+, amenities F.
- San Felipe-Del Rio CISD (town): math 25% / reading 32% proficiency, ranked #667 of 826 in TX (top 81%) — low school quality limits family demand, transient renter base, plan for 1-2y turnover; 70% free/reduced lunch — lower-income household profile, screen leases tightly.
- Zoned schools: Lamar El (math 23% / reading 24%, grade F, #3,247 of 4,322 statewide, top 76%, 436 students, 90% FRL); Del Rio Middle (math 26% / reading 43%, grade F, #858 of 1,662 statewide, top 54%, 1,478 students, 74% FRL); Del Rio H S (math 27% / reading 30%, grade F, #1,157 of 1,632 statewide, top 72%, 2,470 students, 65% FRL).
- Market conditions: Rents rising (+1.6%/yr); 549 active listings in the ZIP; 2 comparable units currently listed for rent nearby; 85 units permitted in Val Verde County in 2024 (0 in 5+ unit buildings).
- This rent runs 37% of the median local income ($66k/yr) — at the standard rent-burdened threshold; future hikes will face affordability resistance.
Forward outlook
- Local home prices are declining (-3.0%/yr); year-one equity from $933 of loan paydown is wiped out by about $4k of value loss. Plan a longer hold.
- Val Verde County population projected to shrink 9% by 2050 — rents likely to lag national; underwrite the cash flow, not the appreciation.
- At projected returns (-3.0% appreciation + 1.6% rent growth), your $38k cash investment doubles in ~8 years — after that, you're playing with house money.
Negotiation context
- It's been on market 114 days — a 9% lower offer ($123k) is reasonable based on typical stale-listing flexibility.
Risks & watch-outs
- Climate carrying-cost: major wildfire risk; extreme-heat days projected 7→23/yr by 2055 (HVAC capex compounding) — expect insurance premiums to compound above CPI over the hold.
Questions for the listing agent
- It's been on market 114 days. Have you received any prior offers? Is the seller open to a 9% concession, seller financing, or rate buy-down credit?
- Why hasn't it sold? Are there any deal-killer items the seller is aware of (foundation, flood, title, zoning, code violations)?
- Is there a deadline driving the sale (1031 exchange, divorce, estate, relocation)? That informs how much negotiation room exists.
- Schools are D-rated, which usually means shorter tenancies and higher turnover. Who's the typical renter profile here, and what's been the actual vacancy rate?
- What's the average days-on-market for RENTAL listings here right now (not sales)? A rising rental-DOM trend means longer vacancies and softer asking-rent achievability than the comps imply.
- What's the recent tenant-quality profile in this submarket — average credit score on applications, eviction rate, late-payment / NSF rate, and stable-employment percentage? A property-management company in the area should have these aggregated.
- How much new for-sale + rental construction is in the pipeline within 1–3 miles? Heavy new supply typically softens prices + rents 12–24 months out; constrained supply supports both.
Investment metrics
- 1% rule
- 1.50% ✓
- Cap rate
- 11.59%
- Cash-on-cash
- 18.91%
- DSCR
- 1.84
- GRM
- 5.6
CMA / ARV
- ARV (median comp)
- $160,378
- List price
- $135,000
- Delta
- -15.82%
- Verdict
- UNDERPRICED
- Comps
- 4 within 1.0 mi
Projected returns pro-forma
-3.0% appreciation · 1.55% rent growth · sell at horizon
- IRR
- 9.1%
- Equity multiple
- 1.35×
- Total profit
- $13,227
- Equity at exit
- $20,129
- IRR
- 17.0%
- Equity multiple
- 2.30×
- Total profit
- $49,077
- Equity at exit
- $11,672
Cash invested: $37,800 (down + closing). Projections, not guarantees.
Landlord ↔ Tenant lean methodology
- Overall (STATE)
- 87 Strongly Landlord-Friendly
- State Texas
- 87 Strongly Landlord-Friendly · R+5
- County
- — inherits STATE
- City
- — inherits STATE
ZIP-level market 78840
- Home prices YoY
- -33.6%
- Rents YoY
- 1.6%
- Active inventory
- 549
- Price-to-rent
- 5.6×
Monthly cashflow live
- Estimated rent
- $2,021 medium interval (Pro) →
- Mortgage (P&I)
- −$708
- Tax from tax record
- −$237 /mo · $2,841/yr
- Insurance
- −$56
- HOA
- −$0
- Vacancy / Maint / Mgmt
- −$424
- Net cashflow
- $596
Break-even live
Sensitivity live
| Price | -10% $672 | -5% $634 | +0% $596 | +5% $557 | +10% $519 |
|---|---|---|---|---|---|
| Rent | -10% $436 | -5% $516 | +0% $596 | +5% $675 | +10% $755 |
| Rate | -1.0pp $664 | -0.5pp $630 | base $596 | +0.5pp $561 | +1.0pp $525 |
UW: 25.0% down · 7.5% · 30yr · 1.5% tax · 5.0% vac · 8.0% maint · 8.0% mgmt
Financing live
Cash to close
- Down payment
- $33,750
- Closing costs
- $4,050
- Reserves months
- —
- Total cash needed
- —
Loan-product check · same deal, 3 products live
Conventional
25% down · 7.5% · 30yr
- Down + closing
- —
- Monthly P&I
- —
- Monthly cashflow
- —
- DSCR
- —
- Eligible?
- —
Personal DTI + credit; lowest rate.
DSCR
20% down · 8.5% · 30yr
- Down + closing
- —
- Monthly P&I
- —
- Monthly cashflow
- —
- DSCR
- —
- Eligible?
- —
No personal income docs; deal must DSCR.
Hard money
10% down · 12.0% · 12mo
- Down + closing
- —
- Monthly P&I
- —
- Monthly cashflow
- —
- DSCR
- —
- Eligible?
- —
Short-term bridge; refi at stabilization.
Rent comps 2 comps
| Address | Beds | Baths | Sqft | Rent | $/sqft | DOM | Units | Dist |
|---|---|---|---|---|---|---|---|---|
| 410 Pulliam St Del Rio, TX | 3.0 | 2.0 | 1700 | $1,800 | $1.06 | 45d | 1 | 0.56mi |
| 424 W Nicholson St Del Rio, TX | 3.0 | 2.0 | 1918 | $1,800 | $0.94 | 45d | 1 | 0.97mi |
Listing history 19 events
-
2026-06-19days on market $135,000 Active 114 DOM
-
2026-06-18days on market $135,000 Active 113 DOM
-
2026-06-17days on market $135,000 Active 112 DOM
-
2026-06-16days on market $135,000 Active 111 DOM
-
2026-06-15days on market $135,000 Active 110 DOM
-
2026-06-14days on market $135,000 Active 108 DOM
-
2026-06-12days on market $135,000 Active 107 DOM
-
2026-06-09days on market $135,000 Active 104 DOM
-
2026-06-08days on market $135,000 Active 103 DOM
-
2026-06-07days on market $135,000 Active 102 DOM
-
2026-06-05days on market $135,000 Active 99 DOM
-
2026-06-03days on market $135,000 Active 98 DOM
-
2026-06-02days on market $135,000 Active 97 DOM
-
2026-06-01days on market $135,000 Active 96 DOM
-
2026-05-31days on market $135,000 Active 95 DOM
-
2026-05-30days on market $135,000 Active 94 DOM
-
2026-05-11price $135,000 825-char remark
Show marketing remark (825 chars)
- This property is eligible under the First Look Initiative. All Owner Occupant offers will be responded to after 7 days on the market and Investor offers will be responded to after 30 days. However, all offers can be submitted during the First Look period. - All offers must be entered through propoffers.com. - An offer management fee of $200 (plus sales tax, where applicable) is charged by Pyramid Platform in connection with the use of Propoffers.com. This fee will be paid at closing from the agent representing the buyer as selling agent or transaction broker. - Subject to seller addendum - For financed offers EMD to be 1% or $1000 whichever is greater and for cash/hardmoney offers EMD to be 5% or $5000 whichever is greater. EMD to be held by seller's title or attorney. - All offers are subject to OFAC clearance.
-
2026-04-06price $145,000 825-char remark
Show marketing remark (825 chars)
- This property is eligible under the First Look Initiative. All Owner Occupant offers will be responded to after 7 days on the market and Investor offers will be responded to after 30 days. However, all offers can be submitted during the First Look period. - All offers must be entered through propoffers.com. - An offer management fee of $200 (plus sales tax, where applicable) is charged by Pyramid Platform in connection with the use of Propoffers.com. This fee will be paid at closing from the agent representing the buyer as selling agent or transaction broker. - Subject to seller addendum - For financed offers EMD to be 1% or $1000 whichever is greater and for cash/hardmoney offers EMD to be 5% or $5000 whichever is greater. EMD to be held by seller's title or attorney. - All offers are subject to OFAC clearance.
-
2026-02-24$155,000 Active 825-char remark
Show marketing remark (825 chars)
- This property is eligible under the First Look Initiative. All Owner Occupant offers will be responded to after 7 days on the market and Investor offers will be responded to after 30 days. However, all offers can be submitted during the First Look period. - All offers must be entered through propoffers.com. - An offer management fee of $200 (plus sales tax, where applicable) is charged by Pyramid Platform in connection with the use of Propoffers.com. This fee will be paid at closing from the agent representing the buyer as selling agent or transaction broker. - Subject to seller addendum - For financed offers EMD to be 1% or $1000 whichever is greater and for cash/hardmoney offers EMD to be 5% or $5000 whichever is greater. EMD to be held by seller's title or attorney. - All offers are subject to OFAC clearance.
ⓘ Source: listings_history table (triggers on properties + properties_extension) + one-shot
backfill from property_details.listing_events for pre-trigger history.
Tax reassessment forecast TX · Resets to sale price
- Current annual tax
- $2,841 · $237/mo
- Projected year-2 tax
- $2,841 · $237/mo
- Expected delta
- $0/yr ($0/mo · 0.0%)
ⓘ Screening estimate from a state-policy table — verify with the county assessor before closing.
Climate risk First Street
- Flood 1/10 Low FEMA zone X (unshaded) · 0% chance over 30 yrs
- Wildfire 6/10 Major
- Heat 8/10 Severe 7 d/yr ≥108°F today · 23 d/yr by 30 yrs out
- Wind 4/10 Moderate 12% chance of damaging wind over 30 yrs
- Air quality 1/10 Low 0 unhealthy d/yr today · 0 by 30 yrs out
Nearby sold comps map
Loading sold comps map…
Walkable amenities ~0.75 mi
Loading nearby amenities…
Taxation est. · year 1
- Rental income
- $24,252
- − Mortgage interest
- −$7,562
- − Property taxes
- −$2,841
- − Insurance
- −$675
- − Repairs & maintenance
- −$1,940
- − Management
- −$1,940
- − Depreciation
- −$3,927
- Taxable income
- $5,366
- Est. tax owed @ 24.0%
- −$1,288
- After-tax cash flow
- $5,860/yr
For passive investors: Depreciation is non-cash, so a rental often shows a tax loss while cash-flowing — sheltering income. Rental losses are passive: they offset passive income freely, and up to $25,000/yr can offset ordinary (W-2) income if you actively participate and your MAGI is under $100k (phasing out to $0 by $150k); unused losses carry forward. On sale, claimed depreciation is recaptured at up to 25%, and gains may owe capital-gains tax (a 1031 exchange can defer both). Figures are a year-1 estimate at your 24.0% rate — not tax advice; consult a CPA.
Schools (NCES district)
- District
- San Felipe-Del Rio CISD
- NCES district ID
- 4838900
- Math proficiency
- 25% ▼ -18.00%
- Reading proficiency
- 32% ▼ -5.00%
- Median HH income
- $40,582
- Composite
- 24.04/100
- National rank
- #7766
- State rank
- #667 of 826 in TX
Livability — Del Rio
- Score
- 70/100
- State rank
- #349
- US rank
- #7531
Category grades
Schools grade is shown separately in the Schools card above.
Census & demographics
- Census place
- Del Rio, TX
- County
- Val Verde County · 47,256 people
- City population
- 47,256
- Metro
- Del Rio, TX
- Population (ZIP)
- 47,256
- Household income
- $66,084
- Rent vs Own
- Severe rent burden
- 1111.0
Population outlook (Val Verde County) Hauer SSP2
- Today (2025)
- 48,073 people
- By 2030
- 47,468 · -1.3%
- By 2040
- 45,930 · -4.5%
- By 2050
- 43,904 · -8.7%
- By 2075
- 38,126 · -20.7%
- By 2100
- 26,217 · -45.5%
Race, ethnicity, and origin ACS 2023
- Neighborhood character
- Predominantly Hispanic (82%)
- Race & ethnicity
- Hispanic / Latino 82% Two or more races 24% White 15% Black 1%
- Hispanic origin (detail)
- Mexican 75%
- Common ancestry
- Italian 1% Lithuanian 1% Slovak 1%
- Foreign-born
- 19% · Canada
- Languages at home
- 36% English-only · Spanish 63%
Political lean MEDSL · Val Verde
- 2024 margin
- Strong R (+26.6) · D 36.2% · R 62.9%
- 2008→2024 swing
- -36.2pp toward R · 2008: 9.6pp · 2024: -26.6pp
- All cycles
- 2024: R+26.6 2020: R+9.9 2016: D+7.9 2012: D+5.4 2008: D+9.6
Not yet ingested
- Civics
- —
Market trends
- HPI YoY
- ▼ -81.95%
- Current HPI
- 161.762
- Rent YoY
- ▲ 1.55%
- Metro
- Del Rio, TX
- State GDP YoY
- ▲ 3.95%
- F500 in state
- 110
Industry mix (Fortune 500 HQ in TX)
| Industry | F500 HQs | Revenue |
|---|---|---|
| Energy | 16 | $1,198B |
|
||
| Technology | 5 | $198B |
|
||
| Engineering / Construction | 4 | $72B |
|
||
| Energy Services | 3 | $60B |
|
||
| Utilities | 3 | $41B |
|
||
| Healthcare | 2 | $330B |
|
||
Price history
-12.9% since first listed3 events — show timeline
- 2026-05-11 Price Changed $135,000 DRBORMLS
- 2026-04-06 Price Changed $145,000 DRBORMLS
- 2026-02-24 Listed $155,000 DRBORMLS
Property tax history
+7.2%/yrLatest (2025): $2,841 · +0.6% YoY. Source: county tax records.
Cash-flow waterfall
monthlySold comps — $/sqft
last 12 mo · ≤1 miLoading sold comps…