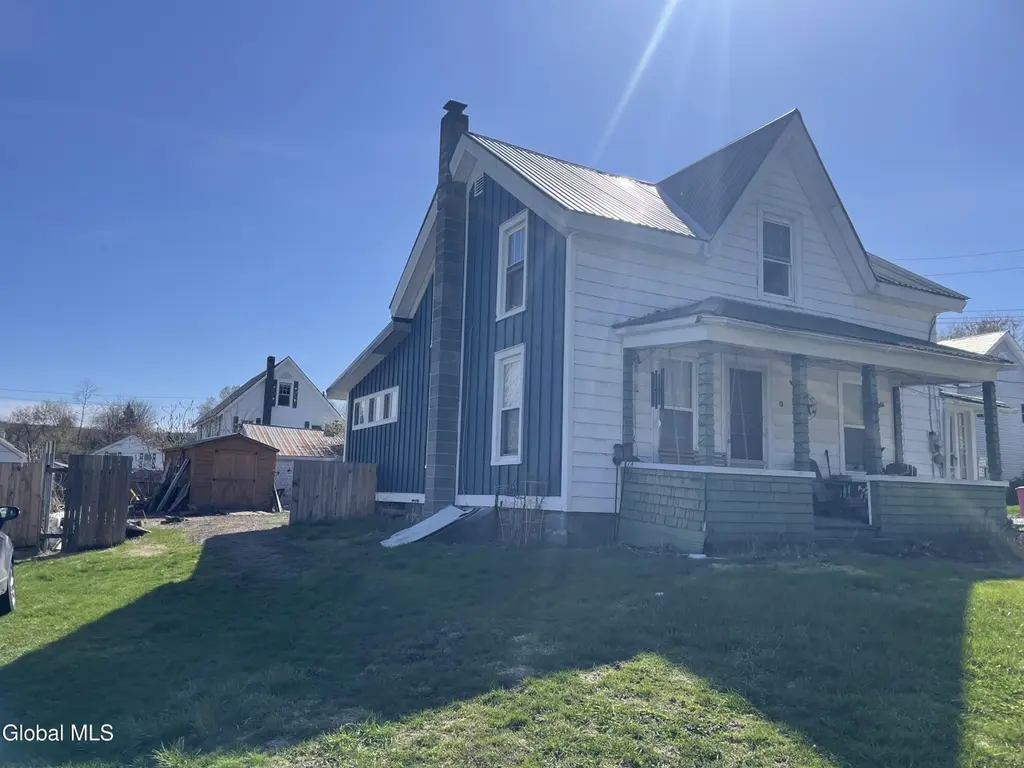
12 Waldo Pl · Port Henry, NY
Flood risk 1/10 · Minimal
- FEMA flood zone
- X
- Chance of flooding over 30 yrs
- 0.0%
- Est. flood insurance / yr
- $473 – $860
Fire risk 1/10 · Minimal
- Est. fire insurance / yr
- $691 – $1,283
Heat risk 3/10 · Minor
- Hot days now (above 97°F)
- 7 days/yr
- Hot days in 30 yrs
- 16 days/yr
Wind risk 2/10 · Minimal
- Chance of severe wind over 30 yrs
- 1.0%
Air-quality risk 1/10 · Minimal
- Unhealthy air days now
- 0 days/yr
- Unhealthy air days in 30 yrs
- 0 days/yr
Risk factors via First Street. Map © Google.
Why this score? — see what drove the D- grade
The composite is a weighted blend of 9 inputs, each scored 0–100. Each bar is that input's sub-score; the figure is the points it added to the 100-point composite (weight × sub-score).
- Cash flow +10.6/30.0
- Appreciation +7.7/10.0
- Schools +4.0/10.0
- Livability +3.8/5.0
- DSCR +3.1/10.0
- 1% rule +2.6/10.0
- Rent growth +2.5/5.0
- Condition / age +2.5/5.0
- ARV discount +0.0/15.0
$210,000
🖨 Deal sheet (PDF) 📄 Offer letter ✓ Due diligence
Listing remarks MLS
Nice 2 story home located on a corner lot in a friendly neighborhood.Original woodwork, hardwood floors, hot water heating system, metal roof, 3 bedroom, livingroom, diningroom, bonus room, inviting enclosed porch, front open porch, This older home has a lot of character.Call today!!
Key facts
- Metal roof
- Heat pump
- Original woodwork
Tags
Property features AI
Exterior
- Parking: Two garage spaces; Two total parking spaces; Paved driveway
- Security: Smoke detector(s); Carbon monoxide detector(s)
- Utilities: 100 amp electric service with circuit breakers; Public water; Public sewer; Cable available
- Home design: Single family residence
- Construction: Metal roof; Aluminum siding, plaster, and Tex 11 siding; Permanent foundation; Built area approximately 1,150
- Exterior features: Front porch; Patio; Drive paved; Corner lot; Level lot; Road frontage (60')
Interior
- Kitchen: Microwave; Range; Refrigerator
- Bedrooms: One bedroom on the first floor; Two bedrooms on the second floor
- Flooring: Carpet; Ceramic tile; Hardwood; Laminate
- Bathrooms: One full bathroom on the first floor
- Heating & cooling: Baseboard hot water heating (oil); Has heating
- Interior features: Paddle fan; Storm door(s); Insulated windows; Unfinished basement; Seven total rooms
- Laundry & utility: Washer/Dryer; Laundry located in bathroom
Neighborhood map
What this means for you Summary
Snapshot
- This is a 3-bed/1.0-bath single-family listed at $210k.
Deal economics
- At list price, monthly cash flow is $-104 ($-1k/yr) — negative.
- To cash-flow at today's rent, offer at most $192k (8.7% below list).
- To meet the 1% rule (rent ≥ 1% of price), the offer needs to be $159k (24.3% below list).
- Recommended offer: $159k (24.3% below list) — sets the bar for 1% rule.
- Cap rate 5.7% vs local median 2.7% in Port Henry — top-decile yield for the area; either an underpriced asset or a hidden risk that comps aren't pricing in. Stress-test before assuming the spread holds.
Location & tenants
- Location reads 76/100 on livability (#226 in NY, #3,576 nationally) — a middle-class / working-renter tenant base. Strengths: cost of living A+, housing A+, health & safety A+; Watch: amenities F, commute F.
- Moriah Central School District (rural): math 41% / reading 52% proficiency, ranked #445 of 590 in NY (top 75%) — families likely to look elsewhere, expect single-tenant / working-renter base with shorter leases.
- Zoned schools: Moriah Elementary School (math 42% / reading 47%, grade F, #1,277 of 2,108 statewide, top 64%, 385 students, 47% FRL); Moriah Junior-Senior High School (math 37% / reading 57%, grade D-, #1,007 of 1,100 statewide, top 93%, 316 students, 34% FRL) — zoned schools at 40% FRL track the district average.
- Market conditions: 23 active listings in the ZIP; 218 units permitted in Essex County in 2024 (63 in 5+ unit buildings).
Forward outlook
- In year one you build about $13k of equity ($1k loan paydown + $11k appreciation (5.5% local appreciation)).
- Essex County population projected at -20% by 2050 — secular population decline; favor cash flow + early exit over multi-decade hold.
- By year 3, paydown + projected appreciation supports a ~$32k cash-out refi (75% LTV) — recoverable capital for the next deal without selling this one.
Negotiation context
- It's been on market 21 days — a 2% lower offer ($207k) is reasonable based on typical stale-listing flexibility.
- 2 sale attempts since 16y ago with the ask held roughly flat each time — persistent listings suggest the price (not the market) is what's stuck; bring a comps-based counter.
- Current owner paid $140k; list at $210k implies a 50% gain — meaningful room to come down on a strong offer.
Risks & watch-outs
- Watch-outs: built in 1850 — expect roof / HVAC / electrical / plumbing capex.
Questions for the listing agent
- What do current leases actually rent for vs. the listed asking? Can we see a recent rent roll and the last 12 months of T-12 income?
- Built in 1850 — when were the roof, HVAC, electrical panel, plumbing, and water heater last replaced?
- Is there a deadline driving the sale (1031 exchange, divorce, estate, relocation)? That informs how much negotiation room exists.
- Schools are D-rated, which usually means shorter tenancies and higher turnover. Who's the typical renter profile here, and what's been the actual vacancy rate?
- The area grade is low — what's the realistic commute time and amenity access for the typical tenant pool here? Any planned neighborhood developments (good or bad) we should know about?
- What's the average days-on-market for RENTAL listings here right now (not sales)? A rising rental-DOM trend means longer vacancies and softer asking-rent achievability than the comps imply.
- What's the recent tenant-quality profile in this submarket — average credit score on applications, eviction rate, late-payment / NSF rate, and stable-employment percentage? A property-management company in the area should have these aggregated.
- How much new for-sale + rental construction is in the pipeline within 1–3 miles? Heavy new supply typically softens prices + rents 12–24 months out; constrained supply supports both.
Investment metrics
- 1% rule
- 0.76% ✗
- Cap rate
- 5.70%
- Cash-on-cash
- -2.11%
- DSCR
- 0.91
- GRM
- 11.0
CMA / ARV
- ARV (on-the-fly)
- $149,702
- Comps found
- 6
Show comp detail 6 sales within ~0.75 mi
| Address | Dist | Beds/Ba | Sqft | Sold | Price | $/sf | Match |
|---|---|---|---|---|---|---|---|
| 9 Waldo Pl | 0.02mi | 3/1.5 | 1,287 (+2%) | 11mo | $150,000 | $117 | 84 |
| 23 First Ln | 0.20mi | 3/2.0 | 1,236 (-2%) | 6mo | $150,000 | $121 | 79 |
| 15 Waldo Pl | 0.03mi | 3/1.0 | 1,360 (+8%) | 20mo | $113,300 | $83 | 69 |
| 269 Whitney St | 0.34mi | 3/1.5 | 1,255 (-0%) | 18mo | $159,000 | $127 | 67 |
| 22 Rice Ln | 0.32mi | 3/2.0 | 1,426 (+13%) | 9mo | $169,600 | $119 | 51 |
| 4348 Main St | 0.55mi | 2/2.0 (-1) | 1,100 (-13%) | 14mo | $89,900 | $82 | 33 |
Match score weights: distance 35% · size 25% · config 20% · recency 20%. Top-matched comps best support the ARV.
Projected returns pro-forma
5.45% appreciation · 3.0% rent growth · sell at horizon
- IRR
- 12.2%
- Equity multiple
- 1.80×
- Total profit
- $47,165
- Equity at exit
- $124,740
- IRR
- 13.1%
- Equity multiple
- 3.48×
- Total profit
- $145,874
- Equity at exit
- $220,183
Cash invested: $58,800 (down + closing). Projections, not guarantees.
Landlord ↔ Tenant lean methodology
- Overall (STATE)
- 15 Strongly Tenant-Friendly
- State New York
- 15 Strongly Tenant-Friendly · D+10
- County
- — inherits STATE
- City
- — inherits STATE
ZIP-level market 12974
- Home prices YoY
- 1.6%
- Active inventory
- 23
- Price-to-rent
- 11.0×
Monthly cashflow live
- Estimated rent
- $1,589 medium interval (Pro) →
- Mortgage (P&I)
- −$1,101
- Tax from tax record
- −$170 /mo · $2,040/yr
- Insurance
- −$88
- HOA
- −$0
- Vacancy / Maint / Mgmt
- −$334
- Net cashflow
- $-104
Break-even live
Sensitivity live
| Price | -10% $15 | -5% $-44 | +0% $-104 | +5% $-163 | +10% $-222 |
|---|---|---|---|---|---|
| Rent | -10% $-229 | -5% $-166 | +0% $-104 | +5% $-41 | +10% $22 |
| Rate | -1.0pp $2 | -0.5pp $-50 | base $-104 | +0.5pp $-158 | +1.0pp $-213 |
UW: 25.0% down · 7.5% · 30yr · 1.5% tax · 5.0% vac · 8.0% maint · 8.0% mgmt
Financing live
Cash to close
- Down payment
- $52,500
- Closing costs
- $6,300
- Reserves months
- —
- Total cash needed
- —
Loan-product check · same deal, 3 products live
Conventional
25% down · 7.5% · 30yr
- Down + closing
- —
- Monthly P&I
- —
- Monthly cashflow
- —
- DSCR
- —
- Eligible?
- —
Personal DTI + credit; lowest rate.
DSCR
20% down · 8.5% · 30yr
- Down + closing
- —
- Monthly P&I
- —
- Monthly cashflow
- —
- DSCR
- —
- Eligible?
- —
No personal income docs; deal must DSCR.
Hard money
10% down · 12.0% · 12mo
- Down + closing
- —
- Monthly P&I
- —
- Monthly cashflow
- —
- DSCR
- —
- Eligible?
- —
Short-term bridge; refi at stabilization.
Listing history 16 events
-
2026-06-22days on market $210,000 Active 21 DOM
-
2026-06-21days on market $210,000 Active 20 DOM
-
2026-06-21days on market $210,000 Active 19 DOM
-
2026-06-18days on market $210,000 Active 17 DOM
-
2026-06-17days on market $210,000 Active 16 DOM
-
2026-06-16days on market $210,000 Active 15 DOM
-
2026-06-15days on market $210,000 Active 14 DOM
-
2026-06-13days on market $210,000 Active 12 DOM
-
2026-06-12days on market $210,000 Active 11 DOM
-
2026-06-09days on market $210,000 Active 8 DOM
-
2026-06-08days on market $210,000 Active 7 DOM
-
2026-06-07days on market $210,000 Active 6 DOM
-
2026-06-05days on market $210,000 Active 4 DOM
-
2026-06-04days on market $210,000 Active 2 DOM
-
2026-06-01remarks 285-char remark
-
2026-06-01$210,000 Active 1 DOM
ⓘ Source: listings_history table (triggers on properties + properties_extension) + one-shot
backfill from property_details.listing_events for pre-trigger history.
Tax reassessment forecast NY · Partial reset (capped growth)
- Current annual tax
- $2,040 · $170/mo
- Projected year-2 tax
- $2,795 · $233/mo
- Expected delta
- +$754/yr (+$63/mo · 37.0%)
ⓘ Screening estimate from a state-policy table — verify with the county assessor before closing.
Climate risk First Street
- Flood 1/10 Low FEMA zone X · 0% chance over 30 yrs
- Wildfire 1/10 Low
- Heat 3/10 Moderate 7 d/yr ≥97°F today · 16 d/yr by 30 yrs out
- Wind 2/10 Low 100% chance of damaging wind over 30 yrs
- Air quality 1/10 Low 0 unhealthy d/yr today · 0 by 30 yrs out
Nearby sold comps map
Loading sold comps map…
Walkable amenities ~0.75 mi
Loading nearby amenities…
Taxation est. · year 1
- Rental income
- $19,067
- − Mortgage interest
- −$11,763
- − Property taxes
- −$2,040
- − Insurance
- −$1,050
- − Repairs & maintenance
- −$1,525
- − Management
- −$1,525
- − Depreciation
- −$6,109
- Taxable loss
- −$4,947
- Est. tax savings @ 24.0%
- +$1,187
- After-tax cash flow
- $-56/yr
For passive investors: Depreciation is non-cash, so a rental often shows a tax loss while cash-flowing — sheltering income. Rental losses are passive: they offset passive income freely, and up to $25,000/yr can offset ordinary (W-2) income if you actively participate and your MAGI is under $100k (phasing out to $0 by $150k); unused losses carry forward. On sale, claimed depreciation is recaptured at up to 25%, and gains may owe capital-gains tax (a 1031 exchange can defer both). Figures are a year-1 estimate at your 24.0% rate — not tax advice; consult a CPA.
Schools (NCES district)
- District
- Moriah Central School District
- NCES district ID
- 3619830
- Math proficiency
- 41% ▼ -6.00%
- Reading proficiency
- 52% ▲ 2.00%
- Median HH income
- $46,940
- Composite
- 39.55/100
- National rank
- #3937
- State rank
- #445 of 590 in NY
Livability — Port Henry
- Score
- 76/100
- State rank
- #226
- US rank
- #3576
Category grades
Schools grade is shown separately in the Schools card above.
Census & demographics
- Census place
- Port Henry, NY
- Population (ZIP)
- 1,545
Population outlook (Essex County) Hauer SSP2
- Today (2025)
- 36,758 people
- By 2030
- 35,697 · -2.9%
- By 2040
- 32,697 · -11.0%
- By 2050
- 29,248 · -20.4%
- By 2075
- 22,641 · -38.4%
- By 2100
- 16,602 · -54.8%
Race, ethnicity, and origin ACS 2023
- Neighborhood character
- Predominantly White (93%)
- Race & ethnicity
- White 93% Two or more races 6% Hispanic / Latino 5%
- Common ancestry
- Lithuanian 20% Romanian 12% Italian 6%
- Foreign-born
- 2% · Canada, China
- Languages at home
- 88% English-only · French/Haitian/Cajun 6% Spanish 2% Other Asian/Pacific 2%
Political lean MEDSL · Essex
- 2024 margin
- Toss-up / Even · D 50.2% · R 49.8%
- 2008→2024 swing
- -12.8pp toward R · 2008: 13.3pp · 2024: 0.5pp
- All cycles
- 2024: D+0.5 2020: D+5.0 2016: R+3.4 2012: D+15.0 2008: D+13.3
Not yet ingested
- Civics
- —
Market trends
- HPI YoY
- ▲ 5.45%
- Current HPI
- 342.6175
- Rent YoY
- —
- Metro
- —
- State GDP YoY
- ▲ 2.60%
- F500 in state
- 92
Industry mix (Fortune 500 HQ in NY)
| Industry | F500 HQs | Revenue |
|---|---|---|
| Financial Services | 10 | $950B |
|
||
| Consumer Goods | 9 | $162B |
|
||
| Insurance | 4 | $225B |
|
||
| Telecommunications | 2 | $144B |
|
||
| Pharmaceuticals | 2 | $112B |
|
||
| Media / Entertainment | 2 | $69B |
|
||
Price history
+204.3% since first listed5 events — show timeline
- 2026-05-30 Listed $210,000 Global MLS
- 2024-11-19 Sold (Public Records) $140,000 Public Records
- 2019-05-29 Sold (Public Records) $72,000 Public Records
- 2011-06-20 Sold (MLS) $50,000 Global MLS
- 2010-12-10 Listed $69,000 Global MLS
Property tax history
-3.2%/yrLatest (2025): $2,040 · +0.8% YoY. Source: county tax records.
Cash-flow waterfall
monthlySold comps — $/sqft
last 12 mo · ≤1 miLoading sold comps…