 🏗️ New Construction
Res T Plan · Rendon, TX
Flood risk 1/10 · Minimal
- FEMA flood zone
- X (unshaded)
- Chance of flooding over 30 yrs
- 0.0%
- Est. flood insurance / yr
- $507 – $1,088
Fire risk 5/10 · Moderate
- Est. fire insurance / yr
- $1,222 – $2,270
Heat risk 7/10 · Major
- Hot days now (above 110°F)
- 7 days/yr
- Hot days in 30 yrs
- 25 days/yr
Wind risk 6/10 · Moderate
- Chance of severe wind over 30 yrs
- 27.0%
Air-quality risk 3/10 · Minor
- Unhealthy air days now
- 2 days/yr
- Unhealthy air days in 30 yrs
- 3 days/yr
Risk factors via First Street. Map © Google.
Why this score? — see what drove the B- grade
The composite is a weighted blend of 9 inputs, each scored 0–100. Each bar is that input's sub-score; the figure is the points it added to the 100-point composite (weight × sub-score).
- Cash flow +30.0/30.0
- 1% rule +10.0/10.0
- DSCR +10.0/10.0
- ARV discount +7.5/15.0
- Condition / age +4.0/5.0
- Livability +3.2/5.0
- Rent growth +2.9/5.0
- Schools +2.3/10.0
- Appreciation +0.0/10.0
$66,995
🖨 Deal sheet 📄 Offer letter ✓ Due diligence
Listing remarks
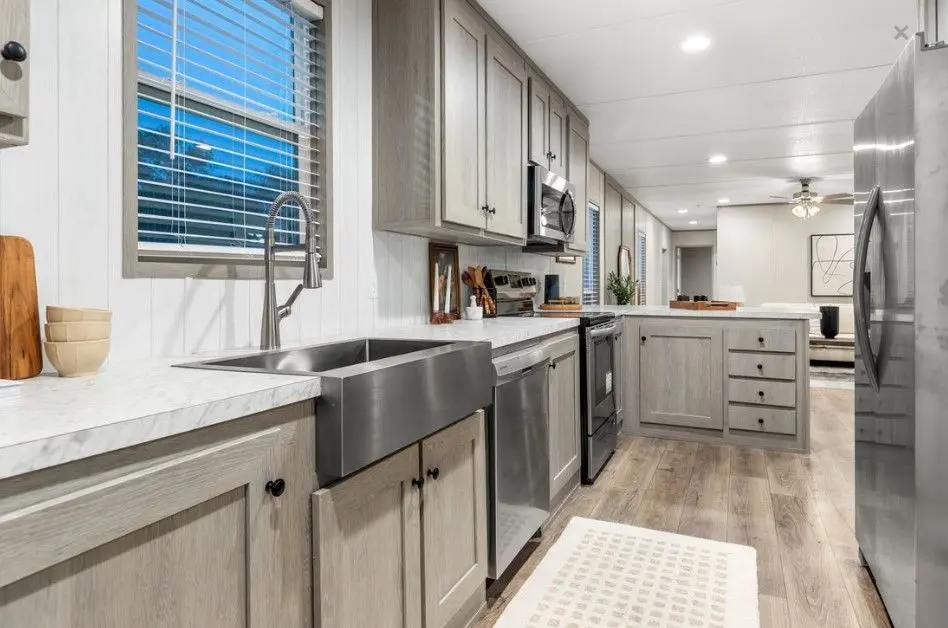
Rancho Serenidad in Burleson, TX - Elevated Living. Effortless Luxury. Step into a refined lifestyle with this beautifully designed 3-bedroom, 2-bathroom home offering 1,216 sq. ft. of thoughtfully crafted living space. The open-concept layout flows seamlessly into a modern kitchen complete with stainless steel appliances, delivering both style and function. Retreat to your private primary suite featuring an ensuite bath with double vanities, while the rest of the home is designed to comfortably accommodate family and guests alike. Beyond your front door, enjoy exclusive access to members-only amenities, including a resort-style pool, 24-hour fitness center, and a welcoming clubhouse with c
Key facts
- Listed 55 days
Property features AI
Finance
- Other: Address: Burleson, TX 76028
- Financial info: List price $66,995
Exterior
- Utilities: Electric heating and power; Central air conditioning
- Home design: Res T plan home; Active new-construction plan
- Construction: Living area approximately 1,216
- Exterior features: Shake roof
Interior
- Bedrooms: 3 bedrooms
- Bathrooms: 2 bathrooms (full)
- Heating & cooling: Electric forced-air heating; Central air conditioning
- Interior features: Plan home (Res T)
Neighborhood map
What this means for you Summary
Snapshot
- This is a 3-bed/2.0-bath manufactured listed at $67k. Condition is rated good.
Deal economics
- At list price, monthly cash flow is $1k ($13k/yr) — positive.
- The deal already cash-flows at list — no discount required.
- Meets the 1% rule at list price ($2k rent vs $67k).
- Recommended offer: $65k (3.0% below list) — sets the bar for market timing.
- Cap rate 25.4% vs local median 2.4% in Rendon — top-decile yield for the area; either an underpriced asset or a hidden risk that comps aren't pricing in. Stress-test before assuming the spread holds.
Location & tenants
- Location reads 64/100 on livability (#759 in TX) — a middle-class / working-renter tenant base. Strengths: crime A+, employment A+, housing A+; Watch: schools F, amenities F, commute F.
- Everman ISD (suburban): math 21% / reading 32% proficiency, ranked #691 of 826 in TX (top 84%) — low school quality limits family demand, transient renter base, plan for 1-2y turnover; 77% free/reduced lunch — lower-income household profile, screen leases tightly.
- Market conditions: Rents rising (+1.8%/yr); 679 active listings in the ZIP; 32 comparable units currently listed for rent nearby; rentals at typical pace (median 20d on market — plan ~3-4 weeks tenant-placement turnaround); solid renter incomes; 18,938 units permitted in Tarrant County in 2024 (8,336 in 5+ unit buildings).
Forward outlook
- Local home prices are declining (-3.0%/yr); year-one equity from $463 of loan paydown is wiped out by about $2k of value loss. Plan a longer hold.
- Tarrant County population projected at +41% by 2050 — long-run rental-demand tailwind backs the buy-and-hold thesis.
- At projected returns (-3.0% appreciation + 1.8% rent growth), your $19k cash investment doubles in ~2 years — after that, you're playing with house money.
Negotiation context
- It's been on market 56 days — a 3% lower offer ($65k) is reasonable based on typical stale-listing flexibility.
Risks & watch-outs
- Climate carrying-cost: major wind risk, 27% chance of damaging wind over 30y; moderate wildfire risk; extreme-heat days projected 7→25/yr by 2055 (HVAC capex compounding) — expect insurance premiums to compound above CPI over the hold.
Questions for the listing agent
- It's been on market 56 days. Have you received any prior offers? Is the seller open to a 3% concession, seller financing, or rate buy-down credit?
- Is there a deadline driving the sale (1031 exchange, divorce, estate, relocation)? That informs how much negotiation room exists.
- Schools are F-rated, which usually means shorter tenancies and higher turnover. Who's the typical renter profile here, and what's been the actual vacancy rate?
- What's the average days-on-market for RENTAL listings here right now (not sales)? A rising rental-DOM trend means longer vacancies and softer asking-rent achievability than the comps imply.
- What's the recent tenant-quality profile in this submarket — average credit score on applications, eviction rate, late-payment / NSF rate, and stable-employment percentage? A property-management company in the area should have these aggregated.
- How much new for-sale + rental construction is in the pipeline within 1–3 miles? Heavy new supply typically softens prices + rents 12–24 months out; constrained supply supports both.
Investment metrics
- 1% rule
- 2.89% ✓
- Cap rate
- 25.44%
- Cash-on-cash
- 68.37%
- DSCR
- 4.04
- GRM
- 2.9
CMA / ARV
No comps found within radius.
Projected returns pro-forma
-3.0% appreciation · 1.78% rent growth · sell at horizon
- IRR
- 66.4%
- Equity multiple
- 3.93×
- Total profit
- $54,894
- Equity at exit
- $9,989
- IRR
- 70.3%
- Equity multiple
- 7.73×
- Total profit
- $126,159
- Equity at exit
- $5,793
Cash invested: $18,759 (down + closing). Projections, not guarantees.
Landlord ↔ Tenant lean methodology
- Overall (STATE)
- 87 Strongly Landlord-Friendly
- State Texas
- 87 Strongly Landlord-Friendly · R+5
- County
- — inherits STATE
- City
- — inherits STATE
ZIP-level market 76028
- Home prices YoY
- -33.4%
- Rents YoY
- 1.8%
- Active inventory
- 679
- Price-to-rent
- 2.9×
Monthly cashflow live
- Estimated rent
- $1,939 high interval (Pro) →
- Mortgage (P&I)
- −$351
- Tax est. 1.5%
- −$84 /mo · $1,005/yr
- Insurance
- −$28
- HOA
- −$0
- Vacancy / Maint / Mgmt
- −$407
- Net cashflow
- $1,069
Break-even live
UW: 25.0% down · 7.5% · 30yr · 1.5% tax · 5.0% vac · 8.0% maint · 8.0% mgmt
Financing live
Cash to close
- Down payment
- $16,749
- Closing costs
- $2,010
- Reserves months
- —
- Total cash needed
- —
Loan-product check · same deal, 3 products live
Conventional
25% down · 7.5% · 30yr
- Down + closing
- —
- Monthly P&I
- —
- Monthly cashflow
- —
- DSCR
- —
- Eligible?
- —
Personal DTI + credit; lowest rate.
DSCR
20% down · 8.5% · 30yr
- Down + closing
- —
- Monthly P&I
- —
- Monthly cashflow
- —
- DSCR
- —
- Eligible?
- —
No personal income docs; deal must DSCR.
Hard money
10% down · 12.0% · 12mo
- Down + closing
- —
- Monthly P&I
- —
- Monthly cashflow
- —
- DSCR
- —
- Eligible?
- —
Short-term bridge; refi at stabilization.
Rent comps 32 comps
| Address | Beds | Baths | Sqft | Rent | $/sqft | DOM | Units | Dist |
|---|---|---|---|---|---|---|---|---|
| 1800 Oak Grove Rd E Burleson, TX | 3.0–4.0 | 2.0 | 1392 | $1,795 | $1.29 | 1d | 14 | 0.15mi |
| 1680 Crested Way Fort Worth, TX | 3.0 | 2.0 | 1411 | $1,895 | $1.34 | 12d | 1 | 0.17mi |
| 1617 Crested Way Fort Worth, TX | 3.0 | 2.0 | 1411 | $2,200 | $1.56 | 43d | 1 | 0.23mi |
| 1644 Limpkin Dr Fort Worth, TX | 3.0 | 2.0 | 1402 | $1,860 | $1.33 | 43d | 1 | 0.28mi |
| 1612 Limpkin Dr Fort Worth, TX | 3.0 | 2.0 | 1411 | $1,925 | $1.36 | 43d | 1 | 0.30mi |
| 1633 Limpkin Dr Fort Worth, TX | 3.0 | 2.0 | 1266 | $1,905 | $1.50 | 43d | 1 | 0.32mi |
| 1508 Pine Ln Fort Worth, TX | 3.0 | 1.0 | 1098 | $1,599 | $1.46 | 43d | 1 | 0.37mi |
| 1452 Pine Ln Fort Worth, TX | 3.0 | 1.5 | 1098 | $1,595 | $1.45 | 20d | 1 | 0.40mi |
| 1461 Pine Ln Fort Worth, TX | 3.0 | 2.0 | 1268 | $1,739 | $1.37 | 7d | 1 | 0.41mi |
| 1424 Pine Ln Fort Worth, TX | 3.0 | 2.5 | 1332 | $1,590 | $1.19 | 12d | 1 | 0.43mi |
| 1437 Pine Ln Fort Worth, TX | 3.0 | 2.0 | 1175 | $1,800 | $1.53 | 43d | 1 | 0.44mi |
| 1433 Pine Ln Fort Worth, TX | 3.0 | 3.0 | 1316 | $2,075 | $1.58 | 43d | 1 | 0.44mi |
| 10716 Wild Oak Dr Fort Worth, TX | 2.0 | 2.0 | 1072 | $1,595 | $1.49 | 20d | 1 | 0.50mi |
| 10745 Many Oaks Dr Fort Worth, TX | 2.0 | 1.0 | 997 | $1,595 | $1.60 | 24d | 1 | 0.50mi |
| 1408 Silver Spruce Ln Fort Worth, TX | 3.0 | 2.0 | 1411 | $1,800 | $1.28 | 18d | 1 | 0.51mi |
| 10628 Wild Oak Dr Fort Worth, TX | 3.0 | 2.5 | 1312 | $1,740 | $1.33 | 3d | 1 | 0.55mi |
| 1312 Nelson Pl Burleson, TX | 3.0 | 2.0 | 1232 | $1,820 | $1.48 | 43d | 1 | 0.70mi |
| 1209 Brownford Dr Burleson, TX | 3.0 | 2.0 | 1495 | $1,875 | $1.25 | 43d | 1 | 0.89mi |
| 1300 Hazelnut Dr Fort Worth, TX | 3.0 | 2.0 | 1448 | $2,300 | $1.59 | 5d | 1 | 0.94mi |
| 10613 Flamewood Dr Fort Worth, TX | 3.0 | 2.0 | 1324 | $1,550 | $1.17 | 43d | 1 | 0.98mi |
| 10525 Flamewood Dr Fort Worth, TX | 3.0 | 2.0 | 1446 | $1,849 | $1.28 | 2d | 1 | 1.00mi |
| 10640 Towerwood Dr Fort Worth, TX | 3.0 | 2.0 | 1422 | $1,696 | $1.19 | 7d | 1 | 1.02mi |
| 10632 Towerwood Dr Fort Worth, TX | 3.0 | 2.0 | 1382 | $1,750 | $1.27 | 24d | 1 | 1.03mi |
| 1500 Four Seasons Ln Fort Worth, TX | 1.0–3.0 | 1.0–2.0 | 876 | $1,400 | $1.60 | 22d | 1 | 1.16mi |
| 10436 Phantom Hill Rd Fort Worth, TX | 3.0 | 2.0 | 1498 | $1,885 | $1.26 | 7d | 1 | 1.16mi |
| 1456 Palamedes Dr Fort Worth, TX | 3.0 | 2.0 | 1316 | $2,000 | $1.52 | 4d | 1 | 1.18mi |
| 757 Dema Ln Burleson, TX | 3.0 | 2.0 | 1432 | $1,869 | $1.31 | 2d | 1 | 1.22mi |
| 916 Buffalo Springs Dr Fort Worth, TX | 3.0 | 2.0 | 1329 | $1,840 | $1.38 | 7d | 1 | 1.25mi |
| 741 Dema Ln Burleson, TX | 3.0 | 2.0 | 1447 | $2,000 | $1.38 | 24d | 1 | 1.26mi |
| 12220 Hunters Crossing Ln Burleson, TX | 3.0 | 2.0 | 1385 | $1,789 | $1.29 | 43d | 1 | 1.40mi |
| 1444 Harvester Dr Fort Worth, TX | 3.0–5.0 | 2.0–2.5 | 1840 | $2,080 | $1.13 | 1d | 1 | 1.40mi |
| 901 E Rendon Crowley Rd Burleson, TX | 1.0–3.0 | 1.0–2.0 | 1181 | $2,745 | $2.32 | 1d | 49 | 1.43mi |
Listing history 14 events
-
2026-06-18days on market $66,995 Active 56 DOM
-
2026-06-17days on market $66,995 Active 55 DOM
-
2026-06-16days on market $66,995 Active 54 DOM
-
2026-06-15days on market $66,995 Active 53 DOM
-
2026-06-13days on market $66,995 Active 51 DOM
-
2026-06-09days on market $66,995 Active 47 DOM
-
2026-06-08days on market $66,995 Active 46 DOM
-
2026-06-07days on market $66,995 Active 45 DOM
-
2026-06-04days on market $66,995 Active 42 DOM
-
2026-06-03days on market $66,995 Active 41 DOM
-
2026-06-02days on market $66,995 Active 40 DOM
-
2026-06-01days on market $66,995 Active 39 DOM
-
2026-05-31days on market $66,995 Active 38 DOM
-
2026-04-24$66,995 Active 1131-char remark
ⓘ Source: listings_history table (triggers on properties + properties_extension) + one-shot
backfill from property_details.listing_events for pre-trigger history.
Climate risk First Street
- Flood 1/10 Low FEMA zone X (unshaded) · 0% chance over 30 yrs
- Wildfire 5/10 Major
- Heat 7/10 Severe 7 d/yr ≥110°F today · 25 d/yr by 30 yrs out
- Wind 6/10 Major 27% chance of damaging wind over 30 yrs
- Air quality 3/10 Moderate 2 unhealthy d/yr today · 3 by 30 yrs out
Nearby sold comps map
Loading sold comps map…
Walkable amenities ~0.75 mi
Loading nearby amenities…
Taxation est. · year 1
- Rental income
- $23,268
- − Mortgage interest
- −$3,753
- − Property taxes
- −$1,005
- − Insurance
- −$335
- − Repairs & maintenance
- −$1,861
- − Management
- −$1,861
- − Depreciation
- −$1,949
- Taxable income
- $12,503
- Est. tax owed @ 24.0%
- −$3,001
- After-tax cash flow
- $9,825/yr
For passive investors: Depreciation is non-cash, so a rental often shows a tax loss while cash-flowing — sheltering income. Rental losses are passive: they offset passive income freely, and up to $25,000/yr can offset ordinary (W-2) income if you actively participate and your MAGI is under $100k (phasing out to $0 by $150k); unused losses carry forward. On sale, claimed depreciation is recaptured at up to 25%, and gains may owe capital-gains tax (a 1031 exchange can defer both). Figures are a year-1 estimate at your 24.0% rate — not tax advice; consult a CPA.
Condition & rehab AI · 12 photos
This home is in excellent condition with a modern kitchen and bathrooms. It's move-in ready and would benefit from some updates to the paint and lighting to enhance its appeal.
Value-add opportunities
- Both Painting — Neutral paint may not appeal to all buyers
- Both Lighting — Update lighting fixtures for a modern look
- Both Decor — Add some decorative items to make the space more inviting
Renovation cost estimate screening
Value-add ROI direction
- Both Painting — Neutral paint may not appeal to all buyers ↑
- Both Lighting — Update lighting fixtures for a modern look ↑
- Both Decor — Add some decorative items to make the space more inviting ↑
ⓘ Cost ranges are severity-bucket heuristics (US national rule-of-thumb). Get contractor quotes + a written scope before underwriting a rehab budget.
Schools (NCES district)
- District
- Everman ISD
- NCES district ID
- 4818810
- Math proficiency
- 21% ▼ -18.00%
- Reading proficiency
- 32% ▼ -4.00%
- Median HH income
- $44,803
- Composite
- 22.77/100
- National rank
- #8027
- State rank
- #691 of 826 in TX
Livability — Rendon
- Score
- 64/100
- State rank
- #759
- US rank
- #13917
Category grades
Schools grade is shown separately in the Schools card above.
Census & demographics
- Census place
- Rendon, TX
- County
- Johnson County · 147,987 people
- Metro
- Dallas-Fort Worth-Arlington, TX
- Population (ZIP)
- 81,549
- Household income
- $101,138
- Rent vs Own
- Severe rent burden
- 1117.0
Population outlook (Tarrant County) Hauer SSP2
- Today (2025)
- 2,380,417 people
- By 2030
- 2,578,900 · +8.3%
- By 2040
- 2,974,995 · +25.0%
- By 2050
- 3,350,489 · +40.8%
- By 2075
- 4,216,909 · +77.2%
- By 2100
- 4,741,527 · +99.2%
Race, ethnicity, and origin ACS 2023
- Neighborhood character
- Predominantly White (69%)
- Race & ethnicity
- White 69% Hispanic / Latino 19% Two or more races 11% Black 6% Asian 1%
- Hispanic origin (detail)
- Mexican 17%
- Common ancestry
- Lithuanian 2% Italian 2% Slovak 2%
- Foreign-born
- 5% · Canada
- Languages at home
- 88% English-only · Spanish 10% Other Indo-European 1%
Political lean MEDSL · Tarrant
- 2024 margin
- Lean R (+5.1) · D 46.7% · R 51.9% · Other 1.4%
- 2008→2024 swing
- +6.6pp toward D · 2008: -11.7pp · 2024: -5.1pp
- All cycles
- 2024: R+5.1 2020: D+0.2 2016: R+8.7 2012: R+15.7 2008: R+11.7
Not yet ingested
- Civics
- —
Market trends
- HPI YoY
- ▼ -141.44%
- Current HPI
- 282.466
- Rent YoY
- ▲ 1.78%
- Metro
- Dallas-Fort Worth-Arlington, TX
- State GDP YoY
- ▲ 3.95%
- F500 in state
- 110
Industry mix (Fortune 500 HQ in TX)
| Industry | F500 HQs | Revenue |
|---|---|---|
| Energy | 16 | $1,198B |
|
||
| Technology | 5 | $198B |
|
||
| Engineering / Construction | 4 | $72B |
|
||
| Energy Services | 3 | $60B |
|
||
| Utilities | 3 | $41B |
|
||
| Healthcare | 2 | $330B |
|
||
Cash-flow waterfall
monthlySold comps — $/sqft
last 12 mo · ≤1 miLoading sold comps…