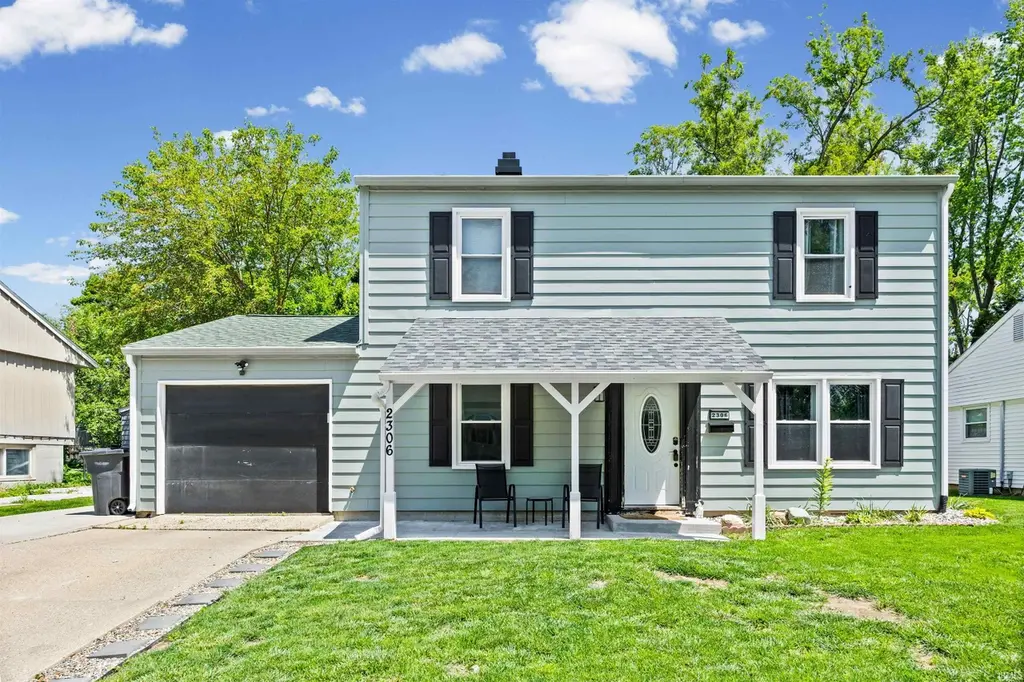
2306 Ottawa Dr · Lafayette, IN
Flood risk 1/10 · Minimal
- FEMA flood zone
- X (unshaded)
- Chance of flooding over 30 yrs
- 0.0%
- Est. flood insurance / yr
- $507 – $1,088
Fire risk 1/10 · Minimal
- Est. fire insurance / yr
- $717 – $1,331
Heat risk 3/10 · Minor
- Hot days now (above 101°F)
- 7 days/yr
- Hot days in 30 yrs
- 18 days/yr
Wind risk 2/10 · Minimal
- Chance of severe wind over 30 yrs
- —
Air-quality risk 2/10 · Minimal
- Unhealthy air days now
- 1 days/yr
- Unhealthy air days in 30 yrs
- 2 days/yr
Risk factors via First Street. Map © Google.
Why this score? — see what drove the D- grade
The composite is a weighted blend of 9 inputs, each scored 0–100. Each bar is that input's sub-score; the figure is the points it added to the 100-point composite (weight × sub-score).
- Cash flow +15.1/30.0
- DSCR +4.6/10.0
- ARV discount +4.0/15.0
- Livability +3.7/5.0
- Rent growth +3.2/5.0
- 1% rule +3.1/10.0
- Schools +2.6/10.0
- Condition / age +2.5/5.0
- Appreciation +0.0/10.0
$249,900
🖨 Deal sheet (PDF) 📄 Offer letter ✓ Due diligence
Listing remarks MLS
Four bedroom two-story home located in a mature neighborhood with large rear yard. Home also features an attached one car garage, eat in kitchen, and storage shed. Seller will pay $3,000 to buyers selling costs with full price offer.
Key facts
- 6,098 sq ft lot
- Garage
- Built 1961
Property features AI
Exterior
- Parking: Attached garage with concrete driveway; 1 garage space
- Utilities: Public water; Public sewer
- Home design: Single-family residence; Site-built home; 2 stories; Entry level information not provided
- Construction: Aluminum siding; Shingle roof; Slab foundation; Built area above grade: 1,440
- Exterior features: Covered porch; Patio; Wood fencing; Shed(s); Level, landscaped lot
Interior
- Kitchen: Dishwasher; Microwave; Refrigerator; Gas range
- Bedrooms: Bedrooms — see listing for count
- Flooring: Vinyl
- Bathrooms: 1 full bathroom; 1 half bathroom; 1 main-level bathroom
- Heating & cooling: Forced air heating; Central air conditioning
- Interior features: Dishwasher; Microwave; Refrigerator; Gas range; Gas water heater; Water heater; Vinyl flooring; 7 total rooms
- Laundry & utility: Laundry on the main level
Neighborhood map
What this means for you Summary
Snapshot
- This is a 5-bed/1.5-bath single-family listed at $250k.
Deal economics
- At list price, monthly cash flow is $83 ($996/yr) — positive.
- The deal already cash-flows at list — no discount required.
- To meet the 1% rule (rent ≥ 1% of price), the offer needs to be $204k (18.6% below list).
- Recommended offer: $204k (18.6% below list) — sets the bar for 1% rule.
- Cap rate 6.7% vs local median 4.1% in Lafayette — top-decile yield for the area; either an underpriced asset or a hidden risk that comps aren't pricing in. Stress-test before assuming the spread holds.
Location & tenants
- Location reads 74/100 on livability (#68 in IN, #4,374 nationally) — a middle-class / working-renter tenant base. Strengths: cost of living A+, housing A+, health & safety A+; Watch: amenities D+, employment D+, crime F.
- Lafayette School Corporation (urban): math 29% / reading 34% proficiency, ranked #235 of 301 in IN (top 78%) — families likely to look elsewhere, expect single-tenant / working-renter base with shorter leases; 63% free/reduced lunch — lower-income household profile, screen leases tightly.
- Zoned schools: Miami Elementary School (math 27% / reading 27%, grade F, #737 of 994 statewide, top 76%, 458 students, 86% FRL); Lafayette Sunnyside Intermediate (math 26% / reading 26%, grade F, #240 of 330 statewide, top 73%, 1,047 students, 77% FRL); Jefferson High School (math 23% / reading 55%, grade F, #235 of 369 statewide, top 65%, 2,118 students, 69% FRL).
- Market conditions: Rents rising (+2.7%/yr); 187 active listings in the ZIP; 1,341 units permitted in Tippecanoe County in 2024 (869 in 5+ unit buildings).
- This rent runs 36% of the median local income ($68k/yr) — at the standard rent-burdened threshold; future hikes will face affordability resistance.
Forward outlook
- Local home prices are declining (-3.0%/yr); year-one equity from $2k of loan paydown is wiped out by about $7k of value loss. Plan a longer hold.
- Tippecanoe County population projected at +41% by 2050 — long-run rental-demand tailwind backs the buy-and-hold thesis.
Negotiation context
- Only 7 days on market — expect competitive offers; lowballing is unlikely to land.
- 3 sale attempts since 10y ago with the ask held roughly flat each time — persistent listings suggest the price (not the market) is what's stuck; bring a comps-based counter.
- Current owner paid $126k; list at $250k implies a 98% gain — meaningful room to come down on a strong offer.
Questions for the listing agent
- Built in 1961 — when were the roof, HVAC, electrical panel, plumbing, and water heater last replaced?
- Is there a deadline driving the sale (1031 exchange, divorce, estate, relocation)? That informs how much negotiation room exists.
- Schools are D-rated, which usually means shorter tenancies and higher turnover. Who's the typical renter profile here, and what's been the actual vacancy rate?
- Crime grade is F in this area — have there been break-ins, vandalism, or insurance claims at this property in the last 3 years? What carrier currently insures it and at what premium?
- The area grade is low — what's the realistic commute time and amenity access for the typical tenant pool here? Any planned neighborhood developments (good or bad) we should know about?
- What's the average days-on-market for RENTAL listings here right now (not sales)? A rising rental-DOM trend means longer vacancies and softer asking-rent achievability than the comps imply.
- What's the recent tenant-quality profile in this submarket — average credit score on applications, eviction rate, late-payment / NSF rate, and stable-employment percentage? A property-management company in the area should have these aggregated.
- How much new for-sale + rental construction is in the pipeline within 1–3 miles? Heavy new supply typically softens prices + rents 12–24 months out; constrained supply supports both.
Investment metrics
- 1% rule
- 0.81% ✗
- Cap rate
- 6.69%
- Cash-on-cash
- 1.42%
- DSCR
- 1.06
- GRM
- 10.2
CMA / ARV
- ARV (on-the-fly)
- $231,840
- Comps found
- 5
Show comp detail 5 sales within ~0.75 mi
| Address | Dist | Beds/Ba | Sqft | Sold | Price | $/sf | Match |
|---|---|---|---|---|---|---|---|
| 2303 Sioux Pl | 0.18mi | 4/2.0 (-1) | 1,443 (+0%) | 2mo | $232,500 | $161 | 83 |
| 2602 Sequoya Dr | 0.15mi | 4/1.5 (-1) | 1,440 (0%) | 23mo | $222,000 | $154 | 69 |
| 2329 Dakota Dr | 0.08mi | 4/2.0 (-1) | 1,608 (+12%) | 14mo | $225,000 | $140 | 58 |
| 2108 Arapahoe Drive Dr | 0.33mi | 4/2.0 (-1) | 1,632 (+13%) | 17mo | $270,000 | $165 | 41 |
| 2425 Crestview Ct | 0.72mi | 4/2.0 (-1) | 1,300 (-10%) | 24mo | $250,000 | $192 | 24 |
Match score weights: distance 35% · size 25% · config 20% · recency 20%. Top-matched comps best support the ARV.
Projected returns pro-forma
-3.0% appreciation · 2.74% rent growth · sell at horizon
- IRR
- -14.3%
- Equity multiple
- 0.49×
- Total profit
- $-35,832
- Equity at exit
- $37,261
- IRR
- -6.0%
- Equity multiple
- 0.61×
- Total profit
- $-26,942
- Equity at exit
- $21,607
Cash invested: $69,972 (down + closing). Projections, not guarantees.
Landlord ↔ Tenant lean methodology
- Overall (STATE)
- 90 Strongly Landlord-Friendly
- State Indiana
- 90 Strongly Landlord-Friendly · R+11
- County
- — inherits STATE
- City
- — inherits STATE
ZIP-level market 47909
- Rents YoY
- 2.7%
- Active inventory
- 187
- Price-to-rent
- 10.2×
Monthly cashflow live
- Estimated rent
- $2,035 medium interval (Pro) →
- Mortgage (P&I)
- −$1,311
- Tax from tax record
- −$110 /mo · $1,323/yr
- Insurance
- −$104
- HOA
- −$0
- Vacancy / Maint / Mgmt
- −$427
- Net cashflow
- $83
Break-even live
Sensitivity live
| Price | -10% $224 | -5% $154 | +0% $83 | +5% $12 | +10% $-58 |
|---|---|---|---|---|---|
| Rent | -10% $-78 | -5% $3 | +0% $83 | +5% $163 | +10% $244 |
| Rate | -1.0pp $209 | -0.5pp $147 | base $83 | +0.5pp $18 | +1.0pp $-48 |
UW: 25.0% down · 7.5% · 30yr · 1.5% tax · 5.0% vac · 8.0% maint · 8.0% mgmt
Financing live
Cash to close
- Down payment
- $62,475
- Closing costs
- $7,497
- Reserves months
- —
- Total cash needed
- —
Loan-product check · same deal, 3 products live
Conventional
25% down · 7.5% · 30yr
- Down + closing
- —
- Monthly P&I
- —
- Monthly cashflow
- —
- DSCR
- —
- Eligible?
- —
Personal DTI + credit; lowest rate.
DSCR
20% down · 8.5% · 30yr
- Down + closing
- —
- Monthly P&I
- —
- Monthly cashflow
- —
- DSCR
- —
- Eligible?
- —
No personal income docs; deal must DSCR.
Hard money
10% down · 12.0% · 12mo
- Down + closing
- —
- Monthly P&I
- —
- Monthly cashflow
- —
- DSCR
- —
- Eligible?
- —
Short-term bridge; refi at stabilization.
Listing history 5 events
-
2026-05-22$249,900 Active
-
2020-02-05soldstatus $126,000 233-char remark
Show marketing remark (233 chars)
Four bedroom two-story home located in a mature neighborhood with large rear yard. Home also features an attached one car garage, eat in kitchen, and storage shed. Seller will pay $3,000 to buyers selling costs with full price offer.
-
2019-11-23$127,900 233-char remark
Show marketing remark (233 chars)
Four bedroom two-story home located in a mature neighborhood with large rear yard. Home also features an attached one car garage, eat in kitchen, and storage shed. Seller will pay $3,000 to buyers selling costs with full price offer.
-
2016-05-31soldstatus $93,500 426-char remark
Show marketing remark (426 chars)
Great two-story in central Lafayette location near shopping, schools and restaurants. All 4 bedrooms on the upper level with a full bath. Living area and den on the main floor with open kitchen and gas range. Nice size back yard for leisure activities. Currently used as an investment property in good condition. Tenants rights until May 31, 2016. Showings require 24hr notice and representative from June Palms to be present.
-
2016-04-06$100,000 426-char remark
Show marketing remark (426 chars)
Great two-story in central Lafayette location near shopping, schools and restaurants. All 4 bedrooms on the upper level with a full bath. Living area and den on the main floor with open kitchen and gas range. Nice size back yard for leisure activities. Currently used as an investment property in good condition. Tenants rights until May 31, 2016. Showings require 24hr notice and representative from June Palms to be present.
ⓘ Source: listings_history table (triggers on properties + properties_extension) + one-shot
backfill from property_details.listing_events for pre-trigger history.
Tax reassessment forecast IN · Partial reset (capped growth)
- Current annual tax
- $1,323 · $110/mo
- Projected year-2 tax
- $1,724 · $144/mo
- Expected delta
- +$400/yr (+$33/mo · 30.3%)
ⓘ Screening estimate from a state-policy table — verify with the county assessor before closing.
Climate risk First Street
- Flood 1/10 Low FEMA zone X (unshaded) · 0% chance over 30 yrs
- Wildfire 1/10 Low
- Heat 3/10 Moderate 7 d/yr ≥101°F today · 18 d/yr by 30 yrs out
- Wind 2/10 Low
- Air quality 2/10 Low 1 unhealthy d/yr today · 2 by 30 yrs out
Nearby sold comps map
Loading sold comps map…
Walkable amenities ~0.75 mi
Loading nearby amenities…
Taxation est. · year 1
- Rental income
- $24,424
- − Mortgage interest
- −$13,998
- − Property taxes
- −$1,323
- − Insurance
- −$1,250
- − Repairs & maintenance
- −$1,954
- − Management
- −$1,954
- − Depreciation
- −$7,270
- Taxable loss
- −$3,325
- Est. tax savings @ 24.0%
- +$798
- After-tax cash flow
- $1,794/yr
For passive investors: Depreciation is non-cash, so a rental often shows a tax loss while cash-flowing — sheltering income. Rental losses are passive: they offset passive income freely, and up to $25,000/yr can offset ordinary (W-2) income if you actively participate and your MAGI is under $100k (phasing out to $0 by $150k); unused losses carry forward. On sale, claimed depreciation is recaptured at up to 25%, and gains may owe capital-gains tax (a 1031 exchange can defer both). Figures are a year-1 estimate at your 24.0% rate — not tax advice; consult a CPA.
Schools (NCES district)
- District
- Lafayette School Corporation
- NCES district ID
- 1805400
- Math proficiency
- 29% ▼ -9.00%
- Reading proficiency
- 34% ▼ -7.00%
- Median HH income
- $39,817
- Composite
- 26.46/100
- National rank
- #7217
- State rank
- #235 of 301 in IN
Livability — Lafayette
- Score
- 74/100
- State rank
- #68
- US rank
- #4374
Category grades
Schools grade is shown separately in the Schools card above.
Census & demographics
- Census place
- Lafayette, IN
- County
- Tippecanoe County · 181,820 people
- City population
- 106,622
- Metro
- Lafayette-West Lafayette, IN
- Population (ZIP)
- 43,561
- Household income
- $68,035
- Rent vs Own
- Severe rent burden
- 1332.0
Population outlook (Tippecanoe County) Hauer SSP2
- Today (2025)
- 215,327 people
- By 2030
- 232,284 · +7.9%
- By 2040
- 266,517 · +23.8%
- By 2050
- 302,826 · +40.6%
- By 2075
- 394,445 · +83.2%
- By 2100
- 463,500 · +115.3%
Race, ethnicity, and origin ACS 2023
- Neighborhood character
- Predominantly White (75%)
- Race & ethnicity
- White 75% Hispanic / Latino 12% Black 8% Two or more races 7% Asian 2%
- Hispanic origin (detail)
- Mexican 9%
- Common ancestry
- Iranian 2% Slovak 2% Italian 2%
- Foreign-born
- 7% · Canada
- Languages at home
- 92% English-only · Spanish 6% Other Indo-European 1% French/Haitian/Cajun 1%
Political lean MEDSL · Tippecanoe
- 2024 margin
- Toss-up / Even · D 49.0% · R 49.1% · Other 1.9%
- 2008→2024 swing
- -11.8pp toward R · 2008: 11.6pp · 2024: -0.1pp
- All cycles
- 2024: R+0.1 2020: D+0.6 2016: R+5.7 2012: R+3.6 2008: D+11.6
Not yet ingested
- Civics
- —
Market trends
- HPI YoY
- ▼ -131.96%
- Current HPI
- 214.2557
- Rent YoY
- ▲ 2.74%
- Metro
- Lafayette-West Lafayette, IN
- State GDP YoY
- ▲ 2.90%
- F500 in state
- 18
Industry mix (Fortune 500 HQ in IN)
| Industry | F500 HQs | Revenue |
|---|---|---|
| Industrial Machinery | 2 | $37B |
|
||
| Healthcare | 1 | $177B |
|
||
| Pharmaceuticals | 1 | $45B |
|
||
| Metals / Steel | 1 | $18B |
|
||
| Agriculture | 1 | $17B |
|
||
| Packaging | 1 | $12B |
|
||
Price history
+149.9% since first listed5 events — show timeline
- 2026-05-22 Listed $249,900 IRMLS
- 2020-02-05 Sold (MLS) $126,000 IRMLS
- 2019-11-23 Listed $127,900 IRMLS
- 2016-05-31 Sold (MLS) $93,500 IRMLS
- 2016-04-06 Listed $100,000 IRMLS
Property tax history
-4.3%/yrLatest (2024): $1,323 · +8.0% YoY. Source: county tax records.
Cash-flow waterfall
monthlySold comps — $/sqft
last 12 mo · ≤1 miLoading sold comps…