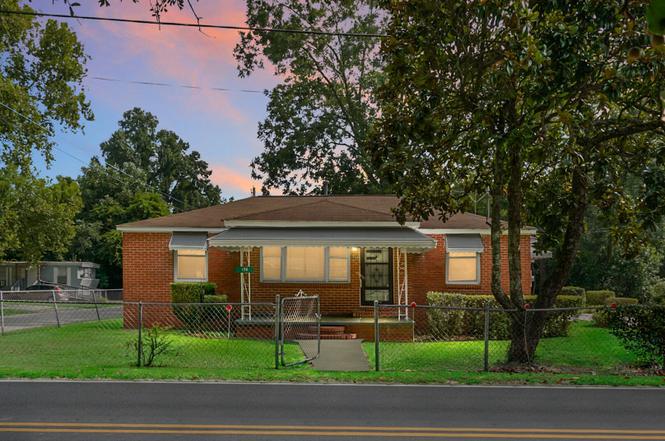
174 Roosevelt Dr · St. Stephen, SC
Flood risk 1/10 · Minimal
- FEMA flood zone
- X (unshaded)
- Chance of flooding over 30 yrs
- 0.0%
- Est. flood insurance / yr
- $507 – $1,088
Fire risk 7/10 · Major
- Est. fire insurance / yr
- $783 – $1,453
Heat risk 8/10 · Major
- Hot days now (above 110°F)
- 7 days/yr
- Hot days in 30 yrs
- 17 days/yr
Wind risk 8/10 · Major
- Chance of severe wind over 30 yrs
- 80.0%
Air-quality risk 4/10 · Minor
- Unhealthy air days now
- 5 days/yr
- Unhealthy air days in 30 yrs
- 5 days/yr
Risk factors via First Street. Map © Google.
Why this score? — see what drove the B- grade
The composite is a weighted blend of 9 inputs, each scored 0–100. Each bar is that input's sub-score; the figure is the points it added to the 100-point composite (weight × sub-score).
- Cash flow +19.7/30.0
- ARV discount +15.0/15.0
- Appreciation +9.2/10.0
- DSCR +6.2/10.0
- 1% rule +5.0/10.0
- Schools +3.6/10.0
- Rent growth +2.5/5.0
- Livability +2.5/5.0
- Condition / age +2.5/5.0
$150,000
🖨 Deal sheet 📄 Offer letter ✓ Due diligence
Listing remarks
Here's your chance to own a beautiful brick home on a spacious double lot! This property boasts a large driveway with plenty of parking, as well as a separate three-car garage - perfect for your toys, tools, or workshop needs. Conveniently located close to everything the town of Saint Stephen has to offer, this home is still only about a 20-minute drive to Main Street in Moncks Corner. Plus, you're just 10 minutes from the lake, without having to worry about where to store your boat. That's right, there's no HOA, so you won't have to worry about any restrictions or fines!At first glance, this house is ready to go! But it does need some updates. And one or two significant repairs. So this s
Key facts
- Close to town
- Large driveway
- Three-car garage
Tags
Property features AI
Exterior
- Parking: 3-car garage; 3 total parking spaces
- Utilities: Public sewer; BCW & SA water service; Berkeley Electric Cooperative power
- Home design: Single-family detached home; One story
- Construction: Asphalt roof
- Exterior features: Chain link fencing; .5 to 1 acre lot; Shed(s)
Interior
- Kitchen: Dishwasher; Microwave; Refrigerator
- Bedrooms: 3 bedrooms; Master bedroom with ceiling fan(s)
- Flooring: Wood flooring
- Bathrooms: 1 bathroom
- Heating & cooling: Heat pump heating; Central air; Window unit(s)
- Interior features: Eat-in kitchen; Family room with fireplace; Basement
Neighborhood map
What this means for you Summary
Snapshot
- This is a 3-bed/1.0-bath single-family listed at $150k.
Deal economics
- At list price, monthly cash flow is $175 ($2k/yr) — positive.
- The deal already cash-flows at list — no discount required.
- To meet the 1% rule (rent ≥ 1% of price), the offer needs to be $150k (0.1% below list).
- Recommended offer: $132k (12.0% below list) — sets the bar for market timing.
Location & tenants
- Location reads: area grade B — affects rentability + tenant quality, not the cash-flow math above.
- Berkeley 01 (suburban): math 35% / reading 48% proficiency, ranked #30 of 80 in SC (top 38%) — families likely to look elsewhere, expect single-tenant / working-renter base with shorter leases.
- Zoned schools: St. Stephen Elementary (math 12% / reading 27%, grade F, #499 of 597 statewide, top 84%, 291 students, 100% FRL); St. Stephen Middle (math 2% / reading 22%, grade F, #216 of 229 statewide, top 96%, 209 students, 100% FRL); Timberland High (math 17% / reading 72%, grade F, #166 of 196 statewide, top 87%, 704 students, 100% FRL) — zoned schools average 100% FRL vs 48% district-wide (52 pts higher); higher-poverty schools than district average — tighter screening recommended.
- Zoned-school proficiency averages 25% at this address vs 42% district-wide (-16 pts) — the specific schools serving this property underperform the Berkeley 01 average; the district grade overstates school quality for this exact location.
- Market conditions: 53 active listings in the ZIP; 3,183 units permitted in Berkeley County in 2024 (580 in 5+ unit buildings).
Forward outlook
- In year one you build about $14k of equity ($1k loan paydown + $13k appreciation (8.4% local appreciation)).
- Berkeley County population projected at +48% by 2050 — long-run rental-demand tailwind backs the buy-and-hold thesis.
- At projected returns (8.4% appreciation + 3.0% rent growth), your $42k cash investment doubles in ~3 years — after that, you're playing with house money.
- By year 3, paydown + projected appreciation supports a ~$34k cash-out refi (75% LTV) — recoverable capital for the next deal without selling this one.
Negotiation context
- It's been on market 305 days — a 12% lower offer ($132k) is reasonable based on typical stale-listing flexibility.
- 3 sale attempts; this cycle's ask has dropped $45k (23%) from the opening price — seller is motivated, your offer sets the floor, not the list.
Risks & watch-outs
- Climate carrying-cost: severe wind risk, 80% chance of damaging wind over 30y; major wildfire risk; extreme-heat days projected 7→17/yr by 2055 (HVAC capex compounding) — expect insurance premiums to compound above CPI over the hold.
Questions for the listing agent
- It's been on market 305 days. Have you received any prior offers? Is the seller open to a 12% concession, seller financing, or rate buy-down credit?
- Built in 1960 — when were the roof, HVAC, electrical panel, plumbing, and water heater last replaced?
- Why hasn't it sold? Are there any deal-killer items the seller is aware of (foundation, flood, title, zoning, code violations)?
- Is there a deadline driving the sale (1031 exchange, divorce, estate, relocation)? That informs how much negotiation room exists.
- What's the average days-on-market for RENTAL listings here right now (not sales)? A rising rental-DOM trend means longer vacancies and softer asking-rent achievability than the comps imply.
- What's the recent tenant-quality profile in this submarket — average credit score on applications, eviction rate, late-payment / NSF rate, and stable-employment percentage? A property-management company in the area should have these aggregated.
- How much new for-sale + rental construction is in the pipeline within 1–3 miles? Heavy new supply typically softens prices + rents 12–24 months out; constrained supply supports both.
Investment metrics
- 1% rule
- 1.00% ✗
- Cap rate
- 7.70%
- Cash-on-cash
- 5.01%
- DSCR
- 1.22
- GRM
- 8.3
CMA / ARV
- ARV (on-the-fly)
- $281,960
- Comps found
- 2
Show comp detail 2 sales within ~0.75 mi
| Address | Dist | Beds/Ba | Sqft | Sold | Price | $/sf | Match |
|---|---|---|---|---|---|---|---|
| 145 Ravenell Dr | 0.47mi | 2/1.0 (-1) | 1,048 (-2%) | 6mo | $150,000 | $143 | 65 |
| 1110 Graham St | 0.66mi | 3/2.0 | 1,065 (+0%) | 23mo | $282,000 | $265 | 46 |
Match score weights: distance 35% · size 25% · config 20% · recency 20%. Top-matched comps best support the ARV.
Projected returns pro-forma
8.39% appreciation · 3.0% rent growth · sell at horizon
- IRR
- 24.6%
- Equity multiple
- 2.83×
- Total profit
- $76,685
- Equity at exit
- $117,917
- IRR
- 22.2%
- Equity multiple
- 6.11×
- Total profit
- $214,441
- Equity at exit
- $237,944
Cash invested: $42,000 (down + closing). Projections, not guarantees.
Landlord ↔ Tenant lean methodology
- Overall (STATE)
- 90 Strongly Landlord-Friendly
- State South Carolina
- 90 Strongly Landlord-Friendly · R+6
- County
- — inherits STATE
- City
- — inherits STATE
ZIP-level market 29479
- Home prices YoY
- 2.6%
- Active inventory
- 53
- Price-to-rent
- 8.3×
Monthly cashflow live
- Estimated rent
- $1,498 medium interval (Pro) →
- Mortgage (P&I)
- −$787
- Tax from tax record
- −$159 /mo · $1,907/yr
- Insurance
- −$62
- HOA
- −$0
- Vacancy / Maint / Mgmt
- −$315
- Net cashflow
- $175
Break-even live
UW: 25.0% down · 7.5% · 30yr · 1.5% tax · 5.0% vac · 8.0% maint · 8.0% mgmt
Financing live
Cash to close
- Down payment
- $37,500
- Closing costs
- $4,500
- Reserves months
- —
- Total cash needed
- —
Loan-product check · same deal, 3 products live
Conventional
25% down · 7.5% · 30yr
- Down + closing
- —
- Monthly P&I
- —
- Monthly cashflow
- —
- DSCR
- —
- Eligible?
- —
Personal DTI + credit; lowest rate.
DSCR
20% down · 8.5% · 30yr
- Down + closing
- —
- Monthly P&I
- —
- Monthly cashflow
- —
- DSCR
- —
- Eligible?
- —
No personal income docs; deal must DSCR.
Hard money
10% down · 12.0% · 12mo
- Down + closing
- —
- Monthly P&I
- —
- Monthly cashflow
- —
- DSCR
- —
- Eligible?
- —
Short-term bridge; refi at stabilization.
Listing history 21 events
-
2026-06-18days on market $150,000 Active 305 DOM
-
2026-06-17days on market $150,000 Active 304 DOM
-
2026-06-16days on market $150,000 Active 303 DOM
-
2026-06-15days on market $150,000 Active 302 DOM
-
2026-06-13days on market $150,000 Active 300 DOM
-
2026-06-13days on market $150,000 Active 299 DOM
-
2026-06-10days on market $150,000 Active 297 DOM
-
2026-06-09days on market $150,000 Active 296 DOM
-
2026-06-08days on market $150,000 Active 295 DOM
-
2026-06-07days on market $150,000 Active 294 DOM
-
2026-06-05days on market $150,000 Active 291 DOM
-
2026-06-03days on market $150,000 Active 290 DOM
-
2026-06-03days on market $150,000 Active 289 DOM
-
2026-06-01days on market $150,000 Active 288 DOM
-
2026-05-31days on market $150,000 Active 287 DOM
-
2026-03-24status Active
-
2026-03-24price $150,000
-
2026-03-02historical Active Under Contract
-
2026-02-16status Active
-
2026-02-16historical
-
2025-08-15$195,000 Active
ⓘ Source: listings_history table (triggers on properties + properties_extension) + one-shot
backfill from property_details.listing_events for pre-trigger history.
Tax reassessment forecast SC · Resets to sale price
- Current annual tax
- $1,907 · $159/mo
- Projected year-2 tax
- $1,907 · $159/mo
- Expected delta
- $0/yr ($0/mo · 0.0%)
ⓘ Screening estimate from a state-policy table — verify with the county assessor before closing.
Climate risk First Street
- Flood 1/10 Low FEMA zone X (unshaded) · 0% chance over 30 yrs
- Wildfire 7/10 Severe
- Heat 8/10 Severe 7 d/yr ≥110°F today · 17 d/yr by 30 yrs out
- Wind 8/10 Severe 80% chance of damaging wind over 30 yrs
- Air quality 4/10 Moderate 5 unhealthy d/yr today · 5 by 30 yrs out
Nearby sold comps map
Loading sold comps map…
Walkable amenities ~0.75 mi
Loading nearby amenities…
Taxation est. · year 1
- Rental income
- $17,975
- − Mortgage interest
- −$8,402
- − Property taxes
- −$1,907
- − Insurance
- −$750
- − Repairs & maintenance
- −$1,438
- − Management
- −$1,438
- − Depreciation
- −$4,364
- Taxable loss
- −$324
- Est. tax savings @ 24.0%
- +$78
- After-tax cash flow
- $2,182/yr
For passive investors: Depreciation is non-cash, so a rental often shows a tax loss while cash-flowing — sheltering income. Rental losses are passive: they offset passive income freely, and up to $25,000/yr can offset ordinary (W-2) income if you actively participate and your MAGI is under $100k (phasing out to $0 by $150k); unused losses carry forward. On sale, claimed depreciation is recaptured at up to 25%, and gains may owe capital-gains tax (a 1031 exchange can defer both). Figures are a year-1 estimate at your 24.0% rate — not tax advice; consult a CPA.
Schools (NCES district)
- District
- Berkeley 01
- NCES district ID
- 4501170
- Math proficiency
- 35% ▼ -8.00%
- Reading proficiency
- 48% ▼ -2.00%
- Median HH income
- $52,724
- Composite
- 35.95/100
- National rank
- #4799
- State rank
- #30 of 80 in SC
Livability — St. Stephen
No livability data for this city. (Only ~50 U.S. cities are tracked.)
Census & demographics
- Census place
- St. Stephen, SC
- Population (ZIP)
- 6,287
Population outlook (Berkeley County) Hauer SSP2
- Today (2025)
- 254,184 people
- By 2030
- 279,677 · +10.0%
- By 2040
- 329,379 · +29.6%
- By 2050
- 375,557 · +47.8%
- By 2075
- 476,740 · +87.6%
- By 2100
- 535,945 · +110.8%
Race, ethnicity, and origin ACS 2023
- Neighborhood character
- Diverse neighborhood (Simpson 0.61)
- Race & ethnicity
- Black 45% White 42% Hispanic / Latino 11% Two or more races 2%
- Hispanic origin (detail)
- Mexican 3% Puerto Rican 3%
- Common ancestry
- Italian 1% Slovak 1% Serbian 1%
- Foreign-born
- 1% · Canada
- Languages at home
- 91% English-only · Spanish 8%
Political lean MEDSL · Berkeley
- 2024 margin
- R (+16.3) · D 41.1% · R 57.4% · Other 1.4%
- 2008→2024 swing
- -3.2pp toward R · 2008: -13.1pp · 2024: -16.3pp
- All cycles
- 2024: R+16.3 2020: R+11.7 2016: R+17.4 2012: R+18.9 2008: R+13.1
Not yet ingested
- Civics
- —
Market trends
- HPI YoY
- ▲ 8.39%
- Current HPI
- 333.0749
- Rent YoY
- —
- Metro
- —
- State GDP YoY
- ▲ 4.51%
- F500 in state
- 2
Industry mix (Fortune 500 HQ in SC)
| Industry | F500 HQs | Revenue |
|---|---|---|
| Packaging | 1 | $7B |
|
||
Price history
-23.1% since first listed6 events — show timeline
- 2026-03-24 Relisted — Charleston Trident MLS
- 2026-03-24 Price Changed $150,000 Charleston Trident MLS
- 2026-03-02 Contingent — Charleston Trident MLS
- 2026-02-16 Relisted — Charleston Trident MLS
- 2026-02-16 Listing Removed — Charleston Trident MLS
- 2025-08-15 Listed $195,000 Charleston Trident MLS
Property tax history
+20.9%/yrLatest (2025): $1,907 · +385.6% YoY. Source: county tax records.
Cash-flow waterfall
monthlySold comps — $/sqft
last 12 mo · ≤1 miLoading sold comps…