 38-Plex
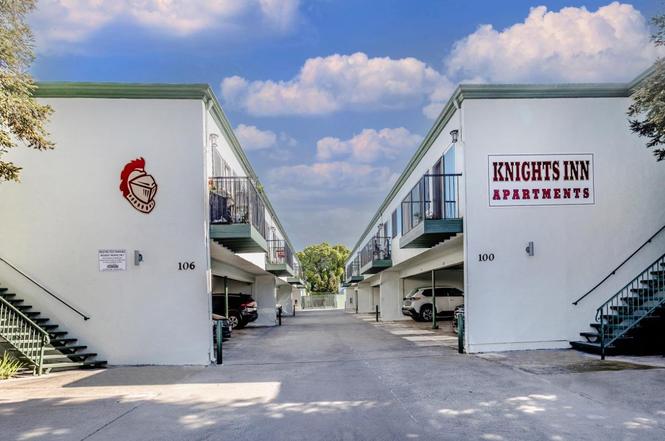
100-106 N Bayshore Blvd · San Mateo, CA
Flood risk 9/10 · Severe
- FEMA flood zone
- AE
- Chance of flooding over 30 yrs
- 0.99%
- Est. flood insurance / yr
- $1,737 – $8,500
Fire risk 1/10 · Minimal
- Est. fire insurance / yr
- $659 – $1,223
Heat risk 2/10 · Minimal
- Hot days now (above 85°F)
- 8 days/yr
- Hot days in 30 yrs
- 17 days/yr
Wind risk 1/10 · Minimal
- Chance of severe wind over 30 yrs
- —
Air-quality risk 7/10 · Major
- Unhealthy air days now
- 12 days/yr
- Unhealthy air days in 30 yrs
- 12 days/yr
Risk factors via First Street. Map © Google.
Why this score? — see what drove the B grade
The composite is a weighted blend of 9 inputs, each scored 0–100. Each bar is that input's sub-score; the figure is the points it added to the 100-point composite (weight × sub-score).
- Cash flow +30.0/30.0
- 1% rule +10.0/10.0
- DSCR +10.0/10.0
- ARV discount +7.5/15.0
- Schools +5.7/10.0
- Livability +4.0/5.0
- Rent growth +3.6/5.0
- Condition / age +2.5/5.0
- Appreciation +0.0/10.0
$9,450,000
🖨 Deal sheet 📄 Offer letter ✓ Due diligence
Multi-family units
County records classify this as Multi-Family (5+ Unit). Listing-text estimate: 38 units. confirmed
5+ unit building — per-unit beds/baths from public records are typically unavailable; the breakdown below (if shown) is an estimate from the listing text.
Listing remarks MLS
Knights Inn Apartments, located at 100-106 N. Bayshore Boulevard in San Mateo, presents a rare 38-unit multifamily investment opportunity in San Mateo. The property offers a unit mix of thirty-four (34) studios (~381 sqft) and four (4) 1-Bedroom/1-Bath units (~570 sqft). Constructed in 1960 and situated on a 24,944 sqft lot, with approximately 24,592 sqft of gross building area across two (2) buildings. SB-721 COMPLIANT, BALCONY REBUILD COMPLETED, eliminating a significant capital expenditure obligation and providing investors with a clean compliance profile at close. The property further features a secured fenced-in pool, on-site coin-operated laundry, and 36 covered carports + 4 uncovered assigned spaces. Gas and electric utilities are master metered for each building, presenting a direct value-add opportunity through implementation of a Ratio Utility Billing System (RUBS), a strategy not currently utilized under existing ownership. The pro forma reflects an estimated $45,600 in additional RUBS income upon implementation.Current rents averaging approximately $1,610/month for studios and $2,085/month for 1-Bed/1-Bath units reflect meaningful upside to market rents of $2,100 and $2,395 respectively, as validated by the nearby Country Club Apartments at 420 N. Bayshore Boulevard.
Key facts
- Covered carports
- Sb-721 compliant
- 0.57 acre lot
Tags
Property features AI
Finance
- Other: Landscaping expense reported; Trash and utility expenses reported
- Financial info: Complex of at least 38 units; Annual rental income listed; Annual gross income listed; Gross scheduled income listed; Other income and expense items reported; Total expenses reported; Vacancy factor reported
- HOA & community: Community pool
Exterior
- Parking: Assigned spaces; Carport parking (36 carport spaces minimum); Off-street parking; Total of 4 parking spaces listed
- Security: Separate meters for common areas and units (water/electric/gas)
- Utilities: Public sewer (connected); Public water; Individual electric meters; Individual gas meters; Separate common-area electric and water meters
- Home design: Limited partnership ownership; Two buildings
- Construction: Wood-frame construction; Concrete slab foundation; Flat/low-pitch tar and gravel roof
- Exterior features: Fenced pool; Community pool available; Property zoned Commercial Multifamily; Tenant pays electric and gas utilities
Interior
- Kitchen: Marble countertops; Electric oven/range; Pantry; Refrigerator (varies by unit)
- Bedrooms: Some units are 1-bedroom
- Flooring: Laminate flooring; Vinyl/linoleum flooring
- Bathrooms: One full bathroom in 1-bedroom unit type
- Heating & cooling: Wall furnace heating; Ceiling fan cooling
- Interior features: Coin-operated laundry; Ceiling fans; Wall furnaces
- Laundry & utility: Coin-operated laundry
Neighborhood map
What this means for you Summary
Snapshot
- This is a 34×4bd/4.0ba + 4×1bd/1.0ba units multifamily listed at $9.45M.
Deal economics
- At list price, monthly cash flow is $93k ($1.11M/yr) — positive. Per door: $2k/mo.
- The deal already cash-flows at list — no discount required.
- Meets the 1% rule at list price ($191k rent vs $9.45M).
- Cap rate 18.1% vs local median 1.2% in San Mateo — top-decile yield for the area; either an underpriced asset or a hidden risk that comps aren't pricing in. Stress-test before assuming the spread holds.
Location & tenants
- Location reads 79/100 on livability (#56 in CA, #2,095 nationally) — a middle-class / working-renter tenant base. Strengths: amenities A+, commute A+, employment A+; Watch: cost of living F.
- San Mateo Union High (suburban): math 50% / reading 70% proficiency, ranked #178 of 1,400 in CA (top 13%) — acceptable for families but not a draw, mixed tenant base, ~2y average lease.
- Zoned schools: San Mateo High (1,613 students, 29% FRL).
- Market conditions: Rents rising fast (+4.6%/yr); 58 active listings in the ZIP; high-income renter base; 1,019 units permitted in San Mateo County in 2024 (484 in 5+ unit buildings).
- At $190,512/mo this rent would consume 1870% of the median local household income ($122k/yr) (locally 2173% of renters already pay >50% of income on rent) — very limited rent-growth headroom before tenants either downsize or default.
Forward outlook
- Local home prices are declining (-3.0%/yr); year-one equity from $65k of loan paydown is wiped out by about $284k of value loss. Plan a longer hold.
- San Mateo County population projected at +24% by 2050 — long-run rental-demand tailwind backs the buy-and-hold thesis.
- At projected returns (-3.0% appreciation + 4.6% rent growth), your $2.65M cash investment doubles in ~3 years — after that, you're playing with house money.
Negotiation context
- Only 8 days on market — expect competitive offers; lowballing is unlikely to land.
- 2 sale attempts with the ask held roughly flat each time — persistent listings suggest the price (not the market) is what's stuck; bring a comps-based counter.
- Current owner paid $1.95M; list at $9.45M implies a 385% gain — meaningful room to come down on a strong offer.
Risks & watch-outs
- Watch-outs: flood insurance adds $427/mo.
- Climate carrying-cost: in FEMA flood zone AE (mandatory federal flood insurance) — expect insurance premiums to compound above CPI over the hold.
Questions for the listing agent
- Can we see the unit-by-unit rent roll, current vacancy, and any below-market leases? What's the average tenancy length?
- What capital expenditures (roof, boiler, parking lot, exteriors) have been made in the last 5 years, and what's planned in the next 2?
- Built in 1960 — when were the roof, HVAC, electrical panel, plumbing, and water heater last replaced?
- What's the actual annual flood-insurance premium (NFIP or private), and is the property in a SFHA with mandatory coverage?
- Is there a deadline driving the sale (1031 exchange, divorce, estate, relocation)? That informs how much negotiation room exists.
- Schools are B-rated — typically a magnet for longer-tenancy family renters. What's the average tenant stay here, and is there a school-zone premium baked into asking?
- What's the average days-on-market for RENTAL listings here right now (not sales)? A rising rental-DOM trend means longer vacancies and softer asking-rent achievability than the comps imply.
- What's the recent tenant-quality profile in this submarket — average credit score on applications, eviction rate, late-payment / NSF rate, and stable-employment percentage? A property-management company in the area should have these aggregated.
- How much new apartment / multifamily construction is in the pipeline within 1–3 miles? Heavy new supply (>2% of stock underway) typically softens rents 12–24 months out; light construction supports rent growth.
Investment metrics
- 1% rule
- 2.02% ✓
- Cap rate
- 18.14%
- Cash-on-cash
- 42.32%
- DSCR
- 2.88
- GRM
- 4.1
CMA / ARV
No comps found within radius.
Projected returns pro-forma
-3.0% appreciation · 4.57% rent growth · sell at horizon
- IRR
- 40.5%
- Equity multiple
- 2.77×
- Total profit
- $4,688,389
- Equity at exit
- $1,409,026
- IRR
- 47.5%
- Equity multiple
- 5.91×
- Total profit
- $12,987,778
- Equity at exit
- $817,063
Cash invested: $2,646,000 (down + closing). Projections, not guarantees.
Landlord ↔ Tenant lean methodology
- Overall (STATE)
- 18 Strongly Tenant-Friendly
- State California
- 18 Strongly Tenant-Friendly · D+13
- County
- — inherits STATE
- City
- — inherits STATE
ZIP-level market 94401
- Rents YoY
- 4.6%
- Active inventory
- 58
- Price-to-rent
- 149.6×
Monthly cashflow live
- Estimated rent
- $190,512 medium interval (Pro) →
- Mortgage (P&I)
- −$49,557
- Tax from tax record
- −$3,698 /mo · $44,381/yr
- Insurance
- −$3,938
- Flood insurance flood zone
- −$427 /mo · $5,118/yr
- HOA
- −$0
- Vacancy / Maint / Mgmt
- −$40,008
- Net cashflow
- $92,885
Break-even live
38-unit breakdown (identical units grouped — click to expand)
| Units | Beds | Baths | Est. rent |
|---|---|---|---|
| 34× units | 4 | 4 | $178,976 |
| #1 | 4 | 4 | $5,264 |
| #2 | 4 | 4 | $5,264 |
| #3 | 4 | 4 | $5,264 |
| #4 | 4 | 4 | $5,264 |
| #5 | 4 | 4 | $5,264 |
| #6 | 4 | 4 | $5,264 |
| #7 | 4 | 4 | $5,264 |
| #8 | 4 | 4 | $5,264 |
| #9 | 4 | 4 | $5,264 |
| #10 | 4 | 4 | $5,264 |
| #11 | 4 | 4 | $5,264 |
| #12 | 4 | 4 | $5,264 |
| #13 | 4 | 4 | $5,264 |
| #14 | 4 | 4 | $5,264 |
| #15 | 4 | 4 | $5,264 |
| #16 | 4 | 4 | $5,264 |
| #17 | 4 | 4 | $5,264 |
| #18 | 4 | 4 | $5,264 |
| #19 | 4 | 4 | $5,264 |
| #20 | 4 | 4 | $5,264 |
| #21 | 4 | 4 | $5,264 |
| #22 | 4 | 4 | $5,264 |
| #23 | 4 | 4 | $5,264 |
| #24 | 4 | 4 | $5,264 |
| #25 | 4 | 4 | $5,264 |
| #26 | 4 | 4 | $5,264 |
| #27 | 4 | 4 | $5,264 |
| #28 | 4 | 4 | $5,264 |
| #29 | 4 | 4 | $5,264 |
| #30 | 4 | 4 | $5,264 |
| #31 | 4 | 4 | $5,264 |
| #32 | 4 | 4 | $5,264 |
| #33 | 4 | 4 | $5,264 |
| #34 | 4 | 4 | $5,264 |
| 4× units | 1 | 1 | $11,536 |
| #35 | 1 | 1 | $2,884 |
| #36 | 1 | 1 | $2,884 |
| #37 | 1 | 1 | $2,884 |
| #38 | 1 | 1 | $2,884 |
| Total (38 units) | $190,512 | ||
UW: 25.0% down · 7.5% · 30yr · 1.5% tax · 5.0% vac · 8.0% maint · 8.0% mgmt
Financing live
Cash to close
- Down payment
- $2,362,500
- Closing costs
- $283,500
- Reserves months
- —
- Total cash needed
- —
Loan-product check · same deal, 3 products live
Conventional
25% down · 7.5% · 30yr
- Down + closing
- —
- Monthly P&I
- —
- Monthly cashflow
- —
- DSCR
- —
- Eligible?
- —
Personal DTI + credit; lowest rate.
DSCR
20% down · 8.5% · 30yr
- Down + closing
- —
- Monthly P&I
- —
- Monthly cashflow
- —
- DSCR
- —
- Eligible?
- —
No personal income docs; deal must DSCR.
Hard money
10% down · 12.0% · 12mo
- Down + closing
- —
- Monthly P&I
- —
- Monthly cashflow
- —
- DSCR
- —
- Eligible?
- —
Short-term bridge; refi at stabilization.
Listing history 7 events
-
2026-06-18days on market $9,450,000 Active 8 DOM
-
2026-06-17days on market $9,450,000 Active 7 DOM
-
2026-06-16days on market $9,450,000 Active 6 DOM
-
2026-06-15days on market $9,450,000 Active 5 DOM
-
2026-06-13days on market $9,450,000 Active 3 DOM
-
2026-06-13remarks 699-char remark
-
2026-06-13$9,450,000 Active 2 DOM
ⓘ Source: listings_history table (triggers on properties + properties_extension) + one-shot
backfill from property_details.listing_events for pre-trigger history.
Tax reassessment forecast CA · Resets to sale price
- Current annual tax
- $44,381 · $3,698/mo
- Projected year-2 tax
- $71,820 · $5,985/mo
- Expected delta
- +$27,439/yr (+$2,287/mo · 61.8%)
ⓘ Screening estimate from a state-policy table — verify with the county assessor before closing.
Climate risk First Street
- Flood 9/10 Extreme FEMA zone AE · 99% chance over 30 yrs
- Wildfire 1/10 Low
- Heat 2/10 Low 8 d/yr ≥85°F today · 17 d/yr by 30 yrs out
- Wind 1/10 Low
- Air quality 7/10 Severe 12 unhealthy d/yr today · 12 by 30 yrs out
Nearby sold comps map
Loading sold comps map…
Walkable amenities ~0.75 mi
Loading nearby amenities…
Taxation est. · year 1
- Rental income
- $2,286,144
- − Mortgage interest
- −$529,347
- − Property taxes
- −$44,381
- − Insurance
- −$52,368
- − Repairs & maintenance
- −$182,892
- − Management
- −$182,892
- − Depreciation
- −$274,909
- Taxable income
- $1,019,355
- Est. tax owed @ 24.0%
- −$244,645
- After-tax cash flow
- $869,977/yr
For passive investors: Depreciation is non-cash, so a rental often shows a tax loss while cash-flowing — sheltering income. Rental losses are passive: they offset passive income freely, and up to $25,000/yr can offset ordinary (W-2) income if you actively participate and your MAGI is under $100k (phasing out to $0 by $150k); unused losses carry forward. On sale, claimed depreciation is recaptured at up to 25%, and gains may owe capital-gains tax (a 1031 exchange can defer both). Figures are a year-1 estimate at your 24.0% rate — not tax advice; consult a CPA.
Schools (NCES district)
- District
- San Mateo Union High
- NCES district ID
- 0634980
- Math proficiency
- 50% ▼ -2.00%
- Reading proficiency
- 70% ▼ -1.00%
- Median HH income
- $96,956
- Composite
- 57.13/100
- National rank
- #2338
- State rank
- #178 of 1400 in CA
Livability — San Mateo
- Score
- 79/100
- State rank
- #56
- US rank
- #2095
Category grades
Schools grade is shown separately in the Schools card above.
Census & demographics
- Census place
- San Mateo, CA
- County
- San Mateo County · 733,415 people
- City population
- 104,046
- Metro
- San Francisco-Oakland-Berkeley, CA
- Population (ZIP)
- 35,295
- Household income
- $122,227
- Rent vs Own
- Severe rent burden
- 2173.0
Population outlook (San Mateo County) Hauer SSP2
- Today (2025)
- 864,008 people
- By 2030
- 910,523 · +5.4%
- By 2040
- 997,285 · +15.4%
- By 2050
- 1,071,189 · +24.0%
- By 2075
- 1,197,206 · +38.6%
- By 2100
- 1,192,523 · +38.0%
Race, ethnicity, and origin ACS 2023
- Neighborhood character
- Highly diverse neighborhood (Simpson 0.73)
- Race & ethnicity
- Hispanic / Latino 38% White 26% Asian 24% Two or more races 17% Pacific Islander 3% Native American 3% Black 1%
- Hispanic origin (detail)
- Mexican 19%
- Common ancestry
- Slovak 2% Italian 1% Scotch-Irish 1%
- Foreign-born
- 42% · Canada, China, South Korea
- Languages at home
- 45% English-only · Spanish 31% Chinese 8% Other Indo-European 5%
Political lean MEDSL · San Mateo
- 2024 margin
- Solid D (+50.3) · D 73.5% · R 23.2% · Other 3.3%
- 2008→2024 swing
- +1.6pp toward D · 2008: 48.7pp · 2024: 50.3pp
- All cycles
- 2024: D+50.3 2020: D+57.7 2016: D+57.7 2012: D+44.8 2008: D+48.7
Not yet ingested
- Civics
- —
Market trends
- HPI YoY
- ▼ -996.13%
- Current HPI
- 338.0203
- Rent YoY
- ▲ 4.57%
- Metro
- San Francisco-Oakland-Berkeley, CA
- State GDP YoY
- ▲ 3.21%
- F500 in state
- 116
Industry mix (Fortune 500 HQ in CA)
| Industry | F500 HQs | Revenue |
|---|---|---|
| Technology | 27 | $1,492B |
|
||
| Financial Services | 3 | $174B |
|
||
| Retail | 3 | $44B |
|
||
| Insurance | 3 | $26B |
|
||
| Media / Entertainment | 2 | $115B |
|
||
| Pharmaceuticals / Biotech | 2 | $62B |
|
||
Price history
+384.6% since first listed3 events — show timeline
- 2026-06-10 Listed $9,450,000 MLSListings
- 2026-06-10 Listed $9,450,000 bridgeMLS, Bay East AOR, or Contra Costa AOR
- 1998-08-06 Sold (Public Records) $1,950,000 Public Records
Property tax history
+5.6%/yrLatest (2025): $44,381 · -2.4% YoY. Source: county tax records.
Cash-flow waterfall
monthlySold comps — $/sqft
last 12 mo · ≤1 miLoading sold comps…