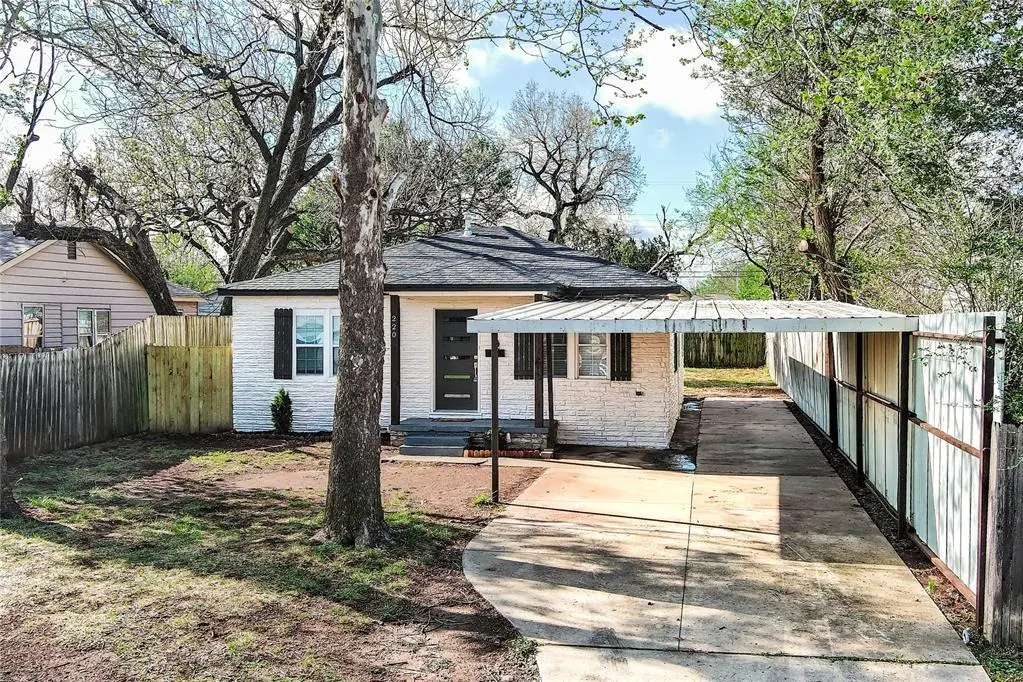
220 SE 53rd St · Oklahoma City, OK
Flood risk 1/10 · Minimal
- FEMA flood zone
- X (unshaded)
- Chance of flooding over 30 yrs
- 0.0%
- Est. flood insurance / yr
- $507 – $1,088
Fire risk 1/10 · Minimal
- Est. fire insurance / yr
- $2,463 – $4,575
Heat risk 6/10 · Moderate
- Hot days now (above 107°F)
- 7 days/yr
- Hot days in 30 yrs
- 19 days/yr
Wind risk 2/10 · Minimal
- Chance of severe wind over 30 yrs
- 4.0%
Air-quality risk 1/10 · Minimal
- Unhealthy air days now
- 0 days/yr
- Unhealthy air days in 30 yrs
- 0 days/yr
Risk factors via First Street. Map © Google.
Why this score? — see what drove the F grade
The composite is a weighted blend of 9 inputs, each scored 0–100. Each bar is that input's sub-score; the figure is the points it added to the 100-point composite (weight × sub-score).
- Cash flow +8.5/30.0
- Appreciation +5.9/10.0
- Livability +4.0/5.0
- Rent growth +2.5/5.0
- Condition / age +2.5/5.0
- DSCR +2.3/10.0
- 1% rule +1.7/10.0
- Schools +0.7/10.0
- ARV discount +0.0/15.0
$150,000
🖨 Deal sheet (PDF) 📄 Offer letter ✓ Due diligence
Listing remarks MLS
Excellent Investment Opportunity in OKC! This property needs some TLC but it appears to have good bones. New roof installed in June 2025. Property is a 2 bed / 1 bath with the option of finishing the back porch conversion to add an additional 200+ SQ FT. The property has a sturdy metal 2 car carport and additional parking on side of house for up to 4 car parking. Large back yard with mutiple outbuildings for extra storage. Property to be sold As - Is with no repairs.
Key facts
- New plumbing
- New water heater
- Large laundry room
Tags
Property features AI
Finance
- Other: Existing property; Homestead not claimed
- Financial info: Listing terms: Cash or Conventional; Loan qualification: Yes
- HOA & community: No mandatory association dues
Exterior
- Parking: Concrete parking
- Security: Smoke alarm
- Utilities: Cable available; Electricity available; Natural gas available; Public water/sewer
- Home design: Single family residence; One level; Property faces north; Residential property
- Construction: Frame and masonry veneer construction; Composition roof (roof updated 2025); Conventional foundation
- Exterior features: Covered porch; Outbuildings; Interior lot
Interior
- Kitchen: Free‑standing gas range and oven; Microwave
- Bedrooms: 3 bedrooms
- Flooring: Combination flooring
- Bathrooms: 1 full bathroom
- Heating & cooling: Smoke alarm
- Interior features: Ceiling fan(s); Microwave
- Laundry & utility: Inside utility
Neighborhood map
What this means for you Summary
Snapshot
- This is a 2-bed/1.0-bath single-family listed at $150k.
Deal economics
- At list price, monthly cash flow is $-133 ($-2k/yr) — negative.
- To cash-flow at today's rent, offer at most $127k (15.6% below list).
- To meet the 1% rule (rent ≥ 1% of price), the offer needs to be $100k (33.3% below list).
- Recommended offer: $100k (33.3% below list) — sets the bar for 1% rule.
- Cap rate 5.2% vs local median 3.7% in Oklahoma City — top-decile yield for the area; either an underpriced asset or a hidden risk that comps aren't pricing in. Stress-test before assuming the spread holds.
Location & tenants
- Location reads 80/100 on livability (#3 in OK, #1,635 nationally) — a professional / high-income tenant draw. Strengths: amenities A+, commute A+, cost of living A+; Watch: crime F.
- Oklahoma City (urban): math 7% / reading 10% proficiency, ranked #254 of 270 in OK (top 94%) — low school quality limits family demand, transient renter base, plan for 1-2y turnover; 82% free/reduced lunch — lower-income household profile, screen leases tightly.
- Zoned schools: Hayes Es (math 12% / reading 8%, grade F, #711 of 845 statewide, top 87%, 450 students, 0% FRL); Classen Ms of Advanced Studies (math 35% / reading 46%, grade F, #6 of 345 statewide, top 1%, 855 students, 0% FRL); Capitol Hill Hs (math 2% / reading 4%, grade F, #444 of 447 statewide, top 99%, 1,455 students, 0% FRL) — zoned schools average 0% FRL vs 82% district-wide (82 pts lower); this property's tenant base skews higher-income than the district average.
- Market conditions: 84 active listings in the ZIP; 39 comparable units currently listed for rent nearby; rentals at typical pace (median 26d on market — plan ~3-4 weeks tenant-placement turnaround); 41% of comp listings sitting > 30 days — soft ceiling on asking rent; 5,365 units permitted in Oklahoma County in 2024 (569 in 5+ unit buildings).
Forward outlook
- In year one you build about $4k of equity ($1k loan paydown + $3k appreciation (1.8% local appreciation)).
- Oklahoma County population projected at +41% by 2050 — long-run rental-demand tailwind backs the buy-and-hold thesis.
- By year 9, paydown + projected appreciation supports a ~$32k cash-out refi (75% LTV) — recoverable capital for the next deal without selling this one.
Negotiation context
- It's been on market 15 days — a 2% lower offer ($148k) is reasonable based on typical stale-listing flexibility.
- 2 sale attempts with the ask held roughly flat each time — persistent listings suggest the price (not the market) is what's stuck; bring a comps-based counter.
- Current owner paid $70k; list at $150k implies a 114% gain — meaningful room to come down on a strong offer.
Risks & watch-outs
- Watch-outs: built in 1949 — expect roof / HVAC / electrical / plumbing capex.
- Climate carrying-cost: extreme-heat days projected 7→19/yr by 2055 (HVAC capex compounding) — expect insurance premiums to compound above CPI over the hold.
Questions for the listing agent
- What do current leases actually rent for vs. the listed asking? Can we see a recent rent roll and the last 12 months of T-12 income?
- Built in 1949 — when were the roof, HVAC, electrical panel, plumbing, and water heater last replaced?
- Is there a deadline driving the sale (1031 exchange, divorce, estate, relocation)? That informs how much negotiation room exists.
- Schools are F-rated, which usually means shorter tenancies and higher turnover. Who's the typical renter profile here, and what's been the actual vacancy rate?
- Crime grade is F in this area — have there been break-ins, vandalism, or insurance claims at this property in the last 3 years? What carrier currently insures it and at what premium?
- The area grade is low — what's the realistic commute time and amenity access for the typical tenant pool here? Any planned neighborhood developments (good or bad) we should know about?
- What's the average days-on-market for RENTAL listings here right now (not sales)? A rising rental-DOM trend means longer vacancies and softer asking-rent achievability than the comps imply.
- What's the recent tenant-quality profile in this submarket — average credit score on applications, eviction rate, late-payment / NSF rate, and stable-employment percentage? A property-management company in the area should have these aggregated.
- How much new for-sale + rental construction is in the pipeline within 1–3 miles? Heavy new supply typically softens prices + rents 12–24 months out; constrained supply supports both.
Investment metrics
- 1% rule
- 0.67% ✗
- Cap rate
- 5.23%
- Cash-on-cash
- -3.80%
- DSCR
- 0.83
- GRM
- 12.5
CMA / ARV
- ARV (on-the-fly)
- $110,922
- Comps found
- 10
Show comp detail 10 sales within ~0.75 mi
| Address | Dist | Beds/Ba | Sqft | Sold | Price | $/sf | Match |
|---|---|---|---|---|---|---|---|
| 230 SE 50th St | 0.19mi | 2/1.0 | 868 (+4%) | 0mo | $100,000 | $115 | 84 |
| 333 SE 55th St | 0.19mi | 3/1.0 (+1) | 857 (+3%) | 2mo | $150,000 | $175 | 80 |
| 340 SE 54th St | 0.18mi | 1/1.0 (-1) | 812 (-3%) | 18mo | $29,000 | $36 | 67 |
| 500 SE 47th St | 0.50mi | 2/1.0 | 902 (+8%) | 7mo | $80,000 | $89 | 57 |
| 4612 S Melrose Ln | 0.63mi | 2/1.0 | 792 (-5%) | 8mo | $100,000 | $126 | 55 |
| 6305 Ashby Ter | 0.73mi | 3/1.0 (+1) | 808 (-3%) | 8mo | $119,900 | $148 | 49 |
| 25 SW 56th St | 0.42mi | 2/1.0 | 713 (-14%) | 11mo | $95,000 | $133 | 47 |
| 5413 S Santa Fe Ave | 0.34mi | 3/1.5 (+1) | 959 (+15%) | 11mo | $190,000 | $198 | 43 |
| 1006 SE 51st St | 0.74mi | 2/1.0 | 726 (-13%) | 9mo | $110,000 | $152 | 37 |
| 4805 S Broadway Pl | 0.62mi | 3/1.5 (+1) | 906 (+9%) | 22mo | $115,000 | $127 | 32 |
Match score weights: distance 35% · size 25% · config 20% · recency 20%. Top-matched comps best support the ARV.
Projected returns pro-forma
1.75% appreciation · 3.0% rent growth · sell at horizon
- IRR
- -0.1%
- Equity multiple
- 1.00×
- Total profit
- $-154
- Equity at exit
- $57,121
- IRR
- 4.3%
- Equity multiple
- 1.57×
- Total profit
- $23,977
- Equity at exit
- $80,714
Cash invested: $42,000 (down + closing). Projections, not guarantees.
Landlord ↔ Tenant lean methodology
- Overall (STATE)
- 83 Strongly Landlord-Friendly
- State Oklahoma
- 83 Strongly Landlord-Friendly · R+20
- County
- — inherits STATE
- City
- — inherits STATE
ZIP-level market 73129
- Home prices YoY
- 0.7%
- Active inventory
- 84
- Price-to-rent
- 12.5×
Monthly cashflow live
- Estimated rent
- $1,000 high interval (Pro) →
- Mortgage (P&I)
- −$787
- Tax from tax record
- −$74 /mo · $884/yr
- Insurance
- −$62
- HOA
- −$0
- Vacancy / Maint / Mgmt
- −$210
- Net cashflow
- $-133
Break-even live
Sensitivity live
| Price | -10% $-48 | -5% $-90 | +0% $-133 | +5% $-175 | +10% $-218 |
|---|---|---|---|---|---|
| Rent | -10% $-212 | -5% $-172 | +0% $-133 | +5% $-93 | +10% $-54 |
| Rate | -1.0pp $-57 | -0.5pp $-95 | base $-133 | +0.5pp $-172 | +1.0pp $-211 |
UW: 25.0% down · 7.5% · 30yr · 1.5% tax · 5.0% vac · 8.0% maint · 8.0% mgmt
Financing live
Cash to close
- Down payment
- $37,500
- Closing costs
- $4,500
- Reserves months
- —
- Total cash needed
- —
Loan-product check · same deal, 3 products live
Conventional
25% down · 7.5% · 30yr
- Down + closing
- —
- Monthly P&I
- —
- Monthly cashflow
- —
- DSCR
- —
- Eligible?
- —
Personal DTI + credit; lowest rate.
DSCR
20% down · 8.5% · 30yr
- Down + closing
- —
- Monthly P&I
- —
- Monthly cashflow
- —
- DSCR
- —
- Eligible?
- —
No personal income docs; deal must DSCR.
Hard money
10% down · 12.0% · 12mo
- Down + closing
- —
- Monthly P&I
- —
- Monthly cashflow
- —
- DSCR
- —
- Eligible?
- —
Short-term bridge; refi at stabilization.
Rent comps 39 comps
| Address | Beds | Baths | Sqft | Rent | $/sqft | DOM | Units | Dist |
|---|---|---|---|---|---|---|---|---|
| 4908 S Stiles Ave Oklahoma City, OK | 2.0 | 1.0 | 600 | $1,000 | $1.67 | 45d | 1 | 0.31mi |
| 5113 S Sage Ave Oklahoma City, OK | 3.0 | 1.5 | 996 | $1,025 | $1.03 | 4d | 1 | 0.60mi |
| 5804 S Harvey Ave Oklahoma City, OK | 1.0 | 1.0 | 780 | $675 | $0.87 | 23d | 1 | 0.66mi |
| 6050 S Harvey Ave Apt 103 Oklahoma City, OK | 2.0 | 1.0 | 780 | $929 | $1.19 | 25d | 1 | 0.71mi |
| 6050 S Harvey Ave Oklahoma City, OK | 2.0 | 1.0 | 780 | $929 | $1.19 | 45d | 1 | 0.71mi |
| 101 SE 42nd St Unit B Oklahoma City, OK | 2.0 | 1.0 | 740 | $645 | $0.87 | 45d | 1 | 0.75mi |
| 109 SE 42nd St Apt A Oklahoma City, OK | 2.0 | 1.0 | 800 | $799 | $1.00 | 19d | 1 | 0.76mi |
| 5542 S Walker Ave Oklahoma City, OK | 2.0 | 1.0 | 681 | $920 | $1.35 | 4d | 1 | 0.78mi |
| 338 SE 41st St Oklahoma City, OK | 2.0 | 1.0 | 912 | $1,099 | $1.21 | 0d | 1 | 0.78mi |
| 6321 Johnnie Ter Oklahoma City, OK | 3.0 | 1.0 | 850 | $1,150 | $1.35 | 45d | 1 | 0.80mi |
| 808 SE 61st St Oklahoma City, OK | 3.0 | 1.0 | 736 | $940 | $1.28 | 45d | 1 | 0.81mi |
| 4101 S Shields Blvd Unit Shields 3B Oklahoma City, OK | 3.0 | 2.0 | 957 | $1,050 | $1.10 | 25d | 1 | 0.85mi |
| 4101 S Shields Blvd Apt 3B Oklahoma City, OK | 3.0 | 2.0 | 957 | $1,025 | $1.07 | 6d | 1 | 0.85mi |
| 6612 S Stiles Ave Oklahoma City, OK | 2.0 | 1.0 | 870 | $800 | $0.92 | 45d | 1 | 0.87mi |
| 6513 Ashby Ter Oklahoma City, OK | 3.0 | 2.0 | 1049 | $1,095 | $1.04 | 25d | 1 | 0.88mi |
| 311 SE 66th St Oklahoma City, OK | 1.0 | 1.0 | 750 | $700 | $0.93 | 45d | 1 | 0.89mi |
| 311 SE 66th St Unit 6620-301 Oklahoma City, OK | 2.0 | 1.0 | 870 | $850 | $0.98 | 45d | 1 | 0.89mi |
| 311 SE 66th St Oklahoma City, OK | 1.0 | 1.0 | 750 | $700 | $0.93 | 4d | 1 | 0.89mi |
| 620 SW 50th St Oklahoma City, OK | 2.0 | 1.0 | 977 | $1,100 | $1.13 | 4d | 1 | 1.02mi |
| 5909 S Lee Ave Oklahoma City, OK | 1.0–2.0 | 1.0 | 775 | $980 | $1.26 | 0d | 4 | 1.03mi |
| 449 SW 63rd Pl Unit 6400 S Byers Oklahoma City, OK | 3.0 | 1.0 | 775 | $850 | $1.10 | 25d | 1 | 1.03mi |
| 616 SW 59th St Unit 43 Oklahoma City, OK | 2.0 | 1.0 | 775 | $900 | $1.16 | 45d | 1 | 1.07mi |
| 7125 S Santa Fe Ave Oklahoma City, OK | 3.0 | 2.0 | 1100 | $1,200 | $1.09 | 45d | 1 | 1.17mi |
| 7125 S Santa Fe Ave Oklahoma City, OK | 1.0 | 1.0 | 659 | $765 | $1.16 | 6d | 1 | 1.17mi |
| 3913 S Harvey Ave Unit 2 Oklahoma City, OK | 1.0 | 1.0 | 568 | $900 | $1.58 | 45d | 1 | 1.17mi |
| 632 SW 44th St Oklahoma City, OK | 2.0 | 1.0 | 958 | $1,000 | $1.04 | 6d | 1 | 1.18mi |
| 800 SW 52nd St Oklahoma City, OK | 2.0 | 1.0 | 920 | $995 | $1.08 | 25d | 1 | 1.19mi |
| 904 SE 69th St Oklahoma City, OK | 3.0 | 1.5 | 911 | $1,150 | $1.26 | 25d | 1 | 1.20mi |
| 1501 SE 52nd St Oklahoma City, OK | 3.0 | 2.0 | 1012 | $1,200 | $1.19 | 25d | 1 | 1.20mi |
| 3906 S Hudson Ave Oklahoma City, OK | 1.0 | 1.0 | 700 | $750 | $1.07 | 25d | 1 | 1.23mi |
| 1528 SE 49th Ter Oklahoma City, OK | 3.0 | 1.0 | 912 | $1,100 | $1.21 | 25d | 1 | 1.29mi |
| 605 SE 72nd St Oklahoma City, OK | 3.0 | 1.0 | 853 | $990 | $1.16 | 45d | 1 | 1.31mi |
| 1528 SE 47th Pl Oklahoma City, OK | 3.0 | 1.0 | 1092 | $1,300 | $1.19 | 6d | 1 | 1.34mi |
| 220 SW 34th St Oklahoma City, OK | 1.0 | 1.0 | 625 | $725 | $1.16 | 45d | 1 | 1.37mi |
| 5109 S Georgia Ter Oklahoma City, OK | 3.0 | 1.0 | 1056 | $1,395 | $1.32 | 0d | 1 | 1.44mi |
| 1413 SE 39th St Oklahoma City, OK | 3.0 | 1.0 | 1004 | $1,125 | $1.12 | 45d | 1 | 1.45mi |
| 3616 S Lee Ave Oklahoma City, OK | 1.0 | 1.0 | 760 | $775 | $1.02 | 45d | 1 | 1.48mi |
| 3618 S Lee Ave Oklahoma City, OK | 1.0 | 1.0 | 760 | $850 | $1.12 | 45d | 1 | 1.48mi |
| 3312 S Harvey Ave Oklahoma City, OK | 2.0 | 1.0 | 840 | $1,100 | $1.31 | 22d | 1 | 1.49mi |
Listing history 7 events
-
2026-04-17status Pending
-
2026-04-02$150,000 Active
-
2026-02-03soldstatus $70,000
-
2026-01-30soldstatus $70,000 Closed 471-char remark
Show marketing remark (471 chars)
Excellent Investment Opportunity in OKC! This property needs some TLC but it appears to have good bones. New roof installed in June 2025. Property is a 2 bed / 1 bath with the option of finishing the back porch conversion to add an additional 200+ SQ FT. The property has a sturdy metal 2 car carport and additional parking on side of house for up to 4 car parking. Large back yard with mutiple outbuildings for extra storage. Property to be sold As - Is with no repairs.
-
2026-01-21status Pending 471-char remark
Show marketing remark (471 chars)
Excellent Investment Opportunity in OKC! This property needs some TLC but it appears to have good bones. New roof installed in June 2025. Property is a 2 bed / 1 bath with the option of finishing the back porch conversion to add an additional 200+ SQ FT. The property has a sturdy metal 2 car carport and additional parking on side of house for up to 4 car parking. Large back yard with mutiple outbuildings for extra storage. Property to be sold As - Is with no repairs.
-
2026-01-16$72,500 Active 471-char remark
Show marketing remark (471 chars)
Excellent Investment Opportunity in OKC! This property needs some TLC but it appears to have good bones. New roof installed in June 2025. Property is a 2 bed / 1 bath with the option of finishing the back porch conversion to add an additional 200+ SQ FT. The property has a sturdy metal 2 car carport and additional parking on side of house for up to 4 car parking. Large back yard with mutiple outbuildings for extra storage. Property to be sold As - Is with no repairs.
-
1994-05-02soldstatus $12,000
ⓘ Source: listings_history table (triggers on properties + properties_extension) + one-shot
backfill from property_details.listing_events for pre-trigger history.
Tax reassessment forecast OK · Resets to sale price
- Current annual tax
- $884 · $74/mo
- Projected year-2 tax
- $1,350 · $112/mo
- Expected delta
- +$466/yr (+$39/mo · 52.8%)
ⓘ Screening estimate from a state-policy table — verify with the county assessor before closing.
Climate risk First Street
- Flood 1/10 Low FEMA zone X (unshaded) · 0% chance over 30 yrs
- Wildfire 1/10 Low
- Heat 6/10 Major 7 d/yr ≥107°F today · 19 d/yr by 30 yrs out
- Wind 2/10 Low 4% chance of damaging wind over 30 yrs
- Air quality 1/10 Low 0 unhealthy d/yr today · 0 by 30 yrs out
Nearby sold comps map
Loading sold comps map…
Walkable amenities ~0.75 mi
Loading nearby amenities…
Taxation est. · year 1
- Rental income
- $11,998
- − Mortgage interest
- −$8,402
- − Property taxes
- −$884
- − Insurance
- −$750
- − Repairs & maintenance
- −$960
- − Management
- −$960
- − Depreciation
- −$4,364
- Taxable loss
- −$4,321
- Est. tax savings @ 24.0%
- +$1,037
- After-tax cash flow
- $-557/yr
For passive investors: Depreciation is non-cash, so a rental often shows a tax loss while cash-flowing — sheltering income. Rental losses are passive: they offset passive income freely, and up to $25,000/yr can offset ordinary (W-2) income if you actively participate and your MAGI is under $100k (phasing out to $0 by $150k); unused losses carry forward. On sale, claimed depreciation is recaptured at up to 25%, and gains may owe capital-gains tax (a 1031 exchange can defer both). Figures are a year-1 estimate at your 24.0% rate — not tax advice; consult a CPA.
Schools (NCES district)
- District
- Oklahoma City
- NCES district ID
- 4022770
- Math proficiency
- 7% ▼ -5.00%
- Reading proficiency
- 10% ▼ -6.00%
- Median HH income
- $35,606
- Composite
- 7.0/100
- National rank
- #9970
- State rank
- #254 of 270 in OK
Livability — Oklahoma City
- Score
- 80/100
- State rank
- #3
- US rank
- #1635
Category grades
Schools grade is shown separately in the Schools card above.
Census & demographics
- Census place
- Oklahoma City, OK
- County
- Oklahoma County · 771,644 people
- City population
- 498,656
- Metro
- Oklahoma City, OK
- Population (ZIP)
- 20,014
- Household income
- $46,670
- Rent vs Own
- Severe rent burden
- 611.0
Population outlook (Oklahoma County) Hauer SSP2
- Today (2025)
- 911,875 people
- By 2030
- 982,413 · +7.7%
- By 2040
- 1,130,468 · +24.0%
- By 2050
- 1,288,422 · +41.3%
- By 2075
- 1,711,482 · +87.7%
- By 2100
- 2,088,448 · +129.0%
Race, ethnicity, and origin ACS 2023
- Neighborhood character
- Diverse neighborhood (Simpson 0.61)
- Race & ethnicity
- Hispanic / Latino 57% Two or more races 26% White 26% Black 9% Native American 7% Asian 1%
- Hispanic origin (detail)
- Mexican 53%
- Common ancestry
- Italian 1% Lithuanian 1% Slovak 1%
- Foreign-born
- 24% · Canada, Dominican Republic
- Languages at home
- 54% English-only · Spanish 44% Other Asian/Pacific 1% Vietnamese 1%
Political lean MEDSL · Oklahoma
- 2024 margin
- Toss-up / Even · D 48.0% · R 49.7% · Other 2.3%
- 2008→2024 swing
- +15.1pp toward D · 2008: -16.8pp · 2024: -1.7pp
- All cycles
- 2024: R+1.7 2020: R+1.1 2016: R+10.5 2012: R+16.7 2008: R+16.8
Not yet ingested
- Civics
- —
Market trends
- HPI YoY
- ▲ 1.75%
- Current HPI
- 250.8581
- Rent YoY
- —
- Metro
- Oklahoma City, OK
- State GDP YoY
- ▲ 1.55%
- F500 in state
- 6
Industry mix (Fortune 500 HQ in OK)
| Industry | F500 HQs | Revenue |
|---|---|---|
| Energy | 3 | $48B |
|
||
Price history
+1150.0% since first listed7 events — show timeline
- 2026-04-17 Pending — MLSOK
- 2026-04-02 Listed $150,000 MLSOK
- 2026-02-03 Sold (Public Records) $70,000 Public Records
- 2026-01-30 Sold (MLS) $70,000 MLSOK
- 2026-01-21 Pending — MLSOK
- 2026-01-16 Listed $72,500 MLSOK
- 1994-05-02 Sold (Public Records) $12,000 Public Records
Property tax history
+12.7%/yrLatest (2025): $884 · +0.2% YoY. Source: county tax records.
Cash-flow waterfall
monthlySold comps — $/sqft
last 12 mo · ≤1 miLoading sold comps…