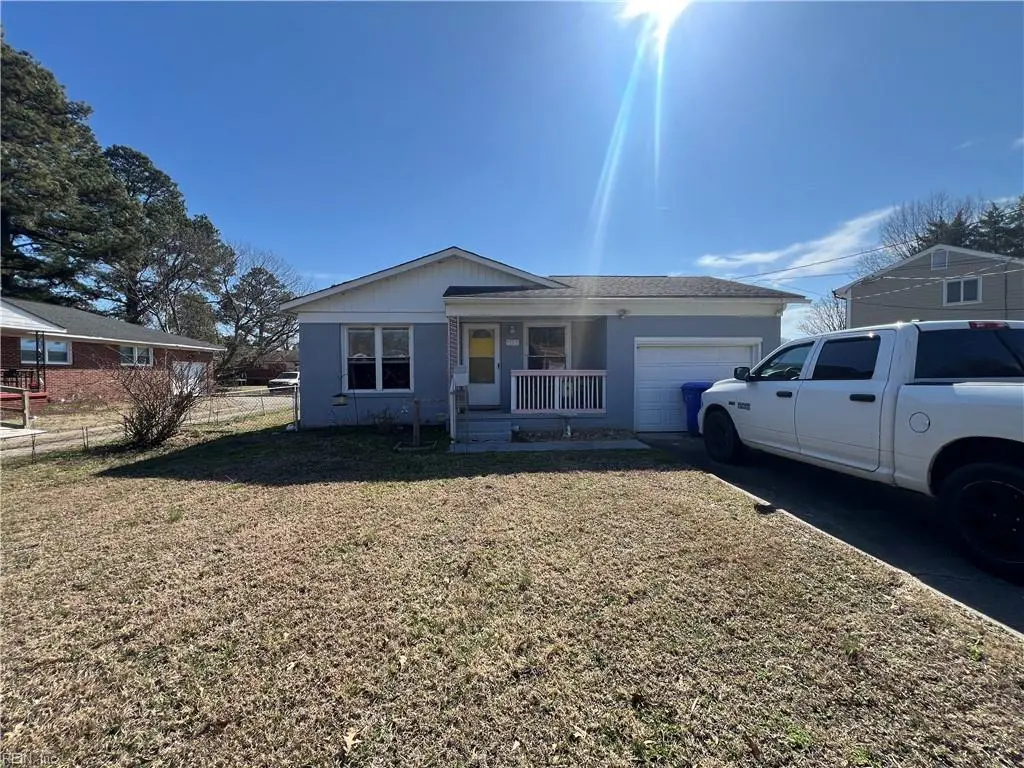
1103 Custis Rd · Suffolk, VA
Flood risk 1/10 · Minimal
- FEMA flood zone
- X (unshaded)
- Chance of flooding over 30 yrs
- 0.0%
- Est. flood insurance / yr
- $507 – $1,088
Fire risk 2/10 · Minimal
- Est. fire insurance / yr
- $666 – $1,236
Heat risk 9/10 · Severe
- Hot days now (above 109°F)
- 7 days/yr
- Hot days in 30 yrs
- 16 days/yr
Wind risk 8/10 · Major
- Chance of severe wind over 30 yrs
- 80.0%
Air-quality risk 2/10 · Minimal
- Unhealthy air days now
- 0 days/yr
- Unhealthy air days in 30 yrs
- 1 days/yr
Risk factors via First Street. Map © Google.
Why this score? — see what drove the C grade
The composite is a weighted blend of 9 inputs, each scored 0–100. Each bar is that input's sub-score; the figure is the points it added to the 100-point composite (weight × sub-score).
- Cash flow +16.4/30.0
- ARV discount +14.9/15.0
- DSCR +5.1/10.0
- Schools +4.8/10.0
- 1% rule +4.2/10.0
- Rent growth +4.0/5.0
- Livability +3.9/5.0
- Condition / age +2.5/5.0
- Appreciation +0.0/10.0
$185,000
🖨 Deal sheet (PDF) 📄 Offer letter ✓ Due diligence
Listing remarks MLS
Lots of potential in a growing area. Will not qualify for a traditional loan. Will need to be 203k/renovation loan, cash or hard money. Main sewer line collapse and needs to be replaced, quoted $9000. Possible crawlspace repairs as well. Flooring throughout needs to be replaced. Please do not turn on any water or flush toilets while you are touring.
Key facts
- 9,147 sq ft lot
- Garage
- Built 1968
Neighborhood map
What this means for you Summary
Snapshot
- This is a 3-bed/1.5-bath single-family listed at $185k.
Deal economics
- At list price, monthly cash flow is $105 ($1k/yr) — positive.
- The deal already cash-flows at list — no discount required.
- To meet the 1% rule (rent ≥ 1% of price), the offer needs to be $171k (7.8% below list).
- Recommended offer: $168k (9.0% below list) — sets the bar for market timing.
- Cap rate 7.0% vs local median 3.5% in Suffolk — top-decile yield for the area; either an underpriced asset or a hidden risk that comps aren't pricing in. Stress-test before assuming the spread holds.
Location & tenants
- Location reads 77/100 on livability (#88 in VA, #2,896 nationally) — a middle-class / working-renter tenant base. Strengths: housing A+, health & safety A+, employment A-; Watch: crime C-, commute F.
- Suffolk City Public School District (suburban): math 41% / reading 69% proficiency, ranked #72 of 131 in VA (top 55%) — acceptable for families but not a draw, mixed tenant base, ~2y average lease.
- Zoned schools: Elephant'S Fork Elementary (math 39% / reading 57%, grade D, #787 of 1,108 statewide, top 72%, 599 students, 65% FRL); John F. Kennedy Middle (math 22% / reading 61%, grade F, #299 of 342 statewide, top 88%, 544 students, 64% FRL); Lakeland High (math 33% / reading 77%, grade C, #279 of 319 statewide, top 88%, 1,083 students, 64% FRL) — zoned schools average 64% FRL vs 39% district-wide (25 pts higher); higher-poverty schools than district average — tighter screening recommended.
- Market conditions: Rents rising fast (+5.8%/yr); 546 active listings in the ZIP; 7 comparable units currently listed for rent nearby; rentals lingering (median 46d on market — plan ~5-8 weeks vacancy on turnover, expect pricing pressure); 57% of comp listings sitting > 30 days — soft ceiling on asking rent; solid renter incomes; 680 units permitted in Suffolk city in 2024 (0 in 5+ unit buildings).
Forward outlook
- Local home prices are declining (-3.0%/yr); year-one equity from $1k of loan paydown is wiped out by about $6k of value loss. Plan a longer hold.
- Suffolk County population projected at +11% by 2050 — modest demand growth; plan on rents tracking national, not racing it.
Negotiation context
- It's been on market 107 days — a 9% lower offer ($168k) is reasonable based on typical stale-listing flexibility.
- 2 sale attempts since 5y ago; this cycle's ask has dropped $25k (12%) from the opening price — seller is motivated, your offer sets the floor, not the list.
Risks & watch-outs
- Climate carrying-cost: severe wind risk, 80% chance of damaging wind over 30y; extreme-heat days projected 7→16/yr by 2055 (HVAC capex compounding) — expect insurance premiums to compound above CPI over the hold.
Questions for the listing agent
- It's been on market 107 days. Have you received any prior offers? Is the seller open to a 9% concession, seller financing, or rate buy-down credit?
- Built in 1968 — when were the roof, HVAC, electrical panel, plumbing, and water heater last replaced?
- Why hasn't it sold? Are there any deal-killer items the seller is aware of (foundation, flood, title, zoning, code violations)?
- Is there a deadline driving the sale (1031 exchange, divorce, estate, relocation)? That informs how much negotiation room exists.
- Schools are A-rated — typically a magnet for longer-tenancy family renters. What's the average tenant stay here, and is there a school-zone premium baked into asking?
- What's the average days-on-market for RENTAL listings here right now (not sales)? A rising rental-DOM trend means longer vacancies and softer asking-rent achievability than the comps imply.
- What's the recent tenant-quality profile in this submarket — average credit score on applications, eviction rate, late-payment / NSF rate, and stable-employment percentage? A property-management company in the area should have these aggregated.
- How much new for-sale + rental construction is in the pipeline within 1–3 miles? Heavy new supply typically softens prices + rents 12–24 months out; constrained supply supports both.
Investment metrics
- 1% rule
- 0.92% ✗
- Cap rate
- 6.98%
- Cash-on-cash
- 2.44%
- DSCR
- 1.11
- GRM
- 9.0
CMA / ARV
- ARV (median comp)
- $221,532
- List price
- $185,000
- Delta
- -16.49%
- Verdict
- UNDERPRICED
- Comps
- 20 within 1.0 mi
Show comp detail 12 sales within ~0.75 mi
| Address | Dist | Beds/Ba | Sqft | Sold | Price | $/sf | Match |
|---|---|---|---|---|---|---|---|
| 1010 Truman Rd | 0.11mi | 3/1.5 | 1,100 (+12%) | 3mo | $229,000 | $208 | 73 |
| 121 S 10th St | 0.20mi | 3/2.0 | 892 (-9%) | 0mo | $220,000 | $247 | 72 |
| 111 S Lloyd St | 0.44mi | 3/1.0 | 1,008 (+2%) | 6mo | $189,000 | $188 | 69 |
| 226 N 4th St | 0.46mi | 3/2.0 | 1,022 (+4%) | 2mo | $222,000 | $217 | 68 |
| 613 Chisholm Ln | 0.48mi | 3/2.0 | 1,000 (+2%) | 7mo | $246,000 | $246 | 67 |
| 301 Goodman St | 0.48mi | 3/1.0 | 1,053 (+7%) | 2mo | $125,000 | $119 | 63 |
| 1304 Shelton Ct | 0.74mi | 3/1.0 | 947 (-4%) | 2mo | $163,500 | $173 | 56 |
| 310 Fuller St | 0.44mi | 2/1.0 (-1) | 900 (-8%) | 3mo | $115,000 | $128 | 55 |
| 123 Walnut St | 0.65mi | 2/1.0 (-1) | 896 (-9%) | 0mo | $219,000 | $244 | 48 |
| 1415 Blythewood Ln | 0.70mi | 3/2.0 | 1,056 (+7%) | 8mo | $240,000 | $227 | 46 |
| 341 N 5th St | 0.66mi | 3/1.0 | 1,100 (+12%) | 1mo | $220,000 | $200 | 46 |
| 417 Hollywood Ave | 0.61mi | 2/1.5 (-1) | 870 (-12%) | 6mo | $217,000 | $249 | 43 |
Match score weights: distance 35% · size 25% · config 20% · recency 20%. Top-matched comps best support the ARV.
Projected returns pro-forma
-3.0% appreciation · 5.84% rent growth · sell at horizon
- IRR
- -9.4%
- Equity multiple
- 0.65×
- Total profit
- $-18,253
- Equity at exit
- $27,584
- IRR
- 3.5%
- Equity multiple
- 1.28×
- Total profit
- $14,554
- Equity at exit
- $15,995
Cash invested: $51,800 (down + closing). Projections, not guarantees.
Landlord ↔ Tenant lean methodology
- Overall (STATE)
- 55 Moderately Landlord-Leaning
- State Virginia
- 55 Moderately Landlord-Leaning · D+2
- County
- — inherits STATE
- City
- — inherits STATE
ZIP-level market 23434
- Rents YoY
- 5.8%
- Active inventory
- 546
- Price-to-rent
- 9.0×
Monthly cashflow live
- Estimated rent
- $1,705 high interval (Pro) →
- Mortgage (P&I)
- −$970
- Tax from tax record
- −$194 /mo · $2,333/yr
- Insurance
- −$77
- HOA
- −$0
- Vacancy / Maint / Mgmt
- −$358
- Net cashflow
- $105
Break-even live
Sensitivity live
| Price | -10% $210 | -5% $158 | +0% $105 | +5% $53 | +10% $1 |
|---|---|---|---|---|---|
| Rent | -10% $-29 | -5% $38 | +0% $105 | +5% $173 | +10% $240 |
| Rate | -1.0pp $199 | -0.5pp $152 | base $105 | +0.5pp $57 | +1.0pp $9 |
UW: 25.0% down · 7.5% · 30yr · 1.5% tax · 5.0% vac · 8.0% maint · 8.0% mgmt
Financing live
Cash to close
- Down payment
- $46,250
- Closing costs
- $5,550
- Reserves months
- —
- Total cash needed
- —
Loan-product check · same deal, 3 products live
Conventional
25% down · 7.5% · 30yr
- Down + closing
- —
- Monthly P&I
- —
- Monthly cashflow
- —
- DSCR
- —
- Eligible?
- —
Personal DTI + credit; lowest rate.
DSCR
20% down · 8.5% · 30yr
- Down + closing
- —
- Monthly P&I
- —
- Monthly cashflow
- —
- DSCR
- —
- Eligible?
- —
No personal income docs; deal must DSCR.
Hard money
10% down · 12.0% · 12mo
- Down + closing
- —
- Monthly P&I
- —
- Monthly cashflow
- —
- DSCR
- —
- Eligible?
- —
Short-term bridge; refi at stabilization.
Rent comps 7 comps
| Address | Beds | Baths | Sqft | Rent | $/sqft | DOM | Units | Dist |
|---|---|---|---|---|---|---|---|---|
| 120 S 10th St Suffolk, VA | 2.0 | 1.0 | 736 | $1,250 | $1.70 | 46d | 1 | 0.18mi |
| 214 N 7th St Unit NA Suffolk, VA | 2.0 | 1.0 | 760 | $1,500 | $1.97 | 25d | 1 | 0.32mi |
| 1410 Blythewood Ln Suffolk, VA | 4.0 | 1.5 | 1056 | $1,800 | $1.70 | 46d | 1 | 0.66mi |
| 326 E Washington St Suffolk, VA | 2.0 | 2.0 | 839 | $1,629 | $1.94 | 5d | 1 | 0.97mi |
| 307 Central Ave Suffolk, VA | 3.0 | 1.0 | 840 | $1,700 | $2.02 | 46d | 1 | 1.03mi |
| 181 N Main St Suffolk, VA | 2.0 | 1.0–2.0 | 804 | $1,885 | $2.34 | 0d | 15 | 1.26mi |
| 210 Baker St Suffolk, VA | 3.0 | 1.0 | 988 | $1,600 | $1.62 | 46d | 1 | 1.49mi |
Listing history 20 events
-
2026-06-21days on market $185,000 Active 107 DOM
-
2026-06-18days on market $185,000 Active 104 DOM
-
2026-06-17days on market $185,000 Active 103 DOM
-
2026-06-16pricedays on market $185,000 Active 102 DOM
-
2026-06-15days on market $199,900 Active 101 DOM
-
2026-06-13days on market $199,900 Active 99 DOM
-
2026-06-09days on market $199,900 Active 95 DOM
-
2026-06-08days on market $199,900 Active 94 DOM
-
2026-06-07days on market $199,900 Active 93 DOM
-
2026-06-03days on market $199,900 Active 89 DOM
-
2026-06-02days on market $199,900 Active 88 DOM
-
2026-06-01days on market $199,900 Active 87 DOM
-
2026-05-31days on market $199,900 Active 86 DOM
-
2026-03-06$210,000 Active 351-char remark
Show marketing remark (351 chars)
Lots of potential in a growing area. Will not qualify for a traditional loan. Will need to be 203k/renovation loan, cash or hard money. Main sewer line collapse and needs to be replaced, quoted $9000. Possible crawlspace repairs as well. Flooring throughout needs to be replaced. Please do not turn on any water or flush toilets while you are touring.
-
2021-11-17soldstatus $194,500
-
2021-10-18status Under Contract
-
2021-10-11historical Active Under Contract
-
2021-10-08$194,500 Active
-
2014-10-23soldstatus $95,000
-
2010-04-08soldstatus $50,725
ⓘ Source: listings_history table (triggers on properties + properties_extension) + one-shot
backfill from property_details.listing_events for pre-trigger history.
Tax reassessment forecast VA · Resets to sale price
- Current annual tax
- $2,333 · $194/mo
- Projected year-2 tax
- $2,333 · $194/mo
- Expected delta
- $0/yr ($0/mo · 0.0%)
ⓘ Screening estimate from a state-policy table — verify with the county assessor before closing.
Climate risk First Street
- Flood 1/10 Low FEMA zone X (unshaded) · 0% chance over 30 yrs
- Wildfire 2/10 Low
- Heat 9/10 Extreme 7 d/yr ≥109°F today · 16 d/yr by 30 yrs out
- Wind 8/10 Severe 80% chance of damaging wind over 30 yrs
- Air quality 2/10 Low 0 unhealthy d/yr today · 1 by 30 yrs out
Nearby sold comps map
Loading sold comps map…
Walkable amenities ~0.75 mi
Loading nearby amenities…
Taxation est. · year 1
- Rental income
- $20,461
- − Mortgage interest
- −$10,363
- − Property taxes
- −$2,333
- − Insurance
- −$925
- − Repairs & maintenance
- −$1,637
- − Management
- −$1,637
- − Depreciation
- −$5,382
- Taxable loss
- −$1,815
- Est. tax savings @ 24.0%
- +$436
- After-tax cash flow
- $1,700/yr
For passive investors: Depreciation is non-cash, so a rental often shows a tax loss while cash-flowing — sheltering income. Rental losses are passive: they offset passive income freely, and up to $25,000/yr can offset ordinary (W-2) income if you actively participate and your MAGI is under $100k (phasing out to $0 by $150k); unused losses carry forward. On sale, claimed depreciation is recaptured at up to 25%, and gains may owe capital-gains tax (a 1031 exchange can defer both). Figures are a year-1 estimate at your 24.0% rate — not tax advice; consult a CPA.
Schools (NCES district)
- District
- Suffolk City Public School District
- NCES district ID
- 5103710
- Math proficiency
- 41% ▼ -43.00%
- Reading proficiency
- 69% ▼ -8.00%
- Median HH income
- $65,573
- Composite
- 48.31/100
- National rank
- #2151
- State rank
- #72 of 131 in VA
Livability — Suffolk
- Score
- 77/100
- State rank
- #88
- US rank
- #2896
Category grades
Schools grade is shown separately in the Schools card above.
Census & demographics
- Census place
- Suffolk, VA
- County
- Suffolk City · 88,108 people
- City population
- 88,108
- Metro
- Virginia Beach-Norfolk-Newport News, VA-NC
- Population (ZIP)
- 54,387
- Household income
- $79,877
- Rent vs Own
- Severe rent burden
- 1934.0
Population outlook (Suffolk County) Hauer SSP2
- Today (2025)
- 95,269 people
- By 2030
- 98,269 · +3.1%
- By 2040
- 103,177 · +8.3%
- By 2050
- 105,777 · +11.0%
- By 2075
- 110,963 · +16.5%
- By 2100
- 103,711 · +8.9%
Race, ethnicity, and origin ACS 2023
- Neighborhood character
- Diverse neighborhood (Simpson 0.58)
- Race & ethnicity
- Black 49% White 41% Two or more races 5% Hispanic / Latino 4% Asian 1%
- Common ancestry
- Lithuanian 1% Slovak 1% Italian 1%
- Foreign-born
- 3% · Canada
- Languages at home
- 96% English-only · Spanish 2%
Political lean MEDSL · Suffolk
- 2024 margin
- D (+15.9) · D 57.4% · R 41.5% · Other 1.2%
- 2008→2024 swing
- +2.7pp toward D · 2008: 13.2pp · 2024: 15.9pp
- All cycles
- 2024: D+15.9 2020: D+17.3 2016: D+13.8 2012: D+15.1 2008: D+13.2
Not yet ingested
- Civics
- —
Market trends
- HPI YoY
- ▼ -383.80%
- Current HPI
- 158.5866
- Rent YoY
- ▲ 5.84%
- Metro
- Virginia Beach-Norfolk-Newport News, VA-NC
- State GDP YoY
- ▲ 2.40%
- F500 in state
- 50
Industry mix (Fortune 500 HQ in VA)
| Industry | F500 HQs | Revenue |
|---|---|---|
| Aerospace / Defense | 4 | $236B |
|
||
| Technology / Defense | 3 | $32B |
|
||
| Financial Services | 2 | $176B |
|
||
| Utilities | 2 | $27B |
|
||
| Insurance | 2 | $25B |
|
||
| Technology | 2 | $15B |
|
||
Price history
+314.0% since first listed7 events — show timeline
- 2026-03-06 Listed $210,000 REINMLS
- 2021-11-17 Sold (Public Records) $194,500 Public Records
- 2021-10-18 Pending — REINMLS
- 2021-10-11 Contingent — REINMLS
- 2021-10-08 Listed $194,500 REINMLS
- 2014-10-23 Sold (Public Records) $95,000 Public Records
- 2010-04-08 Sold (Public Records) $50,725 Public Records
Property tax history
+5.7%/yrLatest (2025): $2,333 · +5.7% YoY. Source: county tax records.
Cash-flow waterfall
monthlySold comps — $/sqft
last 12 mo · ≤1 miLoading sold comps…