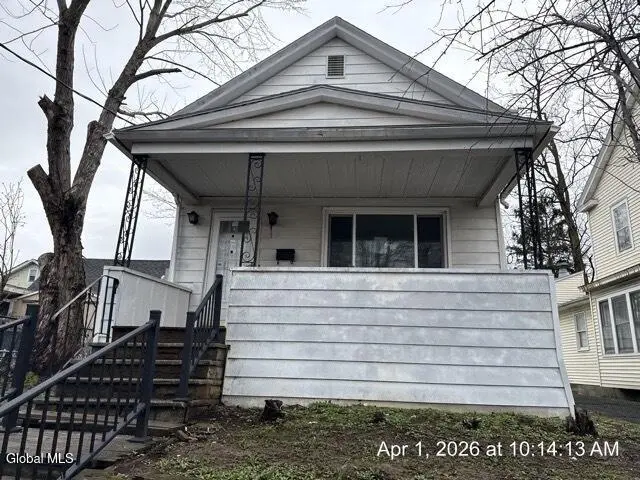
6 Fullerton St · Albany, NY
Flood risk 1/10 · Minimal
- FEMA flood zone
- X (unshaded)
- Chance of flooding over 30 yrs
- 0.0%
- Est. flood insurance / yr
- $473 – $860
Fire risk 3/10 · Minor
- Est. fire insurance / yr
- $691 – $1,283
Heat risk 4/10 · Minor
- Hot days now (above 99°F)
- 7 days/yr
- Hot days in 30 yrs
- 16 days/yr
Wind risk 3/10 · Minor
- Chance of severe wind over 30 yrs
- 6.0%
Air-quality risk 1/10 · Minimal
- Unhealthy air days now
- 0 days/yr
- Unhealthy air days in 30 yrs
- 0 days/yr
Risk factors via First Street. Map © Google.
Why this score? — see what drove the C+ grade
The composite is a weighted blend of 9 inputs, each scored 0–100. Each bar is that input's sub-score; the figure is the points it added to the 100-point composite (weight × sub-score).
- Cash flow +20.3/30.0
- ARV discount +15.0/15.0
- 1% rule +6.6/10.0
- DSCR +6.4/10.0
- Livability +4.0/5.0
- Schools +3.2/10.0
- Rent growth +2.5/5.0
- Condition / age +2.5/5.0
- Appreciation +0.0/10.0
$179,900
🖨 Deal sheet 📄 Offer letter ✓ Due diligence
Listing remarks MLS
Cute house near schools with off street parking. Sold as is. All offers must be submitted by the buyer's agent using the online offer management system. Access the system via the link below. Offer link to property: http://www.spsreo.com/?c=DUQW
Key facts
- Off street parking
- 3,920 sq ft lot
- Garage
Tags
Neighborhood map
What this means for you Summary
Snapshot
- This is a 3-bed/1.0-bath single-family listed at $180k.
Deal economics
- At list price, monthly cash flow is $229 ($3k/yr) — positive.
- The deal already cash-flows at list — no discount required.
- Meets the 1% rule at list price ($2k rent vs $180k).
- Recommended offer: $169k (6.0% below list) — sets the bar for market timing.
- Cap rate 7.8% vs local median 5.7% in Albany — top-decile yield for the area; either an underpriced asset or a hidden risk that comps aren't pricing in. Stress-test before assuming the spread holds.
Location & tenants
- Location reads 79/100 on livability (#129 in NY, #2,083 nationally) — a middle-class / working-renter tenant base. Strengths: amenities A+, commute A+, housing A+; Watch: employment C-, crime F.
- Albany City School District (urban): math 37% / reading 40% proficiency, ranked #543 of 590 in NY (top 92%) — families likely to look elsewhere, expect single-tenant / working-renter base with shorter leases; 66% free/reduced lunch — lower-income household profile, screen leases tightly.
- Market conditions: 47 active listings in the ZIP; 40 comparable units currently listed for rent nearby; rentals at typical pace (median 24d on market — plan ~3-4 weeks tenant-placement turnaround); 675 units permitted in Albany County in 2024 (451 in 5+ unit buildings).
Forward outlook
- Local home prices are declining (-3.0%/yr); year-one equity from $1k of loan paydown is wiped out by about $5k of value loss. Plan a longer hold.
- Albany County population projected at +9% by 2050 — modest demand growth; plan on rents tracking national, not racing it.
Negotiation context
- It's been on market 69 days — a 6% lower offer ($169k) is reasonable based on typical stale-listing flexibility.
- Current owner paid $96k; list at $180k implies a 87% gain — meaningful room to come down on a strong offer.
Risks & watch-outs
- Watch-outs: property tax is 2.6% of price; built in 1923 — expect roof / HVAC / electrical / plumbing capex.
Questions for the listing agent
- It's been on market 69 days. Have you received any prior offers? Is the seller open to a 6% concession, seller financing, or rate buy-down credit?
- Built in 1923 — when were the roof, HVAC, electrical panel, plumbing, and water heater last replaced?
- Property tax is high relative to price — has the assessment been appealed recently, and will the sale trigger a re-assessment?
- Why hasn't it sold? Are there any deal-killer items the seller is aware of (foundation, flood, title, zoning, code violations)?
- Is there a deadline driving the sale (1031 exchange, divorce, estate, relocation)? That informs how much negotiation room exists.
- Crime grade is F in this area — have there been break-ins, vandalism, or insurance claims at this property in the last 3 years? What carrier currently insures it and at what premium?
- What's the average days-on-market for RENTAL listings here right now (not sales)? A rising rental-DOM trend means longer vacancies and softer asking-rent achievability than the comps imply.
- What's the recent tenant-quality profile in this submarket — average credit score on applications, eviction rate, late-payment / NSF rate, and stable-employment percentage? A property-management company in the area should have these aggregated.
- How much new for-sale + rental construction is in the pipeline within 1–3 miles? Heavy new supply typically softens prices + rents 12–24 months out; constrained supply supports both.
Investment metrics
- 1% rule
- 1.16% ✓
- Cap rate
- 7.82%
- Cash-on-cash
- 5.47%
- DSCR
- 1.24
- GRM
- 7.2
CMA / ARV
- ARV (median comp)
- $305,862
- List price
- $179,900
- Delta
- -41.18%
- Verdict
- UNDERPRICED
- Comps
- 20 within 1.0 mi
Show comp detail 12 sales within ~0.75 mi
| Address | Dist | Beds/Ba | Sqft | Sold | Price | $/sf | Match |
|---|---|---|---|---|---|---|---|
| 81 Edgecomb St | 0.07mi | 2/1.0 (-1) | 1,486 (+6%) | 1mo | $289,000 | $194 | 81 |
| 39 Lawnridge Ave | 0.60mi | 3/1.0 | 1,400 (-0%) | 6mo | $267,800 | $191 | 67 |
| 3 Mapleridge Ave | 0.27mi | 3/2.0 | 1,280 (-9%) | 3mo | $255,000 | $199 | 66 |
| 561 Delaware Ave | 0.31mi | 3/1.5 | 1,229 (-12%) | 6mo | $210,000 | $171 | 58 |
| 23 Barrows St | 0.54mi | 3/1.5 | 1,312 (-7%) | 6mo | $198,000 | $151 | 57 |
| 19 Fordham Ct | 0.53mi | 3/1.5 | 1,263 (-10%) | 1mo | $331,000 | $262 | 56 |
| 86 Grove Ave | 0.61mi | 3/1.5 | 1,500 (+7%) | 3mo | $295,000 | $197 | 56 |
| 2 Kehoe St | 0.62mi | 3/2.0 | 1,542 (+10%) | 3mo | $239,900 | $156 | 48 |
| 138 Van Schoick Ave | 0.73mi | 3/2.0 | 1,488 (+6%) | 5mo | $293,550 | $197 | 48 |
| 59 Van Schoick Ave | 0.75mi | 3/2.5 | 1,500 (+7%) | 2mo | $345,000 | $230 | 46 |
| 167 Southern Blvd | 0.74mi | 3/2.0 | 1,277 (-9%) | 3mo | $225,000 | $176 | 44 |
| 317 Mountain St | 0.70mi | 3/1.0 | 1,240 (-12%) | 6mo | $230,000 | $185 | 43 |
Match score weights: distance 35% · size 25% · config 20% · recency 20%. Top-matched comps best support the ARV.
Projected returns pro-forma
-3.0% appreciation · 3.0% rent growth · sell at horizon
- IRR
- -7.7%
- Equity multiple
- 0.71×
- Total profit
- $-14,401
- Equity at exit
- $26,824
- IRR
- 1.9%
- Equity multiple
- 1.14×
- Total profit
- $6,833
- Equity at exit
- $15,554
Cash invested: $50,372 (down + closing). Projections, not guarantees.
Landlord ↔ Tenant lean methodology
- Overall (STATE)
- 15 Strongly Tenant-Friendly
- State New York
- 15 Strongly Tenant-Friendly · D+10
- County
- — inherits STATE
- City
- — inherits STATE
ZIP-level market 12209
- Home prices YoY
- -7.3%
- Active inventory
- 47
- Price-to-rent
- 7.2×
Monthly cashflow live
- Estimated rent
- $2,081 high interval (Pro) →
- Mortgage (P&I)
- −$943
- Tax from tax record
- −$396 /mo · $4,754/yr
- Insurance
- −$75
- HOA
- −$0
- Vacancy / Maint / Mgmt
- −$437
- Net cashflow
- $229
Break-even live
Sensitivity live
| Price | -10% $331 | -5% $280 | +0% $229 | +5% $179 | +10% $128 |
|---|---|---|---|---|---|
| Rent | -10% $65 | -5% $147 | +0% $229 | +5% $312 | +10% $394 |
| Rate | -1.0pp $320 | -0.5pp $275 | base $229 | +0.5pp $183 | +1.0pp $135 |
UW: 25.0% down · 7.5% · 30yr · 1.5% tax · 5.0% vac · 8.0% maint · 8.0% mgmt
Financing live
Cash to close
- Down payment
- $44,975
- Closing costs
- $5,397
- Reserves months
- —
- Total cash needed
- —
Loan-product check · same deal, 3 products live
Conventional
25% down · 7.5% · 30yr
- Down + closing
- —
- Monthly P&I
- —
- Monthly cashflow
- —
- DSCR
- —
- Eligible?
- —
Personal DTI + credit; lowest rate.
DSCR
20% down · 8.5% · 30yr
- Down + closing
- —
- Monthly P&I
- —
- Monthly cashflow
- —
- DSCR
- —
- Eligible?
- —
No personal income docs; deal must DSCR.
Hard money
10% down · 12.0% · 12mo
- Down + closing
- —
- Monthly P&I
- —
- Monthly cashflow
- —
- DSCR
- —
- Eligible?
- —
Short-term bridge; refi at stabilization.
Rent comps 40 comps
| Address | Beds | Baths | Sqft | Rent | $/sqft | DOM | Units | Dist |
|---|---|---|---|---|---|---|---|---|
| 502 Second Ave #3 Albany, NY | 3.0 | 1.0 | 1100 | $1,800 | $1.64 | 44d | 1 | 0.40mi |
| 86 Hackett Blvd Albany, NY | 2.0 | 1.0 | 1100 | $1,900 | $1.73 | 24d | 1 | 0.42mi |
| 50 Southern Blvd Albany, NY | 3.0 | 1.0 | 1200 | $1,650 | $1.38 | 14d | 1 | 0.46mi |
| 42 Harris Ave Unit 2 Albany, NY | 2.0 | 1.0 | 1000 | $1,600 | $1.60 | 14d | 1 | 0.51mi |
| 15 Stanwix St Albany, NY | 4.0 | 1.5 | 1660 | $2,500 | $1.51 | 14d | 1 | 0.52mi |
| 31 Bertha St Albany, NY | 4.0 | 1.0 | 1116 | $2,000 | $1.79 | 24d | 1 | 0.65mi |
| 22 Hurlbut St Albany, NY | 3.0 | 1.0 | 1209 | $2,050 | $1.70 | 44d | 1 | 0.69mi |
| 52 Grove Ave Albany, NY | 4.0 | 1.0 | 1200 | $2,200 | $1.83 | 21d | 1 | 0.69mi |
| 30 Cardinal Ave Albany, NY | 4.0 | 1.0 | 1529 | $2,800 | $1.83 | 44d | 1 | 0.78mi |
| 21 Woodlawn Ave Unit 3RDFL Albany, NY | 3.0 | 1.0 | 1300 | $1,500 | $1.15 | 44d | 1 | 0.83mi |
| 21 Woodlawn Ave Unit 3rd floor Albany, NY | 3.0 | 1.0 | 1300 | $1,500 | $1.15 | 24d | 1 | 0.83mi |
| 35 Parkwood St Albany, NY | 2.0 | 1.0 | 900 | $1,495 | $1.66 | 24d | 1 | 0.92mi |
| 546 Mercer St Unit 1 Albany, NY | 3.0 | 1.0 | 1400 | $1,800 | $1.29 | 24d | 1 | 0.93mi |
| 38 W Erie St Albany, NY | 4.0 | 2.0 | 1440 | $2,800 | $1.94 | 24d | 1 | 0.94mi |
| 6A Weis Rd Albany, NY | 2.0 | 1.0 | 900 | $1,610 | $1.79 | 14d | 1 | 0.99mi |
| 614 Park Ave Albany, NY | 3.0 | 1.0 | 1118 | $2,500 | $2.24 | 44d | 1 | 1.07mi |
| 363 Ontario St Albany, NY | 1.0–2.0 | 1.0–2.5 | 1610 | $3,485 | $2.16 | 14d | 1 | 1.09mi |
| 563 New Scotland Ave Albany, NY | 2.0 | 1.0–2.0 | 931 | $3,125 | $3.36 | 14d | 37 | 1.10mi |
| 32 Peyster St Unit 2nd Albany, NY | 3.0 | 2.0 | 1500 | $2,300 | $1.53 | 44d | 1 | 1.17mi |
| 673 Myrtle Ave Albany, NY | 4.0 | 1.0 | 1076 | $2,400 | $2.23 | 21d | 1 | 1.19mi |
| 104 S Main Ave Unit 1 Albany, NY | 3.0 | 1.0 | 1300 | $2,600 | $2.00 | 44d | 1 | 1.20mi |
| 520 Madison Ave Unit 1 Albany, NY | 3.0 | 1.0 | 1080 | $1,700 | $1.57 | 44d | 1 | 1.27mi |
| 830 Madison Ave Albany, NY | 3.0 | 1.0 | 1180 | $1,700 | $1.44 | 24d | 1 | 1.27mi |
| 201 Park Ave Unit 10 Albany, NY | 3.0 | 2.0 | 1600 | $2,100 | $1.31 | 44d | 1 | 1.30mi |
| 602 Morris St Albany, NY | 3.0 | 1.0 | 1270 | $1,850 | $1.46 | 14d | 1 | 1.32mi |
| 433 Hamilton St Unit 1 Albany, NY | 4.0 | 1.0 | 1200 | $2,300 | $1.92 | 14d | 1 | 1.34mi |
| 437 Hamilton St Unit 2 Albany, NY | 4.0 | 1.0 | 1200 | $2,300 | $1.92 | 14d | 1 | 1.34mi |
| 489 Hamilton St Unit 1 Albany, NY | 3.0 | 1.0 | 1100 | $1,800 | $1.64 | 14d | 1 | 1.37mi |
| 4 Irving St Unit 2nd Floor Albany, NY | 3.0 | 1.0 | 1000 | $1,695 | $1.70 | 44d | 1 | 1.38mi |
| 88 Willett St Albany, NY | 3.0 | 1.0 | 825 | $2,080 | $2.52 | 14d | 10 | 1.38mi |
| 409 Madison Ave Albany, NY | 2.0 | 2.0 | 1050 | $2,094 | $1.99 | 24d | 1 | 1.38mi |
| 517 Hamilton St Albany, NY | 4.0 | 1.0 | 1020 | $2,000 | $1.96 | 24d | 1 | 1.39mi |
| 292 Lark St Albany, NY | 2.0 | 1.0 | 1100 | $1,500 | $1.36 | 44d | 1 | 1.40mi |
| 53 Greenway N Albany, NY | 3.0 | 2.0 | 1500 | $2,600 | $1.73 | 24d | 1 | 1.42mi |
| 364 Madison Ave Albany, NY | 2.0 | 2.0 | 1150 | $1,850 | $1.61 | 21d | 1 | 1.42mi |
| 98 Mount Hope Dr Albany, NY | 2.0 | 1.5 | 1200 | $2,000 | $1.67 | 14d | 1 | 1.42mi |
| 58 Elberon Pl Apt 2 Albany, NY | 4.0 | 1.0 | 1250 | $2,200 | $1.76 | 44d | 1 | 1.42mi |
| 346 Madison Ave Unit 3 Albany, NY | 3.0 | 2.0 | 1110 | $2,725 | $2.45 | 44d | 1 | 1.45mi |
| 346 Madison Ave Albany, NY | 3.0 | 2.0 | 1500 | $2,495 | $1.66 | 24d | 1 | 1.45mi |
| 180 Western Ave Unit 2nd Floor Albany, NY | 2.0 | 1.0 | 1000 | $1,575 | $1.57 | 44d | 1 | 1.47mi |
Listing history 17 events
-
2026-06-18days on market $179,900 Active 69 DOM
-
2026-06-17days on market $179,900 Active 68 DOM
-
2026-06-16days on market $179,900 Active 67 DOM
-
2026-06-15days on market $179,900 Active 66 DOM
-
2026-06-14days on market $179,900 Active 64 DOM
-
2026-06-10days on market $179,900 Active 61 DOM
-
2026-06-08days on market $179,900 Active 59 DOM
-
2026-06-07days on market $179,900 Active 58 DOM
-
2026-06-03days on market $179,900 Active 54 DOM
-
2026-06-03price $179,900 Active 53 DOM
-
2026-06-02days on market $189,900 Active 53 DOM
-
2026-06-01days on market $189,900 Active 52 DOM
-
2026-05-31days on market $189,900 Active 51 DOM
-
2026-05-31days on market $189,900 Active 50 DOM
-
2026-05-07price $189,900 251-char remark
Show marketing remark (251 chars)
Cute house near schools with off street parking. Sold as is. All offers must be submitted by the buyer's agent using the online offer management system. Access the system via the link below. Offer link to property: http://www.spsreo.com/?c=DUQW
-
2026-04-08$199,900 Active 251-char remark
Show marketing remark (251 chars)
Cute house near schools with off street parking. Sold as is. All offers must be submitted by the buyer's agent using the online offer management system. Access the system via the link below. Offer link to property: http://www.spsreo.com/?c=DUQW
-
2002-06-12soldstatus $96,000
ⓘ Source: listings_history table (triggers on properties + properties_extension) + one-shot
backfill from property_details.listing_events for pre-trigger history.
Tax reassessment forecast NY · Partial reset (capped growth)
- Current annual tax
- $4,754 · $396/mo
- Projected year-2 tax
- $4,754 · $396/mo
- Expected delta
- $0/yr ($0/mo · 0.0%)
ⓘ Screening estimate from a state-policy table — verify with the county assessor before closing.
Climate risk First Street
- Flood 1/10 Low FEMA zone X (unshaded) · 0% chance over 30 yrs
- Wildfire 3/10 Moderate
- Heat 4/10 Moderate 7 d/yr ≥99°F today · 16 d/yr by 30 yrs out
- Wind 3/10 Moderate 6% chance of damaging wind over 30 yrs
- Air quality 1/10 Low 0 unhealthy d/yr today · 0 by 30 yrs out
Nearby sold comps map
Loading sold comps map…
Walkable amenities ~0.75 mi
Loading nearby amenities…
Taxation est. · year 1
- Rental income
- $24,971
- − Mortgage interest
- −$10,077
- − Property taxes
- −$4,754
- − Insurance
- −$900
- − Repairs & maintenance
- −$1,998
- − Management
- −$1,998
- − Depreciation
- −$5,233
- Taxable income
- $12
- Est. tax owed @ 24.0%
- −$3
- After-tax cash flow
- $2,750/yr
For passive investors: Depreciation is non-cash, so a rental often shows a tax loss while cash-flowing — sheltering income. Rental losses are passive: they offset passive income freely, and up to $25,000/yr can offset ordinary (W-2) income if you actively participate and your MAGI is under $100k (phasing out to $0 by $150k); unused losses carry forward. On sale, claimed depreciation is recaptured at up to 25%, and gains may owe capital-gains tax (a 1031 exchange can defer both). Figures are a year-1 estimate at your 24.0% rate — not tax advice; consult a CPA.
Schools (NCES district)
- District
- Albany City School District
- NCES district ID
- 3602460
- Math proficiency
- 37% ▲ 6.00%
- Reading proficiency
- 40% ▲ 7.00%
- Median HH income
- $40,568
- Composite
- 32.34/100
- National rank
- #5744
- State rank
- #543 of 590 in NY
Livability — Albany
- Score
- 79/100
- State rank
- #129
- US rank
- #2083
Category grades
Schools grade is shown separately in the Schools card above.
Census & demographics
- Census place
- Albany, NY
- City population
- 116,921
- Population (ZIP)
- 10,754
Population outlook (Albany County) Hauer SSP2
- Today (2025)
- 320,794 people
- By 2030
- 327,401 · +2.1%
- By 2040
- 338,218 · +5.4%
- By 2050
- 348,467 · +8.6%
- By 2075
- 381,693 · +19.0%
- By 2100
- 393,809 · +22.8%
Race, ethnicity, and origin ACS 2023
- Neighborhood character
- Diverse neighborhood (Simpson 0.69)
- Race & ethnicity
- White 46% Black 23% Hispanic / Latino 19% Asian 8% Two or more races 7%
- Hispanic origin (detail)
- Puerto Rican 6%
- Common ancestry
- Romanian 4% Lithuanian 3% Serbian 1%
- Foreign-born
- 18% · Canada, Philippines, South Korea
- Languages at home
- 77% English-only · Spanish 13% Other Asian/Pacific 3% Tagalog/Filipino 1%
Political lean MEDSL · Albany
- 2024 margin
- Strong D (+25.8) · D 62.9% · R 37.1%
- 2008→2024 swing
- -3.6pp toward R · 2008: 29.4pp · 2024: 25.8pp
- All cycles
- 2024: D+25.8 2020: D+31.4 2016: D+24.3 2012: D+31.0 2008: D+29.4
Not yet ingested
- Civics
- —
Market trends
- HPI YoY
- ▼ -24.91%
- Current HPI
- 318.0191
- Rent YoY
- —
- Metro
- —
- State GDP YoY
- ▲ 2.60%
- F500 in state
- 92
Industry mix (Fortune 500 HQ in NY)
| Industry | F500 HQs | Revenue |
|---|---|---|
| Financial Services | 10 | $950B |
|
||
| Consumer Goods | 9 | $162B |
|
||
| Insurance | 4 | $225B |
|
||
| Telecommunications | 2 | $144B |
|
||
| Pharmaceuticals | 2 | $112B |
|
||
| Media / Entertainment | 2 | $69B |
|
||
Price history
+97.8% since first listed3 events — show timeline
- 2026-05-07 Price Changed $189,900 Global MLS
- 2026-04-08 Listed $199,900 Global MLS
- 2002-06-12 Sold (Public Records) $96,000 Public Records
Property tax history
-1.1%/yrLatest (2025): $4,754 · +0.0% YoY. Source: county tax records.
Cash-flow waterfall
monthlySold comps — $/sqft
last 12 mo · ≤1 miLoading sold comps…