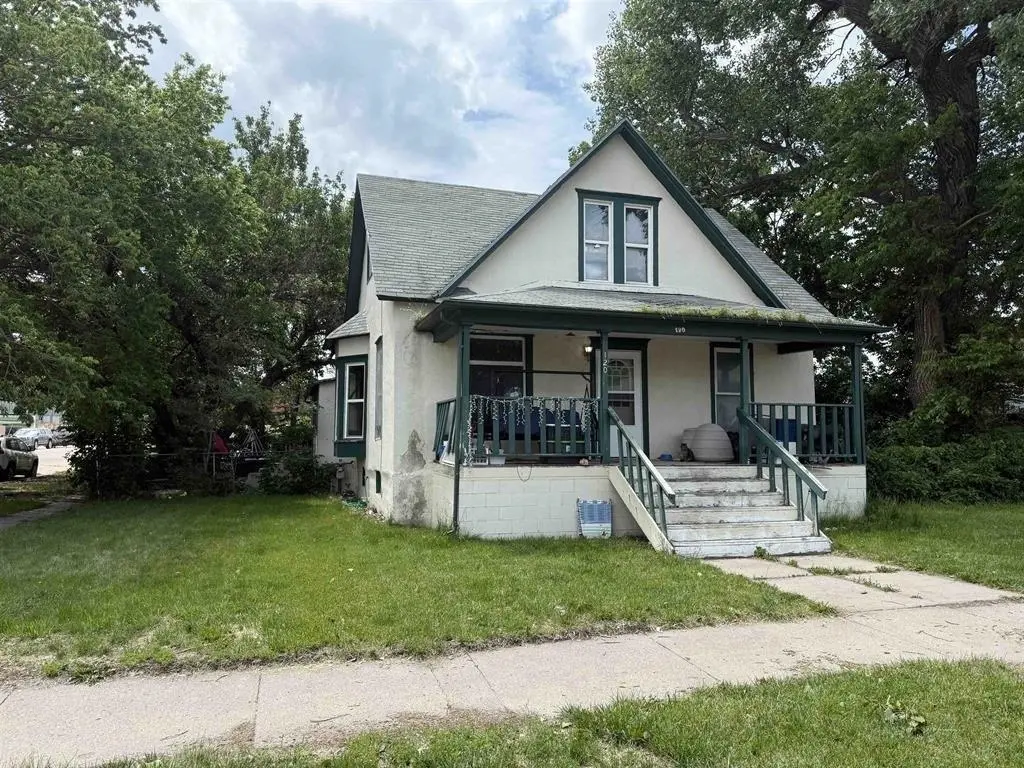
120 E 8 St · North Platte, NE
Flood risk 4/10 · Minor
- FEMA flood zone
- X (unshaded)
- Chance of flooding over 30 yrs
- 0.21%
- Est. flood insurance / yr
- $473 – $860
Fire risk 5/10 · Moderate
- Est. fire insurance / yr
- $1,161 – $2,155
Heat risk 3/10 · Minor
- Hot days now (above 99°F)
- 7 days/yr
- Hot days in 30 yrs
- 17 days/yr
Wind risk 2/10 · Minimal
- Chance of severe wind over 30 yrs
- —
Air-quality risk 1/10 · Minimal
- Unhealthy air days now
- 0 days/yr
- Unhealthy air days in 30 yrs
- 0 days/yr
Risk factors via First Street. Map © Google.
Why this score? — see what drove the B grade
The composite is a weighted blend of 9 inputs, each scored 0–100. Each bar is that input's sub-score; the figure is the points it added to the 100-point composite (weight × sub-score).
- Cash flow +30.0/30.0
- 1% rule +10.0/10.0
- DSCR +10.0/10.0
- ARV discount +7.5/15.0
- Schools +4.0/10.0
- Livability +3.7/5.0
- Rent growth +2.5/5.0
- Condition / age +2.5/5.0
- Appreciation +0.0/10.0
$80,000
🖨 Deal sheet 📄 Offer letter ✓ Due diligence
Listing remarks
GREAT INVESTMENT OPPORTUNITY. HOUSE TO BE SOLD AS IS. NICE KITCHEN, 1 BEDROOM ON THE MAIN AND 3 BEDROOMS UP.
Key facts
- Built 1910
- Listed 6 days
Property features AI
Exterior
- Utilities: Public water; Public sewer; Natural gas available
- Home design: Single-family residence (Residential property)
- Construction: Frame construction with wood siding
- Exterior features: Composition roof
Interior
- Bathrooms: One main-level bathroom
- Heating & cooling: Central air conditioning; Forced air heating
- Interior features: Basement
Neighborhood map
What this means for you Summary
Snapshot
- This is a 4-bed/1.0-bath single-family listed at $80k.
Deal economics
- At list price, monthly cash flow is $545 ($7k/yr) — positive.
- The deal already cash-flows at list — no discount required.
- Meets the 1% rule at list price ($1k rent vs $80k).
- Cap rate 14.5% vs local median 2.5% in North Platte — top-decile yield for the area; either an underpriced asset or a hidden risk that comps aren't pricing in. Stress-test before assuming the spread holds.
Location & tenants
- Location reads 74/100 on livability (#109 in NE, #4,400 nationally) — a middle-class / working-renter tenant base. Strengths: cost of living A+, housing A+, health & safety A+; Watch: employment C-, amenities D, commute F.
- North Platte Public Schools (town): math 47% / reading 46% proficiency, ranked #77 of 111 in NE (top 69%) — families likely to look elsewhere, expect single-tenant / working-renter base with shorter leases.
- Market conditions: 190 active listings in the ZIP; 1 comparable units currently listed for rent nearby; 66 units permitted in Lincoln County in 2024 (0 in 5+ unit buildings).
Forward outlook
- Local home prices are declining (-3.0%/yr); year-one equity from $553 of loan paydown is wiped out by about $2k of value loss. Plan a longer hold.
- Lincoln County population projected at -11% by 2050 — secular population decline; favor cash flow + early exit over multi-decade hold.
- At projected returns (-3.0% appreciation + 3.0% rent growth), your $22k cash investment doubles in ~5 years — after that, you're playing with house money.
Negotiation context
- Only 6 days on market — expect competitive offers; lowballing is unlikely to land.
- 2 sale attempts with the ask held roughly flat each time — persistent listings suggest the price (not the market) is what's stuck; bring a comps-based counter.
Risks & watch-outs
- Watch-outs: built in 1910 — expect roof / HVAC / electrical / plumbing capex.
- Climate carrying-cost: moderate wildfire risk — expect insurance premiums to compound above CPI over the hold.
Questions for the listing agent
- Built in 1910 — when were the roof, HVAC, electrical panel, plumbing, and water heater last replaced?
- Is there a deadline driving the sale (1031 exchange, divorce, estate, relocation)? That informs how much negotiation room exists.
- Schools are B-rated — typically a magnet for longer-tenancy family renters. What's the average tenant stay here, and is there a school-zone premium baked into asking?
- What's the average days-on-market for RENTAL listings here right now (not sales)? A rising rental-DOM trend means longer vacancies and softer asking-rent achievability than the comps imply.
- What's the recent tenant-quality profile in this submarket — average credit score on applications, eviction rate, late-payment / NSF rate, and stable-employment percentage? A property-management company in the area should have these aggregated.
- How much new for-sale + rental construction is in the pipeline within 1–3 miles? Heavy new supply typically softens prices + rents 12–24 months out; constrained supply supports both.
Investment metrics
- 1% rule
- 1.73% ✓
- Cap rate
- 14.47%
- Cash-on-cash
- 29.20%
- DSCR
- 2.30
- GRM
- 4.8
CMA / ARV
- ARV (on-the-fly)
- $186,250
- Comps found
- 12
Show comp detail 12 sales within ~0.75 mi
| Address | Dist | Beds/Ba | Sqft | Sold | Price | $/sf | Match |
|---|---|---|---|---|---|---|---|
| 314 E 13th St | 0.36mi | 3/2.0 (-1) | 1,540 (+3%) | 2mo | $213,000 | $138 | 67 |
| 423 W 10th St | 0.35mi | 3/2.0 (-1) | 1,372 (-8%) | 5mo | $180,000 | $131 | 58 |
| 621 W 4th St | 0.57mi | 3/2.0 (-1) | 1,500 (+1%) | 11mo | $188,000 | $125 | 54 |
| 611 N Garfield Ave | 0.61mi | 3/1.0 (-1) | 1,528 (+3%) | 11mo | $125,000 | $82 | 53 |
| 215 E 8th St | 0.06mi | 5/2.0 (+1) | 1,680 (+13%) | 17mo | $179,000 | $107 | 52 |
| 919 N Jessie Ave | 0.57mi | 3/2.0 (-1) | 1,608 (+8%) | 1mo | $180,000 | $112 | 50 |
| 801 E 3rd St | 0.61mi | 4/2.0 | 1,527 (+2%) | 16mo | $165,000 | $108 | 50 |
| 103 S Walnut St | 0.62mi | 3/2.0 (-1) | 1,598 (+7%) | 4mo | $140,000 | $88 | 47 |
| 714 E 13th St | 0.50mi | 3/1.0 (-1) | 1,315 (-12%) | 14mo | $165,000 | $125 | 41 |
| 1115 E 13th St | 0.73mi | 3/2.0 (-1) | 1,404 (-6%) | 10mo | $180,000 | $128 | 39 |
| 414 W 3rd St | 0.56mi | 3/2.0 (-1) | 1,388 (-7%) | 20mo | $223,500 | $161 | 37 |
| 1122 E 9th St | 0.66mi | 3/1.0 (-1) | 1,292 (-13%) | 13mo | $145,000 | $112 | 32 |
Match score weights: distance 35% · size 25% · config 20% · recency 20%. Top-matched comps best support the ARV.
Projected returns pro-forma
-3.0% appreciation · 3.0% rent growth · sell at horizon
- IRR
- 23.6%
- Equity multiple
- 1.97×
- Total profit
- $21,774
- Equity at exit
- $11,928
- IRR
- 31.5%
- Equity multiple
- 3.85×
- Total profit
- $63,738
- Equity at exit
- $6,917
Cash invested: $22,400 (down + closing). Projections, not guarantees.
Landlord ↔ Tenant lean methodology
- Overall (STATE)
- 83 Strongly Landlord-Friendly
- State Nebraska
- 83 Strongly Landlord-Friendly · R+13
- County
- — inherits STATE
- City
- — inherits STATE
ZIP-level market 69101
- Active inventory
- 190
- Price-to-rent
- 4.8×
Monthly cashflow live
- Estimated rent
- $1,382 medium interval (Pro) →
- Mortgage (P&I)
- −$420
- Tax from tax record
- −$94 /mo · $1,128/yr
- Insurance
- −$33
- HOA
- −$0
- Vacancy / Maint / Mgmt
- −$290
- Net cashflow
- $545
Break-even live
UW: 25.0% down · 7.5% · 30yr · 1.5% tax · 5.0% vac · 8.0% maint · 8.0% mgmt
Financing live
Cash to close
- Down payment
- $20,000
- Closing costs
- $2,400
- Reserves months
- —
- Total cash needed
- —
Loan-product check · same deal, 3 products live
Conventional
25% down · 7.5% · 30yr
- Down + closing
- —
- Monthly P&I
- —
- Monthly cashflow
- —
- DSCR
- —
- Eligible?
- —
Personal DTI + credit; lowest rate.
DSCR
20% down · 8.5% · 30yr
- Down + closing
- —
- Monthly P&I
- —
- Monthly cashflow
- —
- DSCR
- —
- Eligible?
- —
No personal income docs; deal must DSCR.
Hard money
10% down · 12.0% · 12mo
- Down + closing
- —
- Monthly P&I
- —
- Monthly cashflow
- —
- DSCR
- —
- Eligible?
- —
Short-term bridge; refi at stabilization.
Rent comps 1 comps
| Address | Beds | Baths | Sqft | Rent | $/sqft | DOM | Units | Dist |
|---|---|---|---|---|---|---|---|---|
| 901 S Bryan Ave North Platte, NE | 1.0–3.0 | 1.0–3.0 | 905 | $1,125 | $1.24 | 43d | 1 | 1.24mi |
Listing history 7 events
-
2026-06-17status $80,000 Pending 6 DOM
-
2026-06-17days on market $80,000 Active 6 DOM
-
2026-06-16days on market $80,000 Active 5 DOM
-
2026-06-15days on market $80,000 Active 4 DOM
-
2026-06-14days on market $80,000 Active 2 DOM
-
2026-06-12remarks 108-char remark
-
2026-06-12$80,000 Active 1 DOM
ⓘ Source: listings_history table (triggers on properties + properties_extension) + one-shot
backfill from property_details.listing_events for pre-trigger history.
Tax reassessment forecast NE · Resets to sale price
- Current annual tax
- $1,128 · $94/mo
- Projected year-2 tax
- $1,384 · $115/mo
- Expected delta
- +$256/yr (+$21/mo · 22.7%)
ⓘ Screening estimate from a state-policy table — verify with the county assessor before closing.
Climate risk First Street
- Flood 4/10 Moderate FEMA zone X (unshaded) · 21% chance over 30 yrs
- Wildfire 5/10 Major
- Heat 3/10 Moderate 7 d/yr ≥99°F today · 17 d/yr by 30 yrs out
- Wind 2/10 Low
- Air quality 1/10 Low 0 unhealthy d/yr today · 0 by 30 yrs out
Nearby sold comps map
Loading sold comps map…
Walkable amenities ~0.75 mi
Loading nearby amenities…
Taxation est. · year 1
- Rental income
- $16,587
- − Mortgage interest
- −$4,481
- − Property taxes
- −$1,128
- − Insurance
- −$400
- − Repairs & maintenance
- −$1,327
- − Management
- −$1,327
- − Depreciation
- −$2,327
- Taxable income
- $5,597
- Est. tax owed @ 24.0%
- −$1,343
- After-tax cash flow
- $5,198/yr
For passive investors: Depreciation is non-cash, so a rental often shows a tax loss while cash-flowing — sheltering income. Rental losses are passive: they offset passive income freely, and up to $25,000/yr can offset ordinary (W-2) income if you actively participate and your MAGI is under $100k (phasing out to $0 by $150k); unused losses carry forward. On sale, claimed depreciation is recaptured at up to 25%, and gains may owe capital-gains tax (a 1031 exchange can defer both). Figures are a year-1 estimate at your 24.0% rate — not tax advice; consult a CPA.
Schools (NCES district)
- District
- North Platte Public Schools
- NCES district ID
- 3100022
- Math proficiency
- 47% ▼ -8.00%
- Reading proficiency
- 46% ▼ -1.00%
- Median HH income
- $47,348
- Composite
- 39.64/100
- National rank
- #3918
- State rank
- #77 of 111 in NE
Livability — North Platte
- Score
- 74/100
- State rank
- #109
- US rank
- #4400
Category grades
Schools grade is shown separately in the Schools card above.
Census & demographics
- Census place
- North Platte, NE
- County
- Lincoln County · 27,198 people
- City population
- 27,198
- Metro
- North Platte, NE
- Population (ZIP)
- 27,198
- Household income
- $62,268
- Rent vs Own
- Severe rent burden
- 796.0
Population outlook (Lincoln County) Hauer SSP2
- Today (2025)
- 34,750 people
- By 2030
- 34,004 · -2.1%
- By 2040
- 32,310 · -7.0%
- By 2050
- 30,918 · -11.0%
- By 2075
- 29,245 · -15.8%
- By 2100
- 29,116 · -16.2%
Race, ethnicity, and origin ACS 2023
- Neighborhood character
- Predominantly White (86%)
- Race & ethnicity
- White 86% Hispanic / Latino 10% Two or more races 5% Native American 1%
- Hispanic origin (detail)
- Mexican 8%
- Common ancestry
- Slovak 2% Italian 2% Lithuanian 2%
- Foreign-born
- 3% · Canada, South Korea
- Languages at home
- 95% English-only · Spanish 3% German/W. Germanic 1%
Political lean MEDSL · Lincoln
- 2024 margin
- Solid R (+55.2) · D 21.8% · R 77.0% · Other 1.2%
- 2008→2024 swing
- -19.7pp toward R · 2008: -35.5pp · 2024: -55.2pp
- All cycles
- 2024: R+55.2 2020: R+54.6 2016: R+58.1 2012: R+40.6 2008: R+35.5
Not yet ingested
- Civics
- —
Market trends
- HPI YoY
- ▼ -132.87%
- Current HPI
- 174.088
- Rent YoY
- —
- Metro
- North Platte, NE
- State GDP YoY
- ▲ 0.68%
- F500 in state
- 2
Industry mix (Fortune 500 HQ in NE)
| Industry | F500 HQs | Revenue |
|---|---|---|
| Conglomerate | 1 | $371B |
|
||
Price history
+27.4% since first listed10 events — show timeline
- 2026-05-20 Listed $80,000 LCBR
- 2025-10-30 Price Changed $90,000 LCBR
- 2025-09-22 Price Changed $100,000 LCBR
- 2025-06-04 Listed $110,000 LCBR
- 2020-06-30 Sold (Public Records) $410,000 Public Records
- 2020-06-30 Sold (Public Records) $410,000 Public Records
- 2012-04-10 Sold (Public Records) $315,000 Public Records
- 2011-09-07 Sold (Public Records) $40,000 Public Records
- 2006-04-21 Sold (Public Records) $62,337 Public Records
- 2004-04-02 Sold (Public Records) $62,800 Public Records
Property tax history
-1.0%/yrLatest (2025): $1,128 · +18.5% YoY. Source: county tax records.
Cash-flow waterfall
monthlySold comps — $/sqft
last 12 mo · ≤1 miLoading sold comps…