180 Grace Chapel Rd #110 · Blue Eye, MO
Flood risk 1/10 · Minimal
- FEMA flood zone
- X (unshaded)
- Chance of flooding over 30 yrs
- 0.0%
- Est. flood insurance / yr
- $507 – $1,088
Fire risk 3/10 · Minor
- Est. fire insurance / yr
- $1,054 – $1,958
Heat risk 4/10 · Minor
- Hot days now (above 104°F)
- 7 days/yr
- Hot days in 30 yrs
- 20 days/yr
Wind risk 2/10 · Minimal
- Chance of severe wind over 30 yrs
- 1.0%
Air-quality risk 2/10 · Minimal
- Unhealthy air days now
- 0 days/yr
- Unhealthy air days in 30 yrs
- 1 days/yr
Risk factors via First Street. Map © Google.
Why this score? — see what drove the B+ grade
The composite is a weighted blend of 9 inputs, each scored 0–100. Each bar is that input's sub-score; the figure is the points it added to the 100-point composite (weight × sub-score).
- Cash flow +30.0/30.0
- ARV discount +11.5/15.0
- 1% rule +10.0/10.0
- DSCR +10.0/10.0
- Appreciation +6.3/10.0
- Schools +3.7/10.0
- Livability +3.1/5.0
- Rent growth +2.5/5.0
- Condition / age +2.5/5.0
$78,000
🖨 Deal sheet 📄 Offer letter ✓ Due diligence
Listing remarks MLS
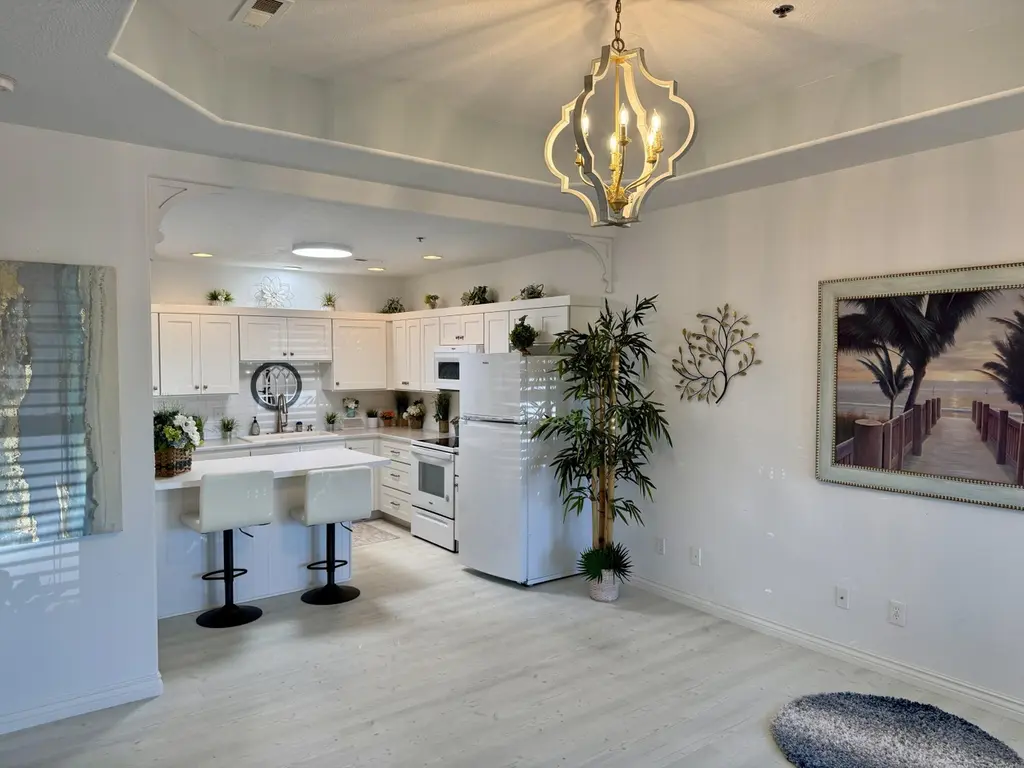
This charming 1 bedroom 1 bath condo in The Ridge at Brushy Creek features a private entrance with a peaceful front porch, open floor plan, plenty of cabinetry, new washer & dryer, a large kitchen island with bar seating, and a farmhouse style sink! The Ridge at Brushy Creek is a quiet gated community only about 30 minutes from all of the shopping, dining and entertainment of Branson. If you have been searching for affordable easy living, look no further! Low CoA dues that include trash service, water & sewer!
Key facts
- Large kitchen island
- Open floor plan
- Front porch
Tags
Neighborhood map
What this means for you Summary
Snapshot
- This is a 1-bed/1.0-bath condo listed at $78k.
Deal economics
- At list price, monthly cash flow is $460 ($6k/yr) — positive.
- The deal already cash-flows at list — no discount required.
- Meets the 1% rule at list price ($1k rent vs $78k).
- Recommended offer: $76k (3.0% below list) — sets the bar for market timing.
- Cap rate 13.4% vs local median 4.0% in Blue Eye — top-decile yield for the area; either an underpriced asset or a hidden risk that comps aren't pricing in. Stress-test before assuming the spread holds.
Location & tenants
- Location reads 61/100 on livability (#449 in MO) — a middle-class / working-renter tenant base. Strengths: cost of living A+; Watch: health & safety C-, schools D, crime F.
- Blue Eye R-V (rural): math 41% / reading 47% proficiency, ranked #107 of 324 in MO (top 33%) — families likely to look elsewhere, expect single-tenant / working-renter base with shorter leases.
- Market conditions: 91 active listings in the ZIP; 191 units permitted in Stone County in 2024 (0 in 5+ unit buildings).
Forward outlook
- In year one you build about $3k of equity ($539 loan paydown + $2k appreciation (2.6% local appreciation)).
- Stone County population projected at -30% by 2050 — secular population decline; favor cash flow + early exit over multi-decade hold.
- At projected returns (2.6% appreciation + 3.0% rent growth), your $22k cash investment doubles in ~3 years — after that, you're playing with house money.
Negotiation context
- It's been on market 49 days — a 3% lower offer ($76k) is reasonable based on typical stale-listing flexibility.
Questions for the listing agent
- It's been on market 49 days. Have you received any prior offers? Is the seller open to a 3% concession, seller financing, or rate buy-down credit?
- What does the HOA fee cover, when was the last increase, and are there any pending special assessments or reserve-fund shortfalls?
- Any open or pending special assessments — roof, HVAC, plumbing, elevator, façade? What's the per-unit balance and payoff schedule, and is the seller paying it off at close or rolling it to the buyer?
- Is there a deadline driving the sale (1031 exchange, divorce, estate, relocation)? That informs how much negotiation room exists.
- Schools are D-rated, which usually means shorter tenancies and higher turnover. Who's the typical renter profile here, and what's been the actual vacancy rate?
- Crime grade is F in this area — have there been break-ins, vandalism, or insurance claims at this property in the last 3 years? What carrier currently insures it and at what premium?
- What's the average days-on-market for RENTAL listings here right now (not sales)? A rising rental-DOM trend means longer vacancies and softer asking-rent achievability than the comps imply.
- What's the recent tenant-quality profile in this submarket — average credit score on applications, eviction rate, late-payment / NSF rate, and stable-employment percentage? A property-management company in the area should have these aggregated.
- How much new apartment / multifamily construction is in the pipeline within 1–3 miles? Heavy new supply (>2% of stock underway) typically softens rents 12–24 months out; light construction supports rent growth.
Investment metrics
- 1% rule
- 1.78% ✓
- Cap rate
- 13.37%
- Cash-on-cash
- 25.28%
- DSCR
- 2.12
- GRM
- 4.7
CMA / ARV
- ARV (median comp)
- $85,649
- List price
- $78,000
- Delta
- -8.93%
- Verdict
- FAIR
- Comps
- 20 within 1.0 mi
Projected returns pro-forma
2.63% appreciation · 3.0% rent growth · sell at horizon
- IRR
- 30.7%
- Equity multiple
- 2.71×
- Total profit
- $37,278
- Equity at exit
- $33,480
- IRR
- 31.5%
- Equity multiple
- 5.29×
- Total profit
- $93,657
- Equity at exit
- $50,390
Cash invested: $21,840 (down + closing). Projections, not guarantees.
Landlord ↔ Tenant lean methodology
- Overall (STATE)
- 81 Strongly Landlord-Friendly
- State Missouri
- 81 Strongly Landlord-Friendly · R+10
- County
- — inherits STATE
- City
- — inherits STATE
ZIP-level market 65611
- Home prices YoY
- 1.3%
- Active inventory
- 91
- Price-to-rent
- 4.7×
Monthly cashflow live
- Estimated rent
- $1,387 medium interval (Pro) →
- Mortgage (P&I)
- −$409
- Tax from tax record
- −$44 /mo · $526/yr
- Insurance
- −$32
- HOA
- −$150
- Vacancy / Maint / Mgmt
- −$291
- Net cashflow
- $460
Break-even live
UW: 25.0% down · 7.5% · 30yr · 1.5% tax · 5.0% vac · 8.0% maint · 8.0% mgmt
Financing live
Cash to close
- Down payment
- $19,500
- Closing costs
- $2,340
- Reserves months
- —
- Total cash needed
- —
Loan-product check · same deal, 3 products live
Conventional
25% down · 7.5% · 30yr
- Down + closing
- —
- Monthly P&I
- —
- Monthly cashflow
- —
- DSCR
- —
- Eligible?
- —
Personal DTI + credit; lowest rate.
DSCR
20% down · 8.5% · 30yr
- Down + closing
- —
- Monthly P&I
- —
- Monthly cashflow
- —
- DSCR
- —
- Eligible?
- —
No personal income docs; deal must DSCR.
Hard money
10% down · 12.0% · 12mo
- Down + closing
- —
- Monthly P&I
- —
- Monthly cashflow
- —
- DSCR
- —
- Eligible?
- —
Short-term bridge; refi at stabilization.
HOA detail condo
- Monthly dues
- $150 · $1,800/yr
- Likely covers
- watersewertrashsecurity
- Assessments
- None detected in remarks — confirm with the listing agent.
Listing history 11 events
-
2026-06-12statusdays on market $78,000 Pending 49 DOM
-
2026-06-09days on market $78,000 Active 48 DOM
-
2026-06-08days on market $78,000 Active 47 DOM
-
2026-06-07days on market $78,000 Active 46 DOM
-
2026-06-05pricedays on market $78,000 Active 43 DOM
-
2026-06-03days on market $83,900 Active 42 DOM
-
2026-06-02days on market $83,900 Active 41 DOM
-
2026-06-01days on market $83,900 Active 40 DOM
-
2026-05-31days on market $83,900 Active 39 DOM
-
2026-05-30days on market $83,900 Active 38 DOM
-
2026-04-22$83,900 Active 527-char remark
Show marketing remark (527 chars)
This charming 1 bedroom 1 bath condo in The Ridge at Brushy Creek features a private entrance with a peaceful front porch, open floor plan, plenty of cabinetry, new washer & dryer, a large kitchen island with bar seating, and a farmhouse style sink! The Ridge at Brushy Creek is a quiet gated community only about 30 minutes from all of the shopping, dining and entertainment of Branson. If you have been searching for affordable easy living, look no further! Low CoA dues that include trash service, water & sewer!
ⓘ Source: listings_history table (triggers on properties + properties_extension) + one-shot
backfill from property_details.listing_events for pre-trigger history.
Tax reassessment forecast MO · Resets to sale price
- Current annual tax
- $526 · $44/mo
- Projected year-2 tax
- $757 · $63/mo
- Expected delta
- +$230/yr (+$19/mo · 43.8%)
ⓘ Screening estimate from a state-policy table — verify with the county assessor before closing.
Climate risk First Street
- Flood 1/10 Low FEMA zone X (unshaded) · 0% chance over 30 yrs
- Wildfire 3/10 Moderate
- Heat 4/10 Moderate 7 d/yr ≥104°F today · 20 d/yr by 30 yrs out
- Wind 2/10 Low 100% chance of damaging wind over 30 yrs
- Air quality 2/10 Low 0 unhealthy d/yr today · 1 by 30 yrs out
Nearby sold comps map
Loading sold comps map…
Walkable amenities ~0.75 mi
Loading nearby amenities…
Taxation est. · year 1
- Rental income
- $16,639
- − Mortgage interest
- −$4,369
- − Property taxes
- −$526
- − Insurance
- −$390
- − Repairs & maintenance
- −$1,331
- − Management
- −$1,331
- − HOA
- −$1,800
- − Depreciation
- −$2,269
- Taxable income
- $4,622
- Est. tax owed @ 24.0%
- −$1,109
- After-tax cash flow
- $4,411/yr
For passive investors: Depreciation is non-cash, so a rental often shows a tax loss while cash-flowing — sheltering income. Rental losses are passive: they offset passive income freely, and up to $25,000/yr can offset ordinary (W-2) income if you actively participate and your MAGI is under $100k (phasing out to $0 by $150k); unused losses carry forward. On sale, claimed depreciation is recaptured at up to 25%, and gains may owe capital-gains tax (a 1031 exchange can defer both). Figures are a year-1 estimate at your 24.0% rate — not tax advice; consult a CPA.
Schools (NCES district)
- District
- Blue Eye R-V
- NCES district ID
- 2905280
- Math proficiency
- 41% ▲ 3.00%
- Reading proficiency
- 47% ▼ -5.00%
- Median HH income
- $42,591
- Composite
- 37.08/100
- National rank
- #4500
- State rank
- #107 of 324 in MO
Livability — Blue Eye
- Score
- 61/100
- State rank
- #449
- US rank
- #18289
Category grades
Schools grade is shown separately in the Schools card above.
Census & demographics
- Census place
- Blue Eye, MO
- Population (ZIP)
- 1,784
Population outlook (Stone County) Hauer SSP2
- Today (2025)
- 28,147 people
- By 2030
- 26,405 · -6.2%
- By 2040
- 22,762 · -19.1%
- By 2050
- 19,706 · -30.0%
- By 2075
- 14,742 · -47.6%
- By 2100
- 10,832 · -61.5%
Race, ethnicity, and origin ACS 2023
- Neighborhood character
- Predominantly White (96%)
- Race & ethnicity
- White 96% Two or more races 1%
- Common ancestry
- Lithuanian 6% Romanian 4% Slovak 2%
- Foreign-born
- 1% · Canada
Political lean MEDSL · Stone
- 2024 margin
- Solid R (+61.4) · D 18.9% · R 80.3%
- 2008→2024 swing
- -24.1pp toward R · 2008: -37.3pp · 2024: -61.4pp
- All cycles
- 2024: R+61.4 2020: R+61.1 2016: R+62.1 2012: R+49.2 2008: R+37.3
Not yet ingested
- Civics
- —
Market trends
- HPI YoY
- ▲ 2.63%
- Current HPI
- 204.4936
- Rent YoY
- —
- Metro
- —
- State GDP YoY
- ▲ 1.84%
- F500 in state
- 20
Industry mix (Fortune 500 HQ in MO)
| Industry | F500 HQs | Revenue |
|---|---|---|
| Healthcare | 1 | $163B |
|
||
| Insurance | 1 | $21B |
|
||
| Industrial Technology | 1 | $17B |
|
||
| Retail | 1 | $16B |
|
||
| Industrial Distribution | 1 | $10B |
|
||
| Utilities | 1 | $9B |
|
||
Price history
1 event — show timeline
- 2026-04-22 Listed $83,900 SOMO
Property tax history
+4.5%/yrLatest (2025): $526 · +1.7% YoY. Source: county tax records.
Cash-flow waterfall
monthlySold comps — $/sqft
last 12 mo · ≤1 miLoading sold comps…