210 Billwood Rd · Dayton, OH
Flood risk No data
- FEMA flood zone
- —
- Chance of flooding over 30 yrs
- —
- Est. flood insurance / yr
- —
Fire risk No data
- Est. fire insurance / yr
- —
Heat risk No data
- Hot days now (above threshold)
- —
- Hot days in 30 yrs
- —
Wind risk No data
- Chance of severe wind over 30 yrs
- —
Air-quality risk No data
- Unhealthy air days now
- —
- Unhealthy air days in 30 yrs
- —
Risk factors via First Street. Map © Google.
Why this score? — see what drove the B- grade
The composite is a weighted blend of 9 inputs, each scored 0–100. Each bar is that input's sub-score; the figure is the points it added to the 100-point composite (weight × sub-score).
- Cash flow +30.0/30.0
- 1% rule +10.0/10.0
- DSCR +10.0/10.0
- ARV discount +7.5/15.0
- Rent growth +3.9/5.0
- Livability +3.2/5.0
- Schools +1.3/10.0
- Condition / age +1.0/5.0
- Appreciation +0.0/10.0
$45,000
🖨 Deal sheet 📄 Offer letter ✓ Due diligence
Listing remarks
2018 Manufactured Home 3bd, 2ba, open floor plan. Larger lot, gutters and 10 & Atilde; & mdash; 12 barn. Located in woods mobile home park. $50,000 price is negotiable. Must get park approval. Please call/text 937-305-8305 leave message and I& apos; ll get back with you. * * please disregard the mess we are in the process of moving * *
Key facts
- Open floor plan
- Barn
- Larger lot
Tags
Property features AI
Exterior
- Home design: Built in 2018
- Construction: Living area approximately 1216
- Exterior features: Located in the Eastern Hills subdivision
Neighborhood map
What this means for you Summary
Snapshot
- This is a 3-bed/2.0-bath other listed at $45k. Condition is rated poor.
Deal economics
- At list price, monthly cash flow is $745 ($9k/yr) — positive.
- The deal already cash-flows at list — no discount required.
- Meets the 1% rule at list price ($1k rent vs $45k).
- Recommended offer: $44k (3.0% below list) — sets the bar for market timing.
- Cap rate 26.2% vs local median 7.4% in Dayton — top-decile yield for the area; either an underpriced asset or a hidden risk that comps aren't pricing in. Stress-test before assuming the spread holds.
Location & tenants
- Location reads 65/100 on livability (#716 in OH) — a middle-class / working-renter tenant base. Strengths: cost of living A+, housing A+, health & safety A; Watch: schools C-, amenities C-, crime F.
- Dayton City (urban): math 12% / reading 21% proficiency, ranked #641 of 656 in OH (top 98%) — low school quality limits family demand, transient renter base, plan for 1-2y turnover; 74% free/reduced lunch — lower-income household profile, screen leases tightly.
- Market conditions: Rents rising fast (+5.8%/yr); 124 active listings in the ZIP; 40 comparable units currently listed for rent nearby; rentals at typical pace (median 14d on market — plan ~3-4 weeks tenant-placement turnaround); solid renter incomes; 907 units permitted in Montgomery County in 2024 (416 in 5+ unit buildings).
Forward outlook
- Local home prices are declining (-3.0%/yr); year-one equity from $311 of loan paydown is wiped out by about $1k of value loss. Plan a longer hold.
- Montgomery County population projected at -10% by 2050 — secular population decline; favor cash flow + early exit over multi-decade hold.
- At projected returns (-3.0% appreciation + 5.8% rent growth), your $13k cash investment doubles in ~2 years — after that, you're playing with house money.
Negotiation context
- It's been on market 37 days — a 3% lower offer ($44k) is reasonable based on typical stale-listing flexibility.
Questions for the listing agent
- It's been on market 37 days. Have you received any prior offers? Is the seller open to a 3% concession, seller financing, or rate buy-down credit?
- Have any recent inspections been done? Can we get a copy of the seller's disclosures and any deferred-maintenance estimates?
- Is there a deadline driving the sale (1031 exchange, divorce, estate, relocation)? That informs how much negotiation room exists.
- Crime grade is F in this area — have there been break-ins, vandalism, or insurance claims at this property in the last 3 years? What carrier currently insures it and at what premium?
- What's the average days-on-market for RENTAL listings here right now (not sales)? A rising rental-DOM trend means longer vacancies and softer asking-rent achievability than the comps imply.
- What's the recent tenant-quality profile in this submarket — average credit score on applications, eviction rate, late-payment / NSF rate, and stable-employment percentage? A property-management company in the area should have these aggregated.
- How much new for-sale + rental construction is in the pipeline within 1–3 miles? Heavy new supply typically softens prices + rents 12–24 months out; constrained supply supports both.
Investment metrics
- 1% rule
- 2.97% ✓
- Cap rate
- 26.15%
- Cash-on-cash
- 70.93%
- DSCR
- 4.16
- GRM
- 2.8
CMA / ARV
No comps found within radius.
Projected returns pro-forma
-3.0% appreciation · 5.79% rent growth · sell at horizon
- IRR
- 73.7%
- Equity multiple
- 4.49×
- Total profit
- $44,018
- Equity at exit
- $6,710
- IRR
- 78.3%
- Equity multiple
- 10.23×
- Total profit
- $116,245
- Equity at exit
- $3,891
Cash invested: $12,600 (down + closing). Projections, not guarantees.
Landlord ↔ Tenant lean methodology
- Overall (STATE)
- 73 Landlord-Friendly
- State Ohio
- 73 Landlord-Friendly · R+6
- County
- — inherits STATE
- City
- — inherits STATE
ZIP-level market 45431
- Home prices YoY
- -35.0%
- Rents YoY
- 5.8%
- Active inventory
- 124
- Price-to-rent
- 2.8×
Monthly cashflow live
- Estimated rent
- $1,336 high interval (Pro) →
- Mortgage (P&I)
- −$236
- Tax est. 1.5%
- −$56 /mo · $675/yr
- Insurance
- −$19
- HOA
- −$0
- Vacancy / Maint / Mgmt
- −$281
- Net cashflow
- $745
Break-even live
UW: 25.0% down · 7.5% · 30yr · 1.5% tax · 5.0% vac · 8.0% maint · 8.0% mgmt
Financing live
Cash to close
- Down payment
- $11,250
- Closing costs
- $1,350
- Reserves months
- —
- Total cash needed
- —
Loan-product check · same deal, 3 products live
Conventional
25% down · 7.5% · 30yr
- Down + closing
- —
- Monthly P&I
- —
- Monthly cashflow
- —
- DSCR
- —
- Eligible?
- —
Personal DTI + credit; lowest rate.
DSCR
20% down · 8.5% · 30yr
- Down + closing
- —
- Monthly P&I
- —
- Monthly cashflow
- —
- DSCR
- —
- Eligible?
- —
No personal income docs; deal must DSCR.
Hard money
10% down · 12.0% · 12mo
- Down + closing
- —
- Monthly P&I
- —
- Monthly cashflow
- —
- DSCR
- —
- Eligible?
- —
Short-term bridge; refi at stabilization.
Rent comps 40 comps
| Address | Beds | Baths | Sqft | Rent | $/sqft | DOM | Units | Dist |
|---|---|---|---|---|---|---|---|---|
| 4644 Burkhardt Ave Dayton, OH | 1.0–2.0 | 1.0 | 725 | $1,095 | $1.51 | 2d | 9 | 0.14mi |
| 531 S Hayden Ave Dayton, OH | 3.0 | 1.0 | 1200 | $1,325 | $1.10 | 11d | 1 | 0.15mi |
| 4403 Burkhardt Ave Dayton, OH | 3.0 | 1.0–2.0 | 800 | $1,100 | $1.38 | 2d | 1 | 0.30mi |
| 515 Mertland Ave Dayton, OH | 2.0 | 1.0 | 876 | $950 | $1.08 | 23d | 1 | 0.35mi |
| 517 Mertland Ave Dayton, OH | 2.0 | 1.0 | 876 | $875 | $1.00 | 14d | 1 | 0.35mi |
| 1770 Suman Ave Dayton, OH | 2.0 | 1.0 | 904 | $1,145 | $1.27 | 43d | 1 | 0.36mi |
| 1704 Huffman Ave Unit 1706 Huffman Dayton, OH | 2.0 | 1.0 | 896 | $900 | $1.00 | 3d | 1 | 0.37mi |
| 1762 Suman Ave Dayton, OH | 2.0 | 1.0 | 804 | $1,150 | $1.43 | 21d | 1 | 0.37mi |
| 1671 Gummer Ave Dayton, OH | 2.0 | 1.0 | 704 | $1,100 | $1.56 | 2d | 1 | 0.46mi |
| 1620 Gummer Ave Dayton, OH | 2.0 | 1.0 | 875 | $950 | $1.09 | 3d | 1 | 0.52mi |
| 1029 Blakley Dr Dayton, OH | 3.0 | 1.0 | 947 | $1,300 | $1.37 | 2d | 1 | 0.57mi |
| 4924 Bayside Dr Dayton, OH | 3.0 | 2.0 | 1236 | $1,545 | $1.25 | 43d | 1 | 0.57mi |
| 3817 E 5th St Dayton, OH | 2.0 | 1.0 | 1178 | $1,295 | $1.10 | 2d | 1 | 0.60mi |
| 4013 E 3rd St Dayton, OH | 2.0 | 1.5 | 1144 | $1,095 | $0.96 | 14d | 1 | 0.65mi |
| 1143 Blakley Dr Dayton, OH | 3.0 | 1.0 | 947 | $1,195 | $1.26 | 14d | 1 | 0.69mi |
| 1356 Huffman Ave Unit 1356 Dayton, OH | 2.0 | 1.0 | 864 | $975 | $1.13 | 43d | 1 | 0.75mi |
| 144 N Quentin Ave Dayton, OH | 3.0 | 1.0 | 1038 | $1,600 | $1.54 | 43d | 1 | 0.79mi |
| 3719 E 3rd St Unit 3717 Dayton, OH | 3.0 | 1.0 | 1092 | $1,100 | $1.01 | 2d | 1 | 0.80mi |
| 3707 E 3rd St Unit 3705 Dayton, OH | 3.0 | 1.0 | 1410 | $1,045 | $0.74 | 23d | 1 | 0.81mi |
| 1371 Florence St Dayton, OH | 2.0 | 1.0 | 850 | $800 | $0.94 | 3d | 1 | 0.81mi |
| 211 N Cherrywood Ave Unit 2 Dayton, OH | 2.0 | 1.0 | 950 | $795 | $0.84 | 3d | 1 | 0.81mi |
| 1300 Chardon Ct Dayton, OH | 2.0 | 1.0 | 970 | $1,200 | $1.24 | 2d | 1 | 0.86mi |
| 210 S Hedges St Dayton, OH | 2.0 | 1.5 | 1048 | $1,045 | $1.00 | 21d | 1 | 0.88mi |
| 334 Blackwood Ave Unit 2 Dayton, OH | 2.0 | 1.0 | 1000 | $850 | $0.85 | 23d | 1 | 0.92mi |
| 334 Blackwood Ave Unit 3 Dayton, OH | 2.0 | 1.0 | 1000 | $850 | $0.85 | 3d | 1 | 0.92mi |
| 201 Pleasant Ave Unit 203 Dayton, OH | 2.0 | 1.0 | 1250 | $975 | $0.78 | 23d | 1 | 0.96mi |
| 3100 Linden Ave Unit 3102 Dayton, OH | 2.0 | 1.0 | 1035 | $995 | $0.96 | 43d | 1 | 0.99mi |
| 224 S Irwin St Unit 226 Dayton, OH | 2.0 | 1.0 | 992 | $900 | $0.91 | 3d | 1 | 1.01mi |
| 314 Sheridan Ave Dayton, OH | 3.0 | 1.0 | 1258 | $1,150 | $0.91 | 3d | 1 | 1.06mi |
| 1354 Ohmer St Unit 1354A Dayton, OH | 2.0 | 1.0 | 900 | $675 | $0.75 | 23d | 1 | 1.06mi |
| 1354 Ohmer St Unit 1356C Dayton, OH | 2.0 | 2.0 | 1200 | $900 | $0.75 | 43d | 1 | 1.06mi |
| 1354 Ohmer St Unit 1354C Dayton, OH | 2.0 | 1.0 | 900 | $700 | $0.78 | 43d | 1 | 1.06mi |
| 1520 S Smithville Rd Dayton, OH | 3.0 | 2.0 | 1481 | $1,345 | $0.91 | 2d | 1 | 1.09mi |
| 1430 Coventry Rd Dayton, OH | 2.0 | 1.0 | 1106 | $1,125 | $1.02 | 14d | 1 | 1.13mi |
| 706 Kolping Ave Unit 706 Dayton, OH | 3.0 | 1.5 | 1172 | $1,300 | $1.11 | 2d | 1 | 1.16mi |
| 1659 Hearthstone Dr Dayton, OH | 3.0 | 1.0 | 1102 | $1,195 | $1.08 | 2d | 1 | 1.17mi |
| 101 N Irwin St Dayton, OH | 2.0 | 1.0 | 900 | $1,100 | $1.22 | 3d | 1 | 1.20mi |
| 120 S Monmouth St Dayton, OH | 2.0 | 1.0 | 1000 | $950 | $0.95 | 43d | 1 | 1.22mi |
| 4500 Elliot Ave Dayton, OH | 2.0 | 1.5 | 1283 | $1,250 | $0.97 | 2d | 1 | 1.29mi |
| 854 Santa Cruz Ave Dayton, OH | 3.0 | 1.0 | 1060 | $1,300 | $1.23 | 43d | 1 | 1.33mi |
Listing history 16 events
-
2026-06-18days on market $45,000 Active 37 DOM
-
2026-06-17days on market $45,000 Active 36 DOM
-
2026-06-16pricedays on market $45,000 Active 35 DOM
-
2026-06-15days on market $50,000 Active 34 DOM
-
2026-06-14days on market $50,000 Active 32 DOM
-
2026-06-13days on market $50,000 Active 31 DOM
-
2026-06-10days on market $50,000 Active 29 DOM
-
2026-06-09days on market $50,000 Active 28 DOM
-
2026-06-08days on market $50,000 Active 27 DOM
-
2026-06-07days on market $50,000 Active 26 DOM
-
2026-06-05days on market $50,000 Active 23 DOM
-
2026-06-03days on market $50,000 Active 22 DOM
-
2026-06-02days on market $50,000 Active 21 DOM
-
2026-06-01days on market $50,000 Active 20 DOM
-
2026-05-31days on market $50,000 Active 19 DOM
-
2026-05-12$50,000 Active 327-char remark
ⓘ Source: listings_history table (triggers on properties + properties_extension) + one-shot
backfill from property_details.listing_events for pre-trigger history.
Nearby sold comps map
Loading sold comps map…
Walkable amenities ~0.75 mi
Loading nearby amenities…
Taxation est. · year 1
- Rental income
- $16,036
- − Mortgage interest
- −$2,521
- − Property taxes
- −$675
- − Insurance
- −$225
- − Repairs & maintenance
- −$1,283
- − Management
- −$1,283
- − Depreciation
- −$1,309
- Taxable income
- $8,741
- Est. tax owed @ 24.0%
- −$2,098
- After-tax cash flow
- $6,839/yr
For passive investors: Depreciation is non-cash, so a rental often shows a tax loss while cash-flowing — sheltering income. Rental losses are passive: they offset passive income freely, and up to $25,000/yr can offset ordinary (W-2) income if you actively participate and your MAGI is under $100k (phasing out to $0 by $150k); unused losses carry forward. On sale, claimed depreciation is recaptured at up to 25%, and gains may owe capital-gains tax (a 1031 exchange can defer both). Figures are a year-1 estimate at your 24.0% rate — not tax advice; consult a CPA.
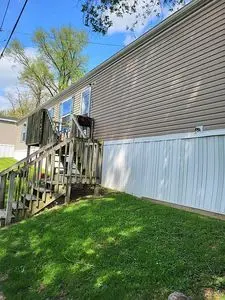
Condition & rehab AI · 1 photo
This home requires extensive repairs, including a damaged fence and worn siding, significantly impacting its value. Immediate repairs are needed to improve its condition and increase its resale or rental value.
Repairs flagged
- Major fence — Structural damage and leaning
- Major siding — Significant wear and tear
Value-add opportunities
- Both repair and replace fence — Improves safety and curb appeal
- Both repair and replace siding — Enhances home's appearance and value
- Both paint interior and exterior — Fresh paint improves home's appearance and value
Renovation cost estimate screening
| Repair item | Severity | Est. cost |
|---|---|---|
| fence · Structural damage and leaning | Major | $15,000–50,000 |
| siding · Significant wear and tear | Major | $15,000–50,000 |
| Total estimated repair cost · 2 items | $30,000–100,000 |
Value-add ROI direction
- Both repair and replace fence — Improves safety and curb appeal ↑
- Both repair and replace siding — Enhances home's appearance and value ↑
- Both paint interior and exterior — Fresh paint improves home's appearance and value ↑
ⓘ Cost ranges are severity-bucket heuristics (US national rule-of-thumb). Get contractor quotes + a written scope before underwriting a rehab budget.
Schools (NCES district)
- District
- Dayton City
- NCES district ID
- 3904384
- Math proficiency
- 12% ▼ -12.00%
- Reading proficiency
- 21% ▼ -11.00%
- Median HH income
- $28,688
- Composite
- 12.94/100
- National rank
- #9579
- State rank
- #641 of 656 in OH
Livability — Dayton
- Score
- 65/100
- State rank
- #716
- US rank
- #12895
Category grades
Schools grade is shown separately in the Schools card above.
Census & demographics
- Census place
- Dayton, OH
- County
- Greene County · 132,120 people
- City population
- 164,387
- Metro
- Dayton-Kettering, OH
- Population (ZIP)
- 27,951
- Household income
- $83,175
- Rent vs Own
- Severe rent burden
- 622.0
Population outlook (Montgomery County) Hauer SSP2
- Today (2025)
- 523,241 people
- By 2030
- 514,948 · -1.6%
- By 2040
- 493,378 · -5.7%
- By 2050
- 469,639 · -10.2%
- By 2075
- 418,360 · -20.0%
- By 2100
- 353,315 · -32.5%
Race, ethnicity, and origin ACS 2023
- Neighborhood character
- Predominantly White (78%)
- Race & ethnicity
- White 78% Two or more races 8% Hispanic / Latino 6% Asian 5% Black 4%
- Hispanic origin (detail)
- Mexican 1% Puerto Rican 2%
- Common ancestry
- Italian 3% Slovak 2% Lithuanian 2%
- Foreign-born
- 6% · South Korea, Canada, Jamaica
- Languages at home
- 92% English-only · Spanish 3% Other Indo-European 2% Korean 1%
Political lean MEDSL · Montgomery
- 2024 margin
- Toss-up / Even · D 49.8% · R 49.3%
- 2008→2024 swing
- -5.8pp toward R · 2008: 6.2pp · 2024: 0.5pp
- All cycles
- 2024: D+0.5 2020: D+2.2 2016: R+1.2 2012: D+3.1 2008: D+6.2
Not yet ingested
- Civics
- —
Market trends
- HPI YoY
- ▼ -148.58%
- Current HPI
- 276.444
- Rent YoY
- ▲ 5.79%
- Metro
- Dayton-Kettering, OH
- State GDP YoY
- ▲ 1.98%
- F500 in state
- 48
Industry mix (Fortune 500 HQ in OH)
| Industry | F500 HQs | Revenue |
|---|---|---|
| Insurance | 3 | $145B |
|
||
| Industrial Machinery | 3 | $49B |
|
||
| Financial Services | 3 | $24B |
|
||
| Consumer Goods | 2 | $93B |
|
||
| Aerospace / Defense | 2 | $47B |
|
||
| Utilities | 2 | $33B |
|
||
Price history
-10.0% since first listed2 events — show timeline
- 2026-06-16 Price Changed $45,000 FSBO.com
- 2026-05-12 Listed $50,000 FSBO.com
Cash-flow waterfall
monthlySold comps — $/sqft
last 12 mo · ≤1 miLoading sold comps…