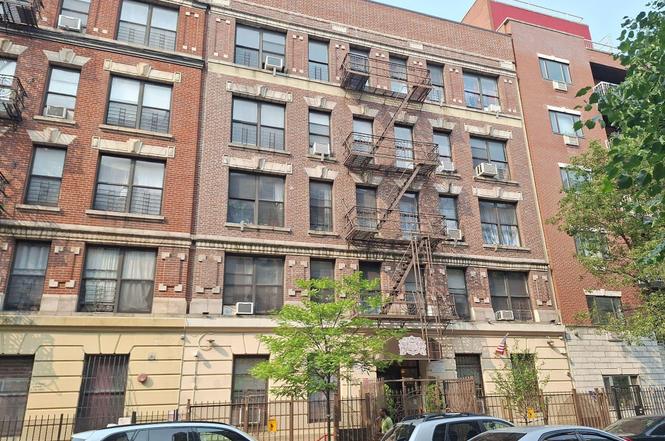
536 W 163rd St Unit 3D · New York, NY
Flood risk 1/10 · Minimal
- FEMA flood zone
- X (unshaded)
- Chance of flooding over 30 yrs
- 0.0%
- Est. flood insurance / yr
- $507 – $1,088
Fire risk 1/10 · Minimal
- Est. fire insurance / yr
- $691 – $1,283
Heat risk 6/10 · Moderate
- Hot days now (above 99°F)
- 6 days/yr
- Hot days in 30 yrs
- 13 days/yr
Wind risk 6/10 · Moderate
- Chance of severe wind over 30 yrs
- 27.0%
Air-quality risk 4/10 · Minor
- Unhealthy air days now
- 5 days/yr
- Unhealthy air days in 30 yrs
- 6 days/yr
Risk factors via First Street. Map © Google.
Why this score? — see what drove the D grade
The composite is a weighted blend of 9 inputs, each scored 0–100. Each bar is that input's sub-score; the figure is the points it added to the 100-point composite (weight × sub-score).
- Appreciation +8.8/10.0
- Cash flow +7.7/30.0
- ARV discount +7.5/15.0
- Schools +5.0/10.0
- Livability +3.8/5.0
- Rent growth +3.2/5.0
- Condition / age +2.5/5.0
- 1% rule +2.3/10.0
- DSCR +1.8/10.0
$610,000
🖨 Deal sheet (PDF) 📄 Offer letter ✓ Due diligence
Listing remarks MLS
This Co-op Style Home Features 3 Bedrooms, Full Bath and Eat in Kitchen. The information provided is estimated to the best of our abilities at this time.
Key facts
- Built 1920
- Listed 380 days
Property features AI
Finance
- HOA & community: Has association; Association fee includes: Other
Exterior
- Parking: No carport
- Utilities: Sewer: Other; Utilities: See remarks
- Home design: Stock cooperative
- Construction: Brick construction
- Exterior features: Brick construction; Not waterfront
Interior
- Kitchen: No appliances listed
- Bedrooms: Total of 5 rooms (bedrooms and living spaces combined)
- Bathrooms: 1 full bathroom
- Heating & cooling: Hot water heating (oil); No central air conditioning
- Interior features: Eat-in kitchen; No central cooling; Hot water heating (oil)
- Laundry & utility: No basement
Neighborhood map
What this means for you Summary
Snapshot
- This is a 3-bed/1.0-bath condo listed at $610k.
Deal economics
- At list price, monthly cash flow is $-703 ($-8k/yr) — negative.
- To cash-flow at today's rent, offer at most $508k (16.7% below list).
- To meet the 1% rule (rent ≥ 1% of price), the offer needs to be $445k (27.1% below list).
- Recommended offer: $445k (27.1% below list) — sets the bar for 1% rule.
- Cap rate 4.9% vs local median 2.6% in New York — top-decile yield for the area; either an underpriced asset or a hidden risk that comps aren't pricing in. Stress-test before assuming the spread holds.
Location & tenants
- Location reads 75/100 on livability (#268 in NY, #4,188 nationally) — a middle-class / working-renter tenant base. Strengths: amenities A+, commute A+, health & safety A; Watch: crime F, cost of living F.
- Market conditions: Rents rising (+2.8%/yr); 79 active listings in the ZIP; 2 comparable units currently listed for rent nearby; 4,467 units permitted in New York County in 2024 (4,463 in 5+ unit buildings).
- At $4,446/mo this rent would consume 94% of the median local household income ($57k/yr) (locally 5464% of renters already pay >50% of income on rent) — very limited rent-growth headroom before tenants either downsize or default.
Forward outlook
- In year one you build about $51k of equity ($4k loan paydown + $47k appreciation (7.7% local appreciation)).
- New York County population projected at +21% by 2050 — long-run rental-demand tailwind backs the buy-and-hold thesis.
- By year 2, paydown + projected appreciation supports a ~$82k cash-out refi (75% LTV) — recoverable capital for the next deal without selling this one.
Negotiation context
- It's been on market 380 days — a 12% lower offer ($537k) is reasonable based on typical stale-listing flexibility.
- 2 sale attempts with the ask held roughly flat each time — persistent listings suggest the price (not the market) is what's stuck; bring a comps-based counter.
Risks & watch-outs
- Watch-outs: built in 1920 — expect roof / HVAC / electrical / plumbing capex.
- Climate carrying-cost: major wind risk, 27% chance of damaging wind over 30y; extreme-heat days projected 6→13/yr by 2055 (HVAC capex compounding) — expect insurance premiums to compound above CPI over the hold.
Questions for the listing agent
- What do current leases actually rent for vs. the listed asking? Can we see a recent rent roll and the last 12 months of T-12 income?
- It's been on market 380 days. Have you received any prior offers? Is the seller open to a 27% concession, seller financing, or rate buy-down credit?
- Built in 1920 — when were the roof, HVAC, electrical panel, plumbing, and water heater last replaced?
- Any open or pending special assessments — roof, HVAC, plumbing, elevator, façade? What's the per-unit balance and payoff schedule, and is the seller paying it off at close or rolling it to the buyer?
- Why hasn't it sold? Are there any deal-killer items the seller is aware of (foundation, flood, title, zoning, code violations)?
- Is there a deadline driving the sale (1031 exchange, divorce, estate, relocation)? That informs how much negotiation room exists.
- Schools are B-rated — typically a magnet for longer-tenancy family renters. What's the average tenant stay here, and is there a school-zone premium baked into asking?
- Crime grade is F in this area — have there been break-ins, vandalism, or insurance claims at this property in the last 3 years? What carrier currently insures it and at what premium?
- The area grade is low — what's the realistic commute time and amenity access for the typical tenant pool here? Any planned neighborhood developments (good or bad) we should know about?
- What's the average days-on-market for RENTAL listings here right now (not sales)? A rising rental-DOM trend means longer vacancies and softer asking-rent achievability than the comps imply.
- What's the recent tenant-quality profile in this submarket — average credit score on applications, eviction rate, late-payment / NSF rate, and stable-employment percentage? A property-management company in the area should have these aggregated.
- How much new apartment / multifamily construction is in the pipeline within 1–3 miles? Heavy new supply (>2% of stock underway) typically softens rents 12–24 months out; light construction supports rent growth.
Investment metrics
- 1% rule
- 0.73% ✗
- Cap rate
- 4.91%
- Cash-on-cash
- -4.94%
- DSCR
- 0.78
- GRM
- 11.4
CMA / ARV
No comps found within radius.
Projected returns pro-forma
7.66% appreciation · 2.84% rent growth · sell at horizon
- IRR
- 15.4%
- Equity multiple
- 2.13×
- Total profit
- $192,691
- Equity at exit
- $449,412
- IRR
- 15.1%
- Equity multiple
- 4.46×
- Total profit
- $590,795
- Equity at exit
- $879,028
Cash invested: $170,800 (down + closing). Projections, not guarantees.
Landlord ↔ Tenant lean methodology
- Overall (CITY)
- 0 Strongly Tenant-Friendly
- State New York
- 15 Strongly Tenant-Friendly · D+10
- County
- — inherits STATE
- City New York
- 0 Strongly Tenant-Friendly · D+34
ZIP-level market 10032
- Home prices YoY
- 1.8%
- Rents YoY
- 2.8%
- Active inventory
- 79
- Price-to-rent
- 11.4×
Monthly cashflow live
- Estimated rent
- $4,446 medium interval (Pro) →
- Mortgage (P&I)
- −$3,199
- Tax est. 1.5%
- −$762 /mo · $9,150/yr
- Insurance
- −$254
- HOA
- −$0
- Vacancy / Maint / Mgmt
- −$934
- Net cashflow
- $-703
Break-even live
Sensitivity live
| Price | -10% $-281 | -5% $-492 | +0% $-703 | +5% $-914 | +10% $-1,124 |
|---|---|---|---|---|---|
| Rent | -10% $-1,054 | -5% $-879 | +0% $-703 | +5% $-527 | +10% $-352 |
| Rate | -1.0pp $-396 | -0.5pp $-548 | base $-703 | +0.5pp $-861 | +1.0pp $-1,022 |
UW: 25.0% down · 7.5% · 30yr · 1.5% tax · 5.0% vac · 8.0% maint · 8.0% mgmt
Financing live
Cash to close
- Down payment
- $152,500
- Closing costs
- $18,300
- Reserves months
- —
- Total cash needed
- —
Loan-product check · same deal, 3 products live
Conventional
25% down · 7.5% · 30yr
- Down + closing
- —
- Monthly P&I
- —
- Monthly cashflow
- —
- DSCR
- —
- Eligible?
- —
Personal DTI + credit; lowest rate.
DSCR
20% down · 8.5% · 30yr
- Down + closing
- —
- Monthly P&I
- —
- Monthly cashflow
- —
- DSCR
- —
- Eligible?
- —
No personal income docs; deal must DSCR.
Hard money
10% down · 12.0% · 12mo
- Down + closing
- —
- Monthly P&I
- —
- Monthly cashflow
- —
- DSCR
- —
- Eligible?
- —
Short-term bridge; refi at stabilization.
Rent comps 2 comps
| Address | Beds | Baths | Sqft | Rent | $/sqft | DOM | Units | Dist |
|---|---|---|---|---|---|---|---|---|
| 40 Pinehurst Ave Ph 7B New York, NY | 2.0 | 2.0 | 1043 | $5,200 | $4.99 | 12d | 1 | 0.88mi |
| 300 W 135th St Unit 9G New York, NY | 3.0 | 2.0 | 1032 | $5,500 | $5.33 | 6d | 1 | 1.46mi |
HOA detail condo
- Monthly dues
- $0 · $0/yr
- Assessments
- None detected in remarks — confirm with the listing agent.
Listing history 14 events
-
2026-06-21days on market $610,000 Active 380 DOM
-
2026-06-18days on market $610,000 Active 377 DOM
-
2026-06-17days on market $610,000 Active 376 DOM
-
2026-06-15days on market $610,000 Active 374 DOM
-
2026-06-13days on market $610,000 Active 372 DOM
-
2026-06-10days on market $610,000 Active 368 DOM
-
2026-06-08days on market $610,000 Active 367 DOM
-
2026-06-03days on market $610,000 Active 362 DOM
-
2026-06-01days on market $610,000 Active 360 DOM
-
2026-05-31days on market $610,000 Active 359 DOM
-
2026-02-09price $610,000 153-char remark
Show marketing remark (153 chars)
This Co-op Style Home Features 3 Bedrooms, Full Bath and Eat in Kitchen. The information provided is estimated to the best of our abilities at this time.
-
2026-02-09price $610,000
Show marketing remark (153 chars)
This Co-op Style Home Features 3 Bedrooms, Full Bath and Eat in Kitchen. The information provided is estimated to the best of our abilities at this time.
-
2026-01-06$625,000 Active 153-char remark
Show marketing remark (153 chars)
This Co-op Style Home Features 3 Bedrooms, Full Bath and Eat in Kitchen. The information provided is estimated to the best of our abilities at this time.
-
2025-06-06$625,000 Active
ⓘ Source: listings_history table (triggers on properties + properties_extension) + one-shot
backfill from property_details.listing_events for pre-trigger history.
Climate risk First Street
- Flood 1/10 Low FEMA zone X (unshaded) · 0% chance over 30 yrs
- Wildfire 1/10 Low
- Heat 6/10 Major 6 d/yr ≥99°F today · 13 d/yr by 30 yrs out
- Wind 6/10 Major 27% chance of damaging wind over 30 yrs
- Air quality 4/10 Moderate 5 unhealthy d/yr today · 6 by 30 yrs out
Nearby sold comps map
Loading sold comps map…
Walkable amenities ~0.75 mi
Loading nearby amenities…
Taxation est. · year 1
- Rental income
- $53,357
- − Mortgage interest
- −$34,169
- − Property taxes
- −$9,150
- − Insurance
- −$3,050
- − Repairs & maintenance
- −$4,269
- − Management
- −$4,269
- − Depreciation
- −$17,745
- Taxable loss
- −$19,295
- Est. tax savings @ 24.0%
- +$4,631
- After-tax cash flow
- $-3,804/yr
For passive investors: Depreciation is non-cash, so a rental often shows a tax loss while cash-flowing — sheltering income. Rental losses are passive: they offset passive income freely, and up to $25,000/yr can offset ordinary (W-2) income if you actively participate and your MAGI is under $100k (phasing out to $0 by $150k); unused losses carry forward. On sale, claimed depreciation is recaptured at up to 25%, and gains may owe capital-gains tax (a 1031 exchange can defer both). Figures are a year-1 estimate at your 24.0% rate — not tax advice; consult a CPA.
Schools (NCES district)
No district data.
Livability — New York
- Score
- 75/100
- State rank
- #268
- US rank
- #4188
Category grades
Schools grade is shown separately in the Schools card above.
Census & demographics
- Census place
- New York, NY
- County
- New York County · 1,599,927 people
- City population
- 7,731,280
- Metro
- New York-Newark-Jersey City, NY-NJ-PA
- Population (ZIP)
- 55,610
- Household income
- $56,829
- Rent vs Own
- Severe rent burden
- 5464.0
Population outlook (New York County) Hauer SSP2
- Today (2025)
- 1,825,725 people
- By 2030
- 1,904,611 · +4.3%
- By 2040
- 2,052,719 · +12.4%
- By 2050
- 2,206,601 · +20.9%
- By 2075
- 2,509,427 · +37.4%
- By 2100
- 2,702,933 · +48.0%
Race, ethnicity, and origin ACS 2023
- Neighborhood character
- Diverse neighborhood (Simpson 0.57)
- Race & ethnicity
- Hispanic / Latino 62% White 17% Two or more races 14% Black 12% Asian 5%
- Hispanic origin (detail)
- Mexican 5% Puerto Rican 4% Dominican 42%
- Common ancestry
- Romanian 1% Hispanic 1% Lithuanian 1%
- Foreign-born
- 44% · Canada, China
- Languages at home
- 38% English-only · Spanish 54% Other Indo-European 3% Chinese 2%
Political lean MEDSL · New York
- 2024 margin
- Solid D (+64.8) · D 82.4% · R 17.6%
- 2008→2024 swing
- -7.4pp toward R · 2008: 72.2pp · 2024: 64.8pp
- All cycles
- 2024: D+64.8 2020: D+74.5 2016: D+77.2 2012: D+69.6 2008: D+72.2
Not yet ingested
- Civics
- —
Market trends
- HPI YoY
- ▲ 7.66%
- Current HPI
- 431.3199
- Rent YoY
- ▲ 2.84%
- Metro
- New York-Newark-Jersey City, NY-NJ-PA
- State GDP YoY
- ▲ 2.60%
- F500 in state
- 92
Industry mix (Fortune 500 HQ in NY)
| Industry | F500 HQs | Revenue |
|---|---|---|
| Financial Services | 10 | $950B |
|
||
| Consumer Goods | 9 | $162B |
|
||
| Insurance | 4 | $225B |
|
||
| Telecommunications | 2 | $144B |
|
||
| Pharmaceuticals | 2 | $112B |
|
||
| Media / Entertainment | 2 | $69B |
|
||
Price history
-2.4% since first listed4 events — show timeline
- 2026-02-09 Price Changed $610,000 RLS at REBNY
- 2026-02-09 Price Changed $610,000 OneKey® MLS as Distributed by MLS Grid
- 2026-01-06 Listed $625,000 RLS at REBNY
- 2025-06-06 Listed $625,000 OneKey® MLS as Distributed by MLS Grid
Cash-flow waterfall
monthlySold comps — $/sqft
last 12 mo · ≤1 miLoading sold comps…