958 Pickens Chapel · Letona, AR
Flood risk 6/10 · Moderate
- FEMA flood zone
- A
- Chance of flooding over 30 yrs
- 0.72%
- Est. flood insurance / yr
- $1,009 – $1,996
Fire risk 5/10 · Moderate
- Est. fire insurance / yr
- $1,499 – $2,785
Heat risk 5/10 · Moderate
- Hot days now (above 111°F)
- 7 days/yr
- Hot days in 30 yrs
- 19 days/yr
Wind risk 3/10 · Minor
- Chance of severe wind over 30 yrs
- 7.0%
Air-quality risk 2/10 · Minimal
- Unhealthy air days now
- 0 days/yr
- Unhealthy air days in 30 yrs
- 1 days/yr
Risk factors via First Street. Map © Google.
Why this score? — see what drove the B- grade
The composite is a weighted blend of 9 inputs, each scored 0–100. Each bar is that input's sub-score; the figure is the points it added to the 100-point composite (weight × sub-score).
- Cash flow +30.0/30.0
- 1% rule +10.0/10.0
- DSCR +10.0/10.0
- ARV discount +7.5/15.0
- Schools +3.8/10.0
- Livability +2.7/5.0
- Rent growth +2.5/5.0
- Condition / age +2.5/5.0
- Appreciation +0.0/10.0
$55,000
🖨 Deal sheet (PDF) 📄 Offer letter ✓ Due diligence
Listing remarks MLS
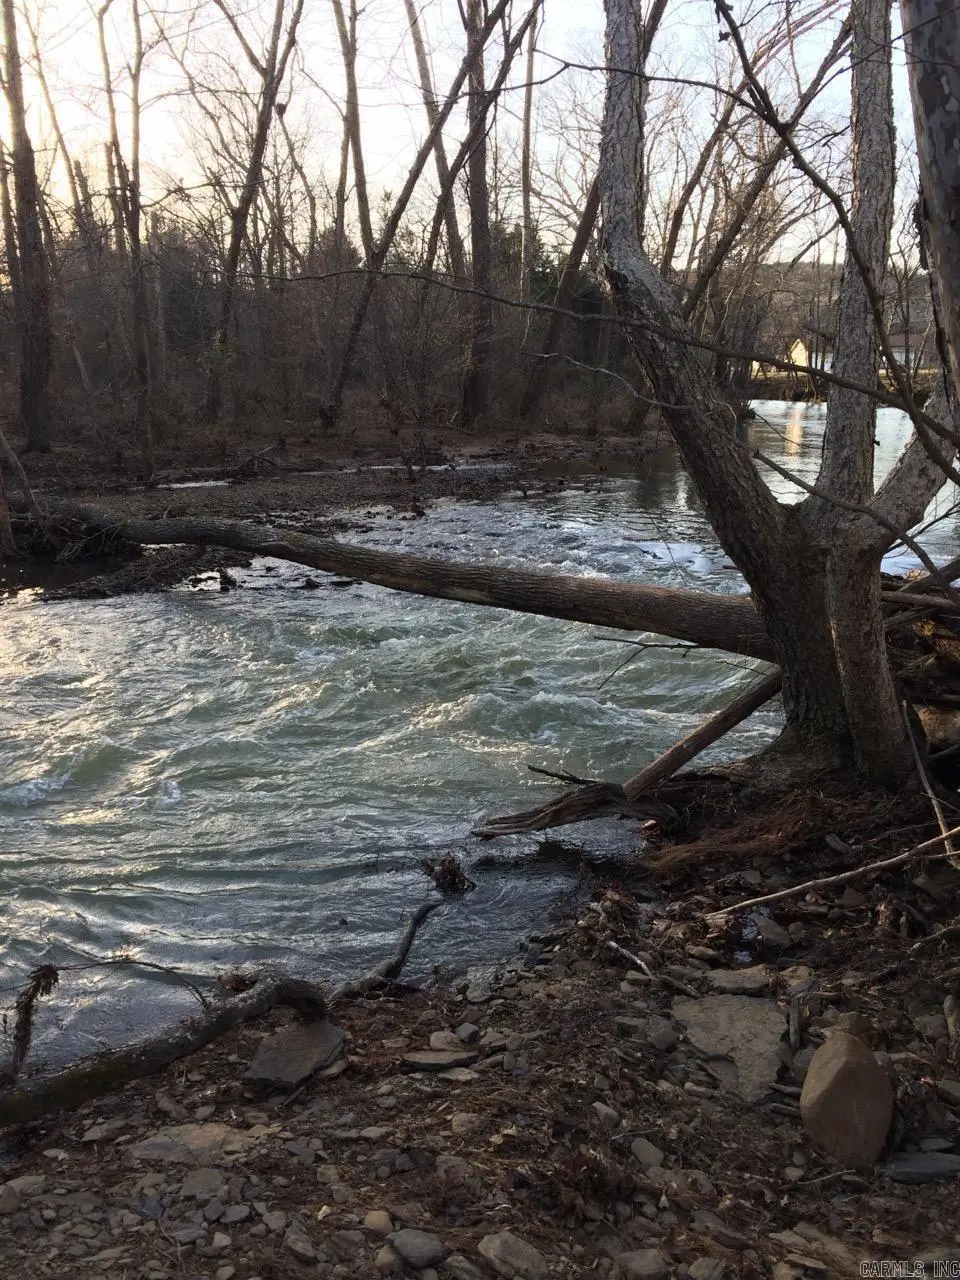
A little piece of paradise with a year around swimming hole on the back of the property (Panther Creek). Gotta see it to believe it! Storage buildings! Extra RV hook-up! Deer and wild life in your own front yard!
Key facts
- Creek in the back
- Wooded for privacy
- 2.07 acre lot
Tags
Property features AI
Finance
- Financial info: Financing available: conventional new loan, cash, or in‑house financing
Exterior
- Parking: Other parking (see remarks)
- Utilities: Public water; Septic system; Electric via cooperative
- Home design: Other exterior (see remarks)
- Construction: Metal roof; Foundation not permanent; Other foundation (see remarks); Approximately 2.07 acres; Lot dimensions approximately 660 x 135 x 673 x 129; Lot acreage source: survey
- Exterior features: Level lot with creek; Rural property
Interior
- Kitchen: Free‑standing stove; Microwave; Dishwasher
- Flooring: Carpet; Other (see remarks)
- Bathrooms: 2 full bathrooms
- Heating & cooling: Central electric heat; Central electric cooling
- Interior features: Carpet flooring; Other flooring (see remarks); Laundry room
- Laundry & utility: Laundry area
Neighborhood map
What this means for you Summary
Snapshot
- This is a 2-bed/2.0-bath land listed at $55k.
Deal economics
- At list price, monthly cash flow is $296 ($4k/yr) — positive.
- The deal already cash-flows at list — no discount required.
- Meets the 1% rule at list price ($946 rent vs $55k).
- Recommended offer: $52k (6.0% below list) — sets the bar for market timing.
Location & tenants
- Location reads 54/100 on livability (#416 in AR) — a working-class tenant base; expect higher turnover. Strengths: cost of living A+, housing A+; Watch: crime F, amenities F, commute F.
- Searcy School District (town): math 47% / reading 43% proficiency, ranked #37 of 238 in AR (top 16%) — families likely to look elsewhere, expect single-tenant / working-renter base with shorter leases.
- Zoned schools: Mcrae Elementary School (math 52% / reading 37%, grade F, #143 of 454 statewide, top 36%, 422 students, 58% FRL); Southwest Middle School (math 51% / reading 42%, grade D+, #49 of 201 statewide, top 26%, 910 students, 50% FRL); Searcy High School (math 30% / reading 42%, grade F, #81 of 292 statewide, top 29%, 1,166 students, 39% FRL).
- Market conditions: 176 active listings in the ZIP; 219 units permitted in White County in 2024 (36 in 5+ unit buildings).
Forward outlook
- Local home prices are declining (-3.0%/yr); year-one equity from $380 of loan paydown is wiped out by about $2k of value loss. Plan a longer hold.
- White County population projected at +7% by 2050 — modest demand growth; plan on rents tracking national, not racing it.
- At projected returns (-3.0% appreciation + 3.0% rent growth), your $15k cash investment doubles in ~6 years — after that, you're playing with house money.
Negotiation context
- It's been on market 64 days — a 6% lower offer ($52k) is reasonable based on typical stale-listing flexibility.
- 3 sale attempts since 17y ago with the ask held roughly flat each time — persistent listings suggest the price (not the market) is what's stuck; bring a comps-based counter.
- Current owner paid $22k; list at $55k implies a 144% gain — meaningful room to come down on a strong offer.
Risks & watch-outs
- Watch-outs: flood insurance adds $125/mo.
- Climate carrying-cost: in FEMA flood zone A (mandatory federal flood insurance); moderate wildfire risk; extreme-heat days projected 7→19/yr by 2055 (HVAC capex compounding) — expect insurance premiums to compound above CPI over the hold.
Questions for the listing agent
- It's been on market 64 days. Have you received any prior offers? Is the seller open to a 6% concession, seller financing, or rate buy-down credit?
- Built in 1979 — when were the roof, HVAC, electrical panel, plumbing, and water heater last replaced?
- What's the actual annual flood-insurance premium (NFIP or private), and is the property in a SFHA with mandatory coverage?
- Why hasn't it sold? Are there any deal-killer items the seller is aware of (foundation, flood, title, zoning, code violations)?
- Is there a deadline driving the sale (1031 exchange, divorce, estate, relocation)? That informs how much negotiation room exists.
- Schools are F-rated, which usually means shorter tenancies and higher turnover. Who's the typical renter profile here, and what's been the actual vacancy rate?
- Crime grade is F in this area — have there been break-ins, vandalism, or insurance claims at this property in the last 3 years? What carrier currently insures it and at what premium?
- What's the average days-on-market for RENTAL listings here right now (not sales)? A rising rental-DOM trend means longer vacancies and softer asking-rent achievability than the comps imply.
- What's the recent tenant-quality profile in this submarket — average credit score on applications, eviction rate, late-payment / NSF rate, and stable-employment percentage? A property-management company in the area should have these aggregated.
- How much new for-sale + rental construction is in the pipeline within 1–3 miles? Heavy new supply typically softens prices + rents 12–24 months out; constrained supply supports both.
Investment metrics
- 1% rule
- 1.72% ✓
- Cap rate
- 15.49%
- Cash-on-cash
- 32.85%
- DSCR
- 2.46
- GRM
- 4.8
CMA / ARV
No comps found within radius.
Projected returns pro-forma
-3.0% appreciation · 3.0% rent growth · sell at horizon
- IRR
- 16.2%
- Equity multiple
- 1.65×
- Total profit
- $10,017
- Equity at exit
- $8,201
- IRR
- 24.8%
- Equity multiple
- 3.16×
- Total profit
- $33,258
- Equity at exit
- $4,755
Cash invested: $15,400 (down + closing). Projections, not guarantees.
Landlord ↔ Tenant lean methodology
- Overall (STATE)
- 92 Strongly Landlord-Friendly
- State Arkansas
- 92 Strongly Landlord-Friendly · R+14
- County
- — inherits STATE
- City
- — inherits STATE
ZIP-level market 72143
- Home prices YoY
- -28.4%
- Active inventory
- 176
- Price-to-rent
- 4.8×
Monthly cashflow live
- Estimated rent
- $946 medium interval (Pro) →
- Mortgage (P&I)
- −$288
- Tax from tax record
- −$14 /mo · $172/yr
- Insurance
- −$23
- Flood insurance flood zone
- −$125 /mo · $1,502/yr
- HOA
- −$0
- Lot rent
- −$0
- Vacancy / Maint / Mgmt
- −$199
- Net cashflow
- $296
Break-even live
Sensitivity live
| Price | -10% $327 | -5% $312 | +0% $296 | +5% $281 | +10% $265 |
|---|---|---|---|---|---|
| Rent | -10% $222 | -5% $259 | +0% $296 | +5% $334 | +10% $371 |
| Rate | -1.0pp $324 | -0.5pp $310 | base $296 | +0.5pp $282 | +1.0pp $268 |
UW: 25.0% down · 7.5% · 30yr · 1.5% tax · 5.0% vac · 8.0% maint · 8.0% mgmt
Financing live
Cash to close
- Down payment
- $13,750
- Closing costs
- $1,650
- Reserves months
- —
- Total cash needed
- —
Loan-product check · same deal, 3 products live
Conventional
25% down · 7.5% · 30yr
- Down + closing
- —
- Monthly P&I
- —
- Monthly cashflow
- —
- DSCR
- —
- Eligible?
- —
Personal DTI + credit; lowest rate.
DSCR
20% down · 8.5% · 30yr
- Down + closing
- —
- Monthly P&I
- —
- Monthly cashflow
- —
- DSCR
- —
- Eligible?
- —
No personal income docs; deal must DSCR.
Hard money
10% down · 12.0% · 12mo
- Down + closing
- —
- Monthly P&I
- —
- Monthly cashflow
- —
- DSCR
- —
- Eligible?
- —
Short-term bridge; refi at stabilization.
Listing history 27 events
-
2026-06-22days on market $55,000 Active 64 DOM
-
2026-06-21days on market $55,000 Active 63 DOM
-
2026-06-19days on market $55,000 Active 61 DOM
-
2026-06-18days on market $55,000 Active 60 DOM
-
2026-06-17days on market $55,000 Active 59 DOM
-
2026-06-16days on market $55,000 Active 58 DOM
-
2026-06-15days on market $55,000 Active 57 DOM
-
2026-06-14days on market $55,000 Active 55 DOM
-
2026-06-12days on market $55,000 Active 54 DOM
-
2026-06-09statusdays on market $55,000 Active 51 DOM
-
2026-06-08days on market $55,000 Back on Market 50 DOM
-
2026-06-07days on market $55,000 Back on Market 49 DOM
-
2026-06-05days on market $55,000 Back on Market 46 DOM
-
2026-06-03days on market $55,000 Back on Market 45 DOM
-
2026-06-03status $55,000 Back on Market 44 DOM
-
2026-06-02days on market $55,000 Take Backups 44 DOM
-
2026-06-01days on market $55,000 Take Backups 43 DOM
-
2026-05-31days on market $55,000 Take Backups 42 DOM
-
2026-05-30days on market $55,000 Take Backups 41 DOM
-
2026-05-11historical Take Backups 381-char remark
-
2026-04-19$55,000 New Listing 381-char remark
-
2025-09-30soldstatus $22,500
-
2015-01-29soldstatus $15,000
-
2010-07-13soldstatus $65,000
-
2010-07-09soldstatus $65,000 213-char remark
Show marketing remark (213 chars)
A little piece of paradise with a year around swimming hole on the back of the property (Panther Creek). Gotta see it to believe it! Storage buildings! Extra RV hook-up! Deer and wild life in your own front yard!
-
2010-06-29historical 213-char remark
Show marketing remark (213 chars)
A little piece of paradise with a year around swimming hole on the back of the property (Panther Creek). Gotta see it to believe it! Storage buildings! Extra RV hook-up! Deer and wild life in your own front yard!
-
2009-10-20$69,900 213-char remark
Show marketing remark (213 chars)
A little piece of paradise with a year around swimming hole on the back of the property (Panther Creek). Gotta see it to believe it! Storage buildings! Extra RV hook-up! Deer and wild life in your own front yard!
ⓘ Source: listings_history table (triggers on properties + properties_extension) + one-shot
backfill from property_details.listing_events for pre-trigger history.
Tax reassessment forecast AR · Resets to sale price
- Current annual tax
- $172 · $14/mo
- Projected year-2 tax
- $352 · $29/mo
- Expected delta
- +$180/yr (+$15/mo · 104.1%)
ⓘ Screening estimate from a state-policy table — verify with the county assessor before closing.
Climate risk First Street
- Flood 6/10 Major FEMA zone A · 72% chance over 30 yrs
- Wildfire 5/10 Major
- Heat 5/10 Major 7 d/yr ≥111°F today · 19 d/yr by 30 yrs out
- Wind 3/10 Moderate 7% chance of damaging wind over 30 yrs
- Air quality 2/10 Low 0 unhealthy d/yr today · 1 by 30 yrs out
Nearby sold comps map
Loading sold comps map…
Walkable amenities ~0.75 mi
Loading nearby amenities…
Taxation est. · year 1
- Rental income
- $11,350
- − Mortgage interest
- −$3,081
- − Property taxes
- −$172
- − Insurance
- −$1,778
- − Repairs & maintenance
- −$908
- − Management
- −$908
- − Depreciation
- −$1,600
- Taxable income
- $2,903
- Est. tax owed @ 24.0%
- −$697
- After-tax cash flow
- $2,859/yr
For passive investors: Depreciation is non-cash, so a rental often shows a tax loss while cash-flowing — sheltering income. Rental losses are passive: they offset passive income freely, and up to $25,000/yr can offset ordinary (W-2) income if you actively participate and your MAGI is under $100k (phasing out to $0 by $150k); unused losses carry forward. On sale, claimed depreciation is recaptured at up to 25%, and gains may owe capital-gains tax (a 1031 exchange can defer both). Figures are a year-1 estimate at your 24.0% rate — not tax advice; consult a CPA.
Schools (NCES district)
- District
- Searcy School District
- NCES district ID
- 0512210
- Math proficiency
- 47% ▼ -11.00%
- Reading proficiency
- 43% ▼ -10.00%
- Median HH income
- $44,318
- Composite
- 38.12/100
- National rank
- #4272
- State rank
- #37 of 238 in AR
Livability — Letona
- Score
- 54/100
- State rank
- #416
- US rank
- #23767
Category grades
Schools grade is shown separately in the Schools card above.
Census & demographics
- County
- White County · 35,000 people
- City population
- 199
- Metro
- Searcy, AR
- Population (ZIP)
- 35,000
- Household income
- $58,344
- Rent vs Own
- Severe rent burden
- 804.0
Population outlook (White County) Hauer SSP2
- Today (2025)
- 82,310 people
- By 2030
- 83,861 · +1.9%
- By 2040
- 86,492 · +5.1%
- By 2050
- 88,246 · +7.2%
- By 2075
- 91,307 · +10.9%
- By 2100
- 91,548 · +11.2%
Race, ethnicity, and origin ACS 2023
- Neighborhood character
- Predominantly White (82%)
- Race & ethnicity
- White 82% Black 7% Hispanic / Latino 6% Two or more races 5%
- Hispanic origin (detail)
- Mexican 4%
- Common ancestry
- Italian 2% Slovak 1% Serbian 1%
- Foreign-born
- 2% · Canada
- Languages at home
- 95% English-only · Spanish 4%
Political lean MEDSL · White
- 2024 margin
- Solid R (+61.2) · D 18.3% · R 79.5% · Other 2.2%
- 2008→2024 swing
- -14.0pp toward R · 2008: -47.2pp · 2024: -61.2pp
- All cycles
- 2024: R+61.2 2020: R+58.9 2016: R+57.9 2012: R+53.7 2008: R+47.2
Not yet ingested
- Civics
- —
Market trends
- HPI YoY
- ▼ -81.60%
- Current HPI
- 206.0334
- Rent YoY
- —
- Metro
- Searcy, AR
- State GDP YoY
- ▲ 3.80%
- F500 in state
- 10
Industry mix (Fortune 500 HQ in AR)
| Industry | F500 HQs | Revenue |
|---|---|---|
| Retail | 1 | $681B |
|
||
| Food / Agriculture | 1 | $53B |
|
||
| Retail / Energy | 1 | $22B |
|
||
| Transportation / Logistics | 1 | $12B |
|
||
| Energy | 1 | $4B |
|
||
Price history
-21.3% since first listed9 events — show timeline
- 2026-06-02 Relisted — CARMLS
- 2026-05-11 Contingent — CARMLS
- 2026-04-19 Listed $55,000 CARMLS
- 2025-09-30 Sold (Public Records) $22,500 Public Records
- 2015-01-29 Sold (Public Records) $15,000 Public Records
- 2010-07-13 Sold (Public Records) $65,000 Public Records
- 2010-07-09 Sold (MLS) $65,000 CARMLS
- 2010-06-29 Listing Removed — CARMLS
- 2009-10-20 Listed $69,900 CARMLS
Property tax history
+7.9%/yrLatest (2025): $172 · +20.7% YoY. Source: county tax records.
Cash-flow waterfall
monthlySold comps — $/sqft
last 12 mo · ≤1 miLoading sold comps…