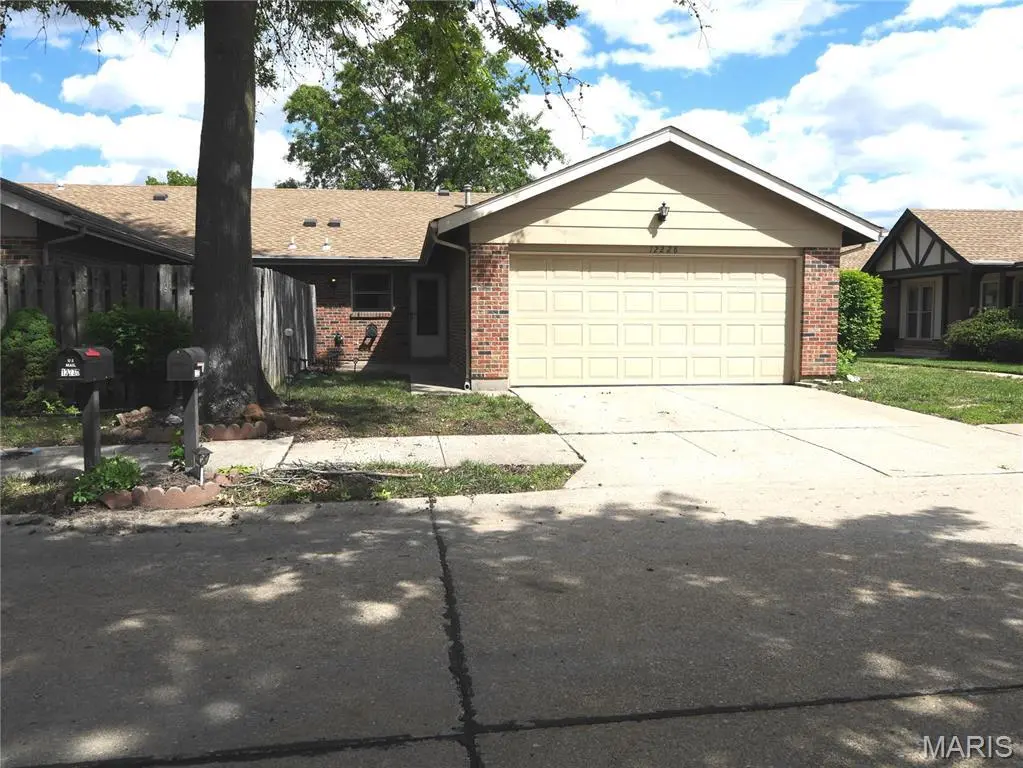
12228 Tarpon Dr · Black Jack, MO
Flood risk 1/10 · Minimal
- FEMA flood zone
- X (unshaded)
- Chance of flooding over 30 yrs
- 0.0%
- Est. flood insurance / yr
- $473 – $860
Fire risk 1/10 · Minimal
- Est. fire insurance / yr
- $1,054 – $1,958
Heat risk 5/10 · Moderate
- Hot days now (above 106°F)
- 7 days/yr
- Hot days in 30 yrs
- 21 days/yr
Wind risk 2/10 · Minimal
- Chance of severe wind over 30 yrs
- 1.0%
Air-quality risk 4/10 · Minor
- Unhealthy air days now
- 4 days/yr
- Unhealthy air days in 30 yrs
- 5 days/yr
Risk factors via First Street. Map © Google.
Why this score? — see what drove the C+ grade
The composite is a weighted blend of 9 inputs, each scored 0–100. Each bar is that input's sub-score; the figure is the points it added to the 100-point composite (weight × sub-score).
- Cash flow +15.9/30.0
- 1% rule +10.0/10.0
- Appreciation +10.0/10.0
- ARV discount +7.5/15.0
- DSCR +4.9/10.0
- Rent growth +4.4/5.0
- Livability +3.5/5.0
- Condition / age +2.5/5.0
- Schools +1.7/10.0
$115,000
🖨 Deal sheet (PDF) 📄 Offer letter ✓ Due diligence
Key facts
- Private patio
- View of lake
- Box window
Tags
Property features AI
Finance
- Other: Living area reported as 1,132 (public records)
- HOA & community: Part of the Village at Paddock Lake association; Monthly HOA fee; Association amenities include a clubhouse and common ground; HOA covers clubhouse, grounds maintenance, parking/road maintenance, common area maintenance, exterior maintenance, sewer, snow removal, trash, and water
Exterior
- Parking: 2 total parking spaces; 2-car garage
- Utilities: Public water; Public sewer; Electricity connected (Ameren); Cable available; Water connected; Sewer connected
- Home design: Residential condominium; One level
- Construction: Brick veneer exterior
- Exterior features: Adjoins common ground
Interior
- Kitchen: Dishwasher; Microwave; Free-standing electric range; Refrigerator
- Bedrooms: 2 bedrooms (both on the main level)
- Bathrooms: 2 full bathrooms (main level)
- Interior features: Ceiling fans; Central air; Forced air heating; Natural gas heating
- Laundry & utility: Washer; Dryer
Neighborhood map
What this means for you Summary
Snapshot
- This is a 2-bed/2.0-bath condo listed at $115k.
Deal economics
- At list price, monthly cash flow is $55 ($655/yr) — positive.
- The deal already cash-flows at list — no discount required.
- Meets the 1% rule at list price ($2k rent vs $115k).
Location & tenants
- Location reads 70/100 on livability (#132 in MO) — a middle-class / working-renter tenant base. Strengths: cost of living A+, housing A+; Watch: health & safety C-, crime D+, amenities F.
- Hazelwood (suburban): math 11% / reading 26% proficiency, ranked #306 of 324 in MO (top 94%) — low school quality limits family demand, transient renter base, plan for 1-2y turnover.
- Zoned schools: Townsend Elem. (math 8% / reading 17%, grade F, #1,007 of 1,115 statewide, top 91%, 371 students, 78% FRL); Central Middle (math 12% / reading 25%, grade F, #348 of 391 statewide, top 89%, 707 students, 68% FRL); Hazelwood Central High (math 12% / reading 33%, grade F, #455 of 521 statewide, top 88%, 1,628 students, 52% FRL).
- Market conditions: Rents rising fast (+7.5%/yr); 221 active listings in the ZIP; 5 comparable units currently listed for rent nearby; rentals at typical pace (median 24d on market — plan ~3-4 weeks tenant-placement turnaround); 40% of comp listings sitting > 30 days — soft ceiling on asking rent; 920 units permitted in St. Louis County in 2024 (250 in 5+ unit buildings).
- This rent runs 31% of the median local income ($67k/yr) — at the standard rent-burdened threshold; future hikes will face affordability resistance.
Forward outlook
- In year one you build about $12k of equity ($795 loan paydown + $12k appreciation (10.0% local appreciation)).
- At projected returns (10.0% appreciation + 7.5% rent growth), your $32k cash investment doubles in ~3 years — after that, you're playing with house money.
- By year 3, paydown + projected appreciation supports a ~$31k cash-out refi (75% LTV) — recoverable capital for the next deal without selling this one.
Negotiation context
- Only 3 days on market — expect competitive offers; lowballing is unlikely to land.
- Current owner paid $78k; 48% above their basis — modest negotiation headroom, anchor on the comps not their cost.
Risks & watch-outs
- Watch-outs: HOA is 31% of rent.
- Climate carrying-cost: extreme-heat days projected 7→21/yr by 2055 (HVAC capex compounding) — expect insurance premiums to compound above CPI over the hold.
Questions for the listing agent
- What does the HOA fee cover, when was the last increase, and are there any pending special assessments or reserve-fund shortfalls?
- Any open or pending special assessments — roof, HVAC, plumbing, elevator, façade? What's the per-unit balance and payoff schedule, and is the seller paying it off at close or rolling it to the buyer?
- Is there a deadline driving the sale (1031 exchange, divorce, estate, relocation)? That informs how much negotiation room exists.
- Crime grade is D in this area — have there been break-ins, vandalism, or insurance claims at this property in the last 3 years? What carrier currently insures it and at what premium?
- What's the average days-on-market for RENTAL listings here right now (not sales)? A rising rental-DOM trend means longer vacancies and softer asking-rent achievability than the comps imply.
- What's the recent tenant-quality profile in this submarket — average credit score on applications, eviction rate, late-payment / NSF rate, and stable-employment percentage? A property-management company in the area should have these aggregated.
- How much new apartment / multifamily construction is in the pipeline within 1–3 miles? Heavy new supply (>2% of stock underway) typically softens rents 12–24 months out; light construction supports rent growth.
Investment metrics
- 1% rule
- 1.51% ✓
- Cap rate
- 6.86%
- Cash-on-cash
- 2.04%
- DSCR
- 1.09
- GRM
- 5.5
CMA / ARV
No comps found within radius.
Projected returns pro-forma
10.0% appreciation · 7.51% rent growth · sell at horizon
- IRR
- 28.5%
- Equity multiple
- 3.32×
- Total profit
- $74,693
- Equity at exit
- $103,601
- IRR
- 27.0%
- Equity multiple
- 8.39×
- Total profit
- $237,933
- Equity at exit
- $223,420
Cash invested: $32,200 (down + closing). Projections, not guarantees.
Landlord ↔ Tenant lean methodology
- Overall (STATE)
- 81 Strongly Landlord-Friendly
- State Missouri
- 81 Strongly Landlord-Friendly · R+10
- County
- — inherits STATE
- City
- — inherits STATE
ZIP-level market 63033
- Home prices YoY
- 2.5%
- Rents YoY
- 7.5%
- Active inventory
- 221
- Price-to-rent
- 5.5×
Monthly cashflow live
- Estimated rent
- $1,736 high interval (Pro) →
- Mortgage (P&I)
- −$603
- Tax from tax record
- −$131 /mo · $1,571/yr
- Insurance
- −$48
- HOA
- −$535
- Vacancy / Maint / Mgmt
- −$365
- Net cashflow
- $55
Break-even live
Sensitivity live
| Price | -10% $120 | -5% $87 | +0% $55 | +5% $22 | +10% $-10 |
|---|---|---|---|---|---|
| Rent | -10% $-83 | -5% $-14 | +0% $55 | +5% $123 | +10% $192 |
| Rate | -1.0pp $113 | -0.5pp $84 | base $55 | +0.5pp $25 | +1.0pp $-6 |
UW: 25.0% down · 7.5% · 30yr · 1.5% tax · 5.0% vac · 8.0% maint · 8.0% mgmt
Financing live
Cash to close
- Down payment
- $28,750
- Closing costs
- $3,450
- Reserves months
- —
- Total cash needed
- —
Loan-product check · same deal, 3 products live
Conventional
25% down · 7.5% · 30yr
- Down + closing
- —
- Monthly P&I
- —
- Monthly cashflow
- —
- DSCR
- —
- Eligible?
- —
Personal DTI + credit; lowest rate.
DSCR
20% down · 8.5% · 30yr
- Down + closing
- —
- Monthly P&I
- —
- Monthly cashflow
- —
- DSCR
- —
- Eligible?
- —
No personal income docs; deal must DSCR.
Hard money
10% down · 12.0% · 12mo
- Down + closing
- —
- Monthly P&I
- —
- Monthly cashflow
- —
- DSCR
- —
- Eligible?
- —
Short-term bridge; refi at stabilization.
Rent comps 5 comps
| Address | Beds | Baths | Sqft | Rent | $/sqft | DOM | Units | Dist |
|---|---|---|---|---|---|---|---|---|
| 12810 Verwood Dr Florissant, MO | 3.0 | 2.0 | 1408 | $2,026 | $1.44 | 45d | 1 | 0.51mi |
| 6431 Brown Fox Dr Florissant, MO | 3.0 | 2.0 | 1105 | $1,905 | $1.72 | 24d | 1 | 0.79mi |
| 12887 Fox Haven Dr Florissant, MO | 3.0 | 2.0 | 1135 | $1,750 | $1.54 | 45d | 1 | 0.83mi |
| 11592 Las Ladera Dr Florissant, MO | 3.0 | 2.0 | 986 | $1,616 | $1.64 | 9d | 1 | 1.35mi |
| 11969 Continental Dr St. Louis, MO | 2.0–3.0 | 1.5 | 1075 | $1,035 | $0.96 | 0d | 4 | 1.35mi |
HOA detail condo
- Monthly dues
- $535 · $6,420/yr
- Assessments
- None detected in remarks — confirm with the listing agent.
Listing history 8 events
-
2026-05-12status Pending
-
2026-05-08$115,000 Active
-
2026-05-08historical $115,000
-
2003-09-08soldstatus $77,900
-
1998-04-23soldstatus
-
1997-09-05soldstatus $63,000
-
1994-02-14soldstatus
-
1994-02-14soldstatus
ⓘ Source: listings_history table (triggers on properties + properties_extension) + one-shot
backfill from property_details.listing_events for pre-trigger history.
Tax reassessment forecast MO · Resets to sale price
- Current annual tax
- $1,571 · $131/mo
- Projected year-2 tax
- $1,571 · $131/mo
- Expected delta
- $0/yr ($0/mo · 0.0%)
ⓘ Screening estimate from a state-policy table — verify with the county assessor before closing.
Climate risk First Street
- Flood 1/10 Low FEMA zone X (unshaded) · 0% chance over 30 yrs
- Wildfire 1/10 Low
- Heat 5/10 Major 7 d/yr ≥106°F today · 21 d/yr by 30 yrs out
- Wind 2/10 Low 100% chance of damaging wind over 30 yrs
- Air quality 4/10 Moderate 4 unhealthy d/yr today · 5 by 30 yrs out
Nearby sold comps map
Loading sold comps map…
Walkable amenities ~0.75 mi
Loading nearby amenities…
Taxation est. · year 1
- Rental income
- $20,834
- − Mortgage interest
- −$6,442
- − Property taxes
- −$1,571
- − Insurance
- −$575
- − Repairs & maintenance
- −$1,667
- − Management
- −$1,667
- − HOA
- −$6,420
- − Depreciation
- −$3,345
- Taxable loss
- −$853
- Est. tax savings @ 24.0%
- +$205
- After-tax cash flow
- $860/yr
For passive investors: Depreciation is non-cash, so a rental often shows a tax loss while cash-flowing — sheltering income. Rental losses are passive: they offset passive income freely, and up to $25,000/yr can offset ordinary (W-2) income if you actively participate and your MAGI is under $100k (phasing out to $0 by $150k); unused losses carry forward. On sale, claimed depreciation is recaptured at up to 25%, and gains may owe capital-gains tax (a 1031 exchange can defer both). Figures are a year-1 estimate at your 24.0% rate — not tax advice; consult a CPA.
Schools (NCES district)
- District
- Hazelwood
- NCES district ID
- 2913830
- Math proficiency
- 11% ▼ -13.00%
- Reading proficiency
- 26% ▼ -6.00%
- Median HH income
- $51,621
- Composite
- 16.77/100
- National rank
- #9156
- State rank
- #306 of 324 in MO
Livability — Black Jack
- Score
- 70/100
- State rank
- #132
- US rank
- #7706
Category grades
Schools grade is shown separately in the Schools card above.
Census & demographics
- County
- Saint Louis County · 888,823 people
- City population
- 42,258
- Metro
- St. Louis, MO-IL
- Population (ZIP)
- 43,056
- Household income
- $66,776
- Rent vs Own
- Severe rent burden
- 1429.0
Population outlook (St. Louis County) Hauer SSP2
- Today (2025)
- 1,025,227 people
- By 2030
- 1,028,023 · +0.3%
- By 2040
- 1,020,940 · -0.4%
- By 2050
- 1,007,280 · -1.8%
- By 2075
- 987,277 · -3.7%
- By 2100
- 921,984 · -10.1%
Race, ethnicity, and origin ACS 2023
- Neighborhood character
- Predominantly Black (71%)
- Race & ethnicity
- Black 71% White 23% Two or more races 4% Hispanic / Latino 1%
- Common ancestry
- Romanian 1% Lithuanian 1% Italian 1%
- Foreign-born
- 3% · Canada, Vietnam
- Languages at home
- 95% English-only · Spanish 1% French/Haitian/Cajun 1%
Political lean MEDSL · St. Louis
- 2024 margin
- Strong D (+23.4) · D 60.8% · R 37.4% · Other 1.7%
- 2008→2024 swing
- +3.5pp toward D · 2008: 19.9pp · 2024: 23.4pp
- All cycles
- 2024: D+23.4 2020: D+24.0 2016: D+16.2 2012: D+13.7 2008: D+19.9
Not yet ingested
- Civics
- —
Market trends
- HPI YoY
- ▲ 13.78%
- Current HPI
- 570.6
- Rent YoY
- ▲ 7.51%
- Metro
- St. Louis, MO-IL
- State GDP YoY
- ▲ 1.84%
- F500 in state
- 20
Industry mix (Fortune 500 HQ in MO)
| Industry | F500 HQs | Revenue |
|---|---|---|
| Healthcare | 1 | $163B |
|
||
| Insurance | 1 | $21B |
|
||
| Industrial Technology | 1 | $17B |
|
||
| Retail | 1 | $16B |
|
||
| Industrial Distribution | 1 | $10B |
|
||
| Utilities | 1 | $9B |
|
||
Price history
+82.5% since first listed8 events — show timeline
- 2026-05-12 Pending — MARIS as Distributed by MLS Grid
- 2026-05-08 Listed $115,000 MARIS as Distributed by MLS Grid
- 2026-05-08 Coming Soon $115,000 MARIS as Distributed by MLS Grid
- 2003-09-08 Sold (Public Records) $77,900 Public Records
- 1998-04-23 Sold (Public Records) — Public Records
- 1997-09-05 Sold (Public Records) $63,000 Public Records
- 1994-02-14 Sold (Public Records) — Public Records
- 1994-02-14 Sold (Public Records) — Public Records
Property tax history
+4.2%/yrLatest (2022): $1,571 · +5.6% YoY. Source: county tax records.
Cash-flow waterfall
monthlySold comps — $/sqft
last 12 mo · ≤1 miLoading sold comps…