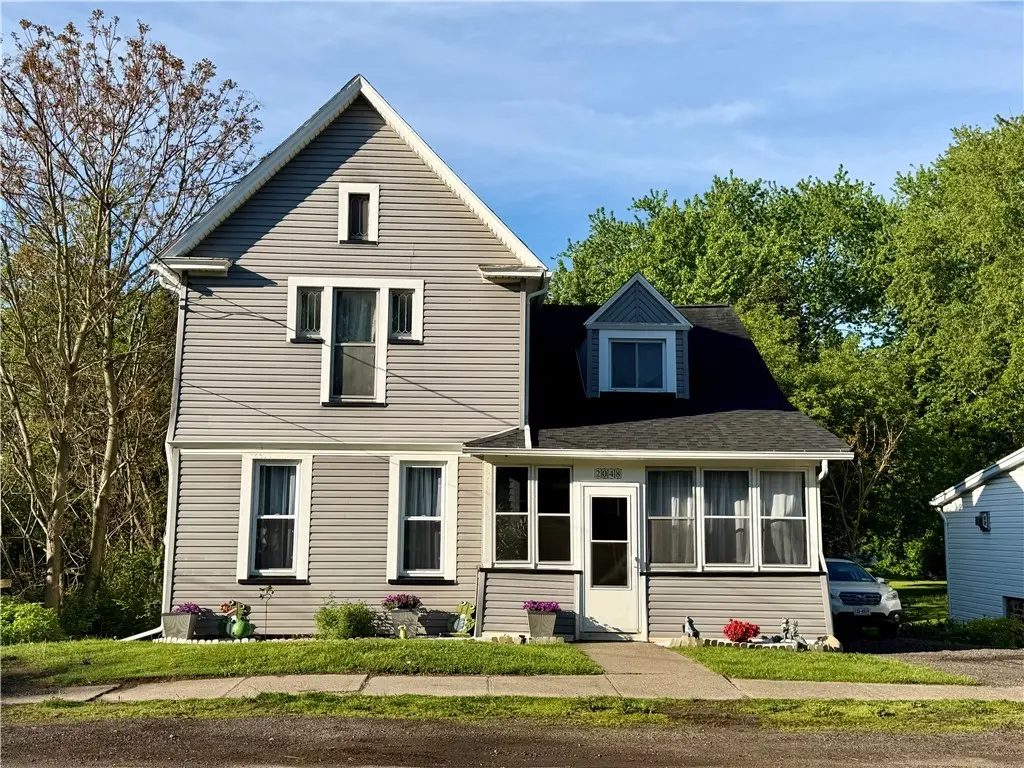
2048 Ridge Rd · Ontario, NY
Flood risk 1/10 · Minimal
- FEMA flood zone
- —
- Chance of flooding over 30 yrs
- 0.0%
- Est. flood insurance / yr
- —
Fire risk 3/10 · Minor
- Est. fire insurance / yr
- $691 – $1,283
Heat risk 2/10 · Minimal
- Hot days now (above 95°F)
- 7 days/yr
- Hot days in 30 yrs
- 16 days/yr
Wind risk 1/10 · Minimal
- Chance of severe wind over 30 yrs
- —
Air-quality risk 2/10 · Minimal
- Unhealthy air days now
- 1 days/yr
- Unhealthy air days in 30 yrs
- 2 days/yr
Risk factors via First Street. Map © Google.
Why this score? — see what drove the D+ grade
The composite is a weighted blend of 9 inputs, each scored 0–100. Each bar is that input's sub-score; the figure is the points it added to the 100-point composite (weight × sub-score).
- ARV discount +13.1/15.0
- Cash flow +12.7/30.0
- Schools +5.4/10.0
- 1% rule +4.3/10.0
- DSCR +3.8/10.0
- Livability +3.6/5.0
- Rent growth +2.5/5.0
- Condition / age +2.5/5.0
- Appreciation +0.0/10.0
$199,900
🖨 Deal sheet (PDF) 📄 Offer letter ✓ Due diligence
Listing remarks
Welcome to this stunning, fully remodeled 3-bedroom, 2 full-bath gem that perfectly blends farmhouse style with a peaceful setting. Step inside to find a bright, open interior where every detail has been thoughtfully updated. Features a convenient full bath on each level and first-floor laundry room. Enjoy total peace of mind with a brand-new-tear-off roof (completed May 2026), brand new hot water heater May 2026. The real showstopper is the backyard oasis. Relax on your private deck with no rear neighbors, enjoying unobstructed views. Property backs up to Ontario Country Club golf course. Move right in and start living. Delayed Showings, Delayed Offers. Showings to begin on Thursday May 2
Key facts
- Private deck
- Unobstructed views
- 0.4 acre lot
Tags
Property features AI
Exterior
- Parking: No garage
- Utilities: Cable available; High-speed internet available; Public water (connected); Sewer connected; Circuit breaker electrical
- Home design: 2-story home; Existing/resale property
- Construction: Vinyl siding; Copper plumbing; Stone foundation
- Exterior features: Awning(s); Deck; Enclosed porch; Porch; Gravel driveway; Rectangular lot; Main thoroughfare frontage; Lot dimensions approximately 55 x 294
Interior
- Kitchen: Electric oven; Electric range; Refrigerator; Wine cooler
- Flooring: Laminate; Varied flooring
- Bathrooms: 2 full bathrooms; 1 main-level bathroom
- Heating & cooling: Gas forced-air heating
- Interior features: Thermal windows; Sliding glass doors; Separate/formal dining room; Entrance foyer; Eat-in kitchen; Separate/formal living room
- Laundry & utility: Main-level laundry; Washer; Dryer; Gas water heater
Neighborhood map
What this means for you Summary
Snapshot
- This is a 3-bed/2.0-bath single-family listed at $200k.
Deal economics
- At list price, monthly cash flow is $-20 ($-243/yr) — negative.
- To cash-flow at today's rent, offer at most $196k (1.8% below list).
- To meet the 1% rule (rent ≥ 1% of price), the offer needs to be $186k (6.9% below list).
- Recommended offer: $186k (6.9% below list) — sets the bar for 1% rule.
- Cap rate 6.2% vs local median 3.3% in Ontario — top-decile yield for the area; either an underpriced asset or a hidden risk that comps aren't pricing in. Stress-test before assuming the spread holds.
Location & tenants
- Location reads 71/100 on livability (#385 in NY) — a middle-class / working-renter tenant base. Strengths: housing A+, crime A-, cost of living B+; Watch: commute D, amenities F, health & safety D-.
- Wayne Central School District (suburban): math 57% / reading 68% proficiency, ranked #194 of 590 in NY (top 33%) — acceptable for families but not a draw, mixed tenant base, ~2y average lease.
- Market conditions: 87 active listings in the ZIP; 4 comparable units currently listed for rent nearby; rentals lingering (median 45d on market — plan ~5-8 weeks vacancy on turnover, expect pricing pressure); 50% of comp listings sitting > 30 days — soft ceiling on asking rent; 259 units permitted in Wayne County in 2024 (90 in 5+ unit buildings).
Forward outlook
- Local home prices are declining (-3.0%/yr); year-one equity from $1k of loan paydown is wiped out by about $6k of value loss. Plan a longer hold.
- Wayne County population projected at -24% by 2050 — secular population decline; favor cash flow + early exit over multi-decade hold.
Negotiation context
- It's been on market 16 days — a 2% lower offer ($197k) is reasonable based on typical stale-listing flexibility.
Risks & watch-outs
- Watch-outs: built in 1905 — expect roof / HVAC / electrical / plumbing capex.
Questions for the listing agent
- What do current leases actually rent for vs. the listed asking? Can we see a recent rent roll and the last 12 months of T-12 income?
- Built in 1905 — when were the roof, HVAC, electrical panel, plumbing, and water heater last replaced?
- Is there a deadline driving the sale (1031 exchange, divorce, estate, relocation)? That informs how much negotiation room exists.
- The area grade is low — what's the realistic commute time and amenity access for the typical tenant pool here? Any planned neighborhood developments (good or bad) we should know about?
- What's the average days-on-market for RENTAL listings here right now (not sales)? A rising rental-DOM trend means longer vacancies and softer asking-rent achievability than the comps imply.
- What's the recent tenant-quality profile in this submarket — average credit score on applications, eviction rate, late-payment / NSF rate, and stable-employment percentage? A property-management company in the area should have these aggregated.
- How much new for-sale + rental construction is in the pipeline within 1–3 miles? Heavy new supply typically softens prices + rents 12–24 months out; constrained supply supports both.
Investment metrics
- 1% rule
- 0.93% ✗
- Cap rate
- 6.17%
- Cash-on-cash
- -0.43%
- DSCR
- 0.98
- GRM
- 8.9
CMA / ARV
- ARV (on-the-fly)
- $228,384
- Comps found
- 4
Show comp detail 4 sales within ~0.75 mi
| Address | Dist | Beds/Ba | Sqft | Sold | Price | $/sf | Match |
|---|---|---|---|---|---|---|---|
| 6028 Walworth Rd | 0.17mi | 3/1.5 | 1,682 (+6%) | 10mo | $327,000 | $194 | 71 |
| 6218 Knickerbocker Rd | 0.34mi | 4/2.0 (+1) | 1,690 (+7%) | 16mo | $224,900 | $133 | 55 |
| 2166 Ridge Rd | 0.28mi | 4/1.5 (+1) | 1,806 (+14%) | 14mo | $260,000 | $144 | 45 |
| 6312 Furnace Rd | 0.51mi | 3/1.0 | 1,456 (-8%) | 21mo | $136,000 | $93 | 41 |
Match score weights: distance 35% · size 25% · config 20% · recency 20%. Top-matched comps best support the ARV.
Projected returns pro-forma
-3.0% appreciation · 3.0% rent growth · sell at horizon
- IRR
- -17.0%
- Equity multiple
- 0.40×
- Total profit
- $-33,589
- Equity at exit
- $29,806
- IRR
- -8.7%
- Equity multiple
- 0.45×
- Total profit
- $-30,525
- Equity at exit
- $17,284
Cash invested: $55,972 (down + closing). Projections, not guarantees.
Landlord ↔ Tenant lean methodology
- Overall (STATE)
- 15 Strongly Tenant-Friendly
- State New York
- 15 Strongly Tenant-Friendly · D+10
- County
- — inherits STATE
- City
- — inherits STATE
ZIP-level market 14519
- Home prices YoY
- -26.1%
- Active inventory
- 87
- Price-to-rent
- 8.9×
Monthly cashflow live
- Estimated rent
- $1,862 medium interval (Pro) →
- Mortgage (P&I)
- −$1,048
- Tax from tax record
- −$360 /mo · $4,315/yr
- Insurance
- −$83
- HOA
- −$0
- Vacancy / Maint / Mgmt
- −$391
- Net cashflow
- $-20
Break-even live
Sensitivity live
| Price | -10% $93 | -5% $36 | +0% $-20 | +5% $-77 | +10% $-133 |
|---|---|---|---|---|---|
| Rent | -10% $-167 | -5% $-94 | +0% $-20 | +5% $53 | +10% $127 |
| Rate | -1.0pp $80 | -0.5pp $31 | base $-20 | +0.5pp $-72 | +1.0pp $-125 |
UW: 25.0% down · 7.5% · 30yr · 1.5% tax · 5.0% vac · 8.0% maint · 8.0% mgmt
Financing live
Cash to close
- Down payment
- $49,975
- Closing costs
- $5,997
- Reserves months
- —
- Total cash needed
- —
Loan-product check · same deal, 3 products live
Conventional
25% down · 7.5% · 30yr
- Down + closing
- —
- Monthly P&I
- —
- Monthly cashflow
- —
- DSCR
- —
- Eligible?
- —
Personal DTI + credit; lowest rate.
DSCR
20% down · 8.5% · 30yr
- Down + closing
- —
- Monthly P&I
- —
- Monthly cashflow
- —
- DSCR
- —
- Eligible?
- —
No personal income docs; deal must DSCR.
Hard money
10% down · 12.0% · 12mo
- Down + closing
- —
- Monthly P&I
- —
- Monthly cashflow
- —
- DSCR
- —
- Eligible?
- —
Short-term bridge; refi at stabilization.
Rent comps 4 comps
| Address | Beds | Baths | Sqft | Rent | $/sqft | DOM | Units | Dist |
|---|---|---|---|---|---|---|---|---|
| 6217 Blossom Ridge Cir Ontario, NY | 2.0 | 2.0 | 1251 | $1,995 | $1.59 | 24d | 1 | 0.72mi |
| 1649 Ridge Rd Unit 1649 B Ontario, NY | 2.0 | 1.0 | 1750 | $1,550 | $0.89 | 45d | 1 | 1.02mi |
| 1582 Ridge Rd Ontario, NY | 3.0 | 1.5 | 1600 | $1,800 | $1.12 | 15d | 1 | 1.16mi |
| 6190 Stokely Creek Trl Ontario, NY | 3.0 | 2.0 | 1491 | $2,150 | $1.44 | 45d | 1 | 1.46mi |
Listing history 10 events
-
2026-06-13statusdays on market $199,900 Pending 16 DOM
-
2026-06-10days on market $199,900 Active 14 DOM
-
2026-06-09days on market $199,900 Active 13 DOM
-
2026-06-09days on market $199,900 Active 12 DOM
-
2026-06-07days on market $199,900 Active 11 DOM
-
2026-06-03days on market $199,900 Active 7 DOM
-
2026-06-03days on market $199,900 Active 6 DOM
-
2026-06-01days on market $199,900 Active 5 DOM
-
2026-05-31days on market $199,900 Active 4 DOM
-
2026-05-27$199,900 Active
ⓘ Source: listings_history table (triggers on properties + properties_extension) + one-shot
backfill from property_details.listing_events for pre-trigger history.
Tax reassessment forecast NY · Partial reset (capped growth)
- Current annual tax
- $4,315 · $360/mo
- Projected year-2 tax
- $4,315 · $360/mo
- Expected delta
- $0/yr ($0/mo · 0.0%)
ⓘ Screening estimate from a state-policy table — verify with the county assessor before closing.
Climate risk First Street
- Flood 1/10 Low 0% chance over 30 yrs
- Wildfire 3/10 Moderate
- Heat 2/10 Low 7 d/yr ≥95°F today · 16 d/yr by 30 yrs out
- Wind 1/10 Low
- Air quality 2/10 Low 1 unhealthy d/yr today · 2 by 30 yrs out
Nearby sold comps map
Loading sold comps map…
Walkable amenities ~0.75 mi
Loading nearby amenities…
Taxation est. · year 1
- Rental income
- $22,342
- − Mortgage interest
- −$11,198
- − Property taxes
- −$4,315
- − Insurance
- −$1,000
- − Repairs & maintenance
- −$1,787
- − Management
- −$1,787
- − Depreciation
- −$5,815
- Taxable loss
- −$3,560
- Est. tax savings @ 24.0%
- +$854
- After-tax cash flow
- $611/yr
For passive investors: Depreciation is non-cash, so a rental often shows a tax loss while cash-flowing — sheltering income. Rental losses are passive: they offset passive income freely, and up to $25,000/yr can offset ordinary (W-2) income if you actively participate and your MAGI is under $100k (phasing out to $0 by $150k); unused losses carry forward. On sale, claimed depreciation is recaptured at up to 25%, and gains may owe capital-gains tax (a 1031 exchange can defer both). Figures are a year-1 estimate at your 24.0% rate — not tax advice; consult a CPA.
Schools (NCES district)
- District
- Wayne Central School District
- NCES district ID
- 3630330
- Math proficiency
- 57% ▼ -8.00%
- Reading proficiency
- 68% ▲ 10.00%
- Median HH income
- $61,193
- Composite
- 54.18/100
- National rank
- #1378
- State rank
- #194 of 590 in NY
Livability — Ontario
- Score
- 71/100
- State rank
- #385
- US rank
- #6629
Category grades
Schools grade is shown separately in the Schools card above.
Census & demographics
- Census place
- Ontario, NY
- Population (ZIP)
- 12,487
Population outlook (Wayne County) Hauer SSP2
- Today (2025)
- 85,662 people
- By 2030
- 81,945 · -4.3%
- By 2040
- 73,735 · -13.9%
- By 2050
- 65,029 · -24.1%
- By 2075
- 47,451 · -44.6%
- By 2100
- 31,574 · -63.1%
Race, ethnicity, and origin ACS 2023
- Neighborhood character
- Predominantly White (91%)
- Race & ethnicity
- White 91% Two or more races 6% Hispanic / Latino 2% Black 1%
- Common ancestry
- Iranian 5% Romanian 4% Lithuanian 3%
- Foreign-born
- 2% · Canada
- Languages at home
- 96% English-only · Spanish 1% Other Indo-European 1% French/Haitian/Cajun 1%
Political lean MEDSL · Wayne
- 2024 margin
- Strong R (+23.1) · D 38.5% · R 61.5%
- 2008→2024 swing
- -13.2pp toward R · 2008: -9.9pp · 2024: -23.1pp
- All cycles
- 2024: R+23.1 2020: R+19.6 2016: R+26.1 2012: R+9.3 2008: R+9.9
Not yet ingested
- Civics
- —
Market trends
- HPI YoY
- ▼ -85.53%
- Current HPI
- 242.3518
- Rent YoY
- —
- Metro
- —
- State GDP YoY
- ▲ 2.60%
- F500 in state
- 92
Industry mix (Fortune 500 HQ in NY)
| Industry | F500 HQs | Revenue |
|---|---|---|
| Financial Services | 10 | $950B |
|
||
| Consumer Goods | 9 | $162B |
|
||
| Insurance | 4 | $225B |
|
||
| Telecommunications | 2 | $144B |
|
||
| Pharmaceuticals | 2 | $112B |
|
||
| Media / Entertainment | 2 | $69B |
|
||
Price history
1 event — show timeline
- 2026-05-27 Listed $199,900 UNYREIS
Property tax history
+2.7%/yrLatest (2025): $4,315 · +1.2% YoY. Source: county tax records.
Cash-flow waterfall
monthlySold comps — $/sqft
last 12 mo · ≤1 miLoading sold comps…