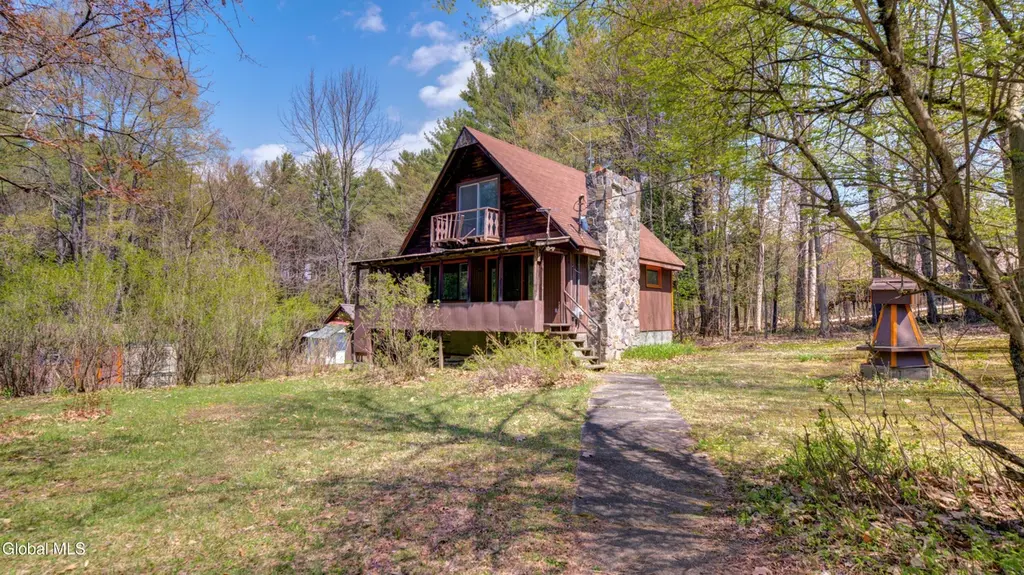
138 Gifford Valley Rd · Northville, NY
Flood risk 1/10 · Minimal
- FEMA flood zone
- X
- Chance of flooding over 30 yrs
- 0.0%
- Est. flood insurance / yr
- $473 – $860
Fire risk 2/10 · Minimal
- Est. fire insurance / yr
- $691 – $1,283
Heat risk 2/10 · Minimal
- Hot days now (above 93°F)
- 7 days/yr
- Hot days in 30 yrs
- 17 days/yr
Wind risk 2/10 · Minimal
- Chance of severe wind over 30 yrs
- 3.0%
Air-quality risk 1/10 · Minimal
- Unhealthy air days now
- 0 days/yr
- Unhealthy air days in 30 yrs
- 0 days/yr
Risk factors via First Street. Map © Google.
Why this score? — see what drove the C- grade
The composite is a weighted blend of 9 inputs, each scored 0–100. Each bar is that input's sub-score; the figure is the points it added to the 100-point composite (weight × sub-score).
- ARV discount +15.0/15.0
- Cash flow +10.9/30.0
- Appreciation +10.0/10.0
- Schools +4.3/10.0
- DSCR +3.2/10.0
- Livability +3.2/5.0
- 1% rule +3.0/10.0
- Rent growth +2.5/5.0
- Condition / age +2.5/5.0
$245,000
🖨 Deal sheet 📄 Offer letter ✓ Due diligence
Listing remarks
Open House Saturday 11-1pm. Nestled on a serene and private 4.2-acre wooded lot just moments from Sacandaga Lake, this charming Cape Cod offers a rare opportunity to enjoy the beauty and tranquility of the Adirondacks at an accessible price point. The property includes a valuable 10-foot deeded lake access along Route 30 at the end of Gifford Valley Road, perfect for enjoying the water without the high cost of direct waterfront. The main home features 2+ bedrooms, a functional kitchen, and a cozy living room anchored by a wood-burning fireplace--ideal for chilly mountain evenings--while a unique spiral staircase leads to a second-floor bedroom complemented by a versatile bonus room that can
Key facts
- Separate structure
- Usable outdoor space
- Large shed
Tags
Property features AI
Exterior
- Parking: Space for 6 vehicles total; Off-street parking and driveway
- Security: Security lights; Smoke detectors; Carbon monoxide detectors
- Utilities: Septic tank; Cable available
- Home design: Single-family residence; Living area approximately 1,095
- Construction: Wood siding construction
- Exterior features: Side porch; Shed(s) and additional storage; Secluded, private, wooded lot; Deeded water access (permit required)
Interior
- Kitchen: Microwave; Oven; Refrigerator
- Bedrooms: Main-level bedroom; Second-level bedroom; Second-level office (can function as bedroom/bonus room)
- Flooring: Wood flooring; Carpeted areas
- Bathrooms: One full bathroom on the first floor; One half bathroom in the basement
- Heating & cooling: Electric heating
- Interior features: 9 total rooms; Wood and carpet flooring; Living room with a wood-burning fireplace; Basement is full and partially finished
- Laundry & utility: Laundry in basement; Basement utility room
Neighborhood map
What this means for you Summary
Snapshot
- This is a 3-bed/1.5-bath single-family listed at $245k.
Deal economics
- At list price, monthly cash flow is $-108 ($-1k/yr) — negative.
- To cash-flow at today's rent, offer at most $226k (7.8% below list).
- To meet the 1% rule (rent ≥ 1% of price), the offer needs to be $195k (20.2% below list).
- Recommended offer: $195k (20.2% below list) — sets the bar for 1% rule.
- Cap rate 5.8% vs local median 2.9% in Northville — top-decile yield for the area; either an underpriced asset or a hidden risk that comps aren't pricing in. Stress-test before assuming the spread holds.
Location & tenants
- Location reads 64/100 on livability (#759 in NY) — a middle-class / working-renter tenant base. Strengths: crime A+, employment A+, housing A; Watch: amenities F, commute F, cost of living F.
- Northville Central School District (rural): math 51% / reading 45% proficiency, ranked #500 of 755 in NY (top 66%) — families likely to look elsewhere, expect single-tenant / working-renter base with shorter leases.
- Zoned schools: Northville Elementary School (math 52% / reading 62%, grade C+, #842 of 2,108 statewide, top 43%, 175 students, 55% FRL); Northville High School (math 37% / reading 42%, grade F, #1,060 of 1,100 statewide, top 97%, 256 students, 44% FRL).
- Market conditions: 51 active listings in the ZIP; 112 units permitted in Fulton County in 2024 (50 in 5+ unit buildings).
Forward outlook
- In year one you build about $26k of equity ($2k loan paydown + $24k appreciation (10.0% local appreciation)).
- Fulton County population projected at -23% by 2050 — secular population decline; favor cash flow + early exit over multi-decade hold.
- By year 2, paydown + projected appreciation supports a ~$42k cash-out refi (75% LTV) — recoverable capital for the next deal without selling this one.
Negotiation context
- Only 13 days on market — expect competitive offers; lowballing is unlikely to land.
Questions for the listing agent
- What do current leases actually rent for vs. the listed asking? Can we see a recent rent roll and the last 12 months of T-12 income?
- Built in 1970 — when were the roof, HVAC, electrical panel, plumbing, and water heater last replaced?
- Is there a deadline driving the sale (1031 exchange, divorce, estate, relocation)? That informs how much negotiation room exists.
- Schools are B-rated — typically a magnet for longer-tenancy family renters. What's the average tenant stay here, and is there a school-zone premium baked into asking?
- What's the average days-on-market for RENTAL listings here right now (not sales)? A rising rental-DOM trend means longer vacancies and softer asking-rent achievability than the comps imply.
- What's the recent tenant-quality profile in this submarket — average credit score on applications, eviction rate, late-payment / NSF rate, and stable-employment percentage? A property-management company in the area should have these aggregated.
- How much new for-sale + rental construction is in the pipeline within 1–3 miles? Heavy new supply typically softens prices + rents 12–24 months out; constrained supply supports both.
Investment metrics
- 1% rule
- 0.80% ✗
- Cap rate
- 5.76%
- Cash-on-cash
- -1.89%
- DSCR
- 0.92
- GRM
- 10.4
CMA / ARV
- ARV (median comp)
- $403,416
- List price
- $245,000
- Delta
- -39.27%
- Verdict
- UNDERPRICED
- Comps
- 8 within 1.0 mi
Projected returns pro-forma
10.0% appreciation · 3.0% rent growth · sell at horizon
- IRR
- 22.9%
- Equity multiple
- 2.85×
- Total profit
- $126,571
- Equity at exit
- $220,715
- IRR
- 20.5%
- Equity multiple
- 6.51×
- Total profit
- $378,138
- Equity at exit
- $475,981
Cash invested: $68,600 (down + closing). Projections, not guarantees.
Landlord ↔ Tenant lean methodology
- Overall (STATE)
- 15 Strongly Tenant-Friendly
- State New York
- 15 Strongly Tenant-Friendly · D+10
- County
- — inherits STATE
- City
- — inherits STATE
ZIP-level market 12134
- Home prices YoY
- 7.8%
- Active inventory
- 51
- Price-to-rent
- 10.4×
Monthly cashflow live
- Estimated rent
- $1,954 medium interval (Pro) →
- Mortgage (P&I)
- −$1,285
- Tax from tax record
- −$265 /mo · $3,177/yr
- Insurance
- −$102
- HOA
- −$0
- Vacancy / Maint / Mgmt
- −$410
- Net cashflow
- $-108
Break-even live
UW: 25.0% down · 7.5% · 30yr · 1.5% tax · 5.0% vac · 8.0% maint · 8.0% mgmt
Financing live
Cash to close
- Down payment
- $61,250
- Closing costs
- $7,350
- Reserves months
- —
- Total cash needed
- —
Loan-product check · same deal, 3 products live
Conventional
25% down · 7.5% · 30yr
- Down + closing
- —
- Monthly P&I
- —
- Monthly cashflow
- —
- DSCR
- —
- Eligible?
- —
Personal DTI + credit; lowest rate.
DSCR
20% down · 8.5% · 30yr
- Down + closing
- —
- Monthly P&I
- —
- Monthly cashflow
- —
- DSCR
- —
- Eligible?
- —
No personal income docs; deal must DSCR.
Hard money
10% down · 12.0% · 12mo
- Down + closing
- —
- Monthly P&I
- —
- Monthly cashflow
- —
- DSCR
- —
- Eligible?
- —
Short-term bridge; refi at stabilization.
Listing history 2 events
-
2026-05-18status Pending 1666-char remark
-
2026-05-05$245,000 Active 1666-char remark
ⓘ Source: listings_history table (triggers on properties + properties_extension) + one-shot
backfill from property_details.listing_events for pre-trigger history.
Tax reassessment forecast NY · Partial reset (capped growth)
- Current annual tax
- $3,177 · $265/mo
- Projected year-2 tax
- $3,659 · $305/mo
- Expected delta
- +$482/yr (+$40/mo · 15.2%)
ⓘ Screening estimate from a state-policy table — verify with the county assessor before closing.
Climate risk First Street
- Flood 1/10 Low FEMA zone X · 0% chance over 30 yrs
- Wildfire 2/10 Low
- Heat 2/10 Low 7 d/yr ≥93°F today · 17 d/yr by 30 yrs out
- Wind 2/10 Low 3% chance of damaging wind over 30 yrs
- Air quality 1/10 Low 0 unhealthy d/yr today · 0 by 30 yrs out
Nearby sold comps map
Loading sold comps map…
Walkable amenities ~0.75 mi
Loading nearby amenities…
Taxation est. · year 1
- Rental income
- $23,450
- − Mortgage interest
- −$13,724
- − Property taxes
- −$3,177
- − Insurance
- −$1,225
- − Repairs & maintenance
- −$1,876
- − Management
- −$1,876
- − Depreciation
- −$7,127
- Taxable loss
- −$5,555
- Est. tax savings @ 24.0%
- +$1,333
- After-tax cash flow
- $39/yr
For passive investors: Depreciation is non-cash, so a rental often shows a tax loss while cash-flowing — sheltering income. Rental losses are passive: they offset passive income freely, and up to $25,000/yr can offset ordinary (W-2) income if you actively participate and your MAGI is under $100k (phasing out to $0 by $150k); unused losses carry forward. On sale, claimed depreciation is recaptured at up to 25%, and gains may owe capital-gains tax (a 1031 exchange can defer both). Figures are a year-1 estimate at your 24.0% rate — not tax advice; consult a CPA.
Schools (NCES district)
- District
- Northville Central School District
- NCES district ID
- 3621300
- Math proficiency
- 51% ▼ -8.00%
- Reading proficiency
- 45% ▼ -2.00%
- Median HH income
- $48,564
- Composite
- 43.1/100
- National rank
- #6626
- State rank
- #500 of 755 in NY
Livability — Northville
- Score
- 64/100
- State rank
- #759
- US rank
- #14567
Category grades
Schools grade is shown separately in the Schools card above.
Census & demographics
- Population (ZIP)
- 4,093
Population outlook (Fulton County) Hauer SSP2
- Today (2025)
- 51,132 people
- By 2030
- 49,114 · -3.9%
- By 2040
- 44,373 · -13.2%
- By 2050
- 39,321 · -23.1%
- By 2075
- 28,503 · -44.3%
- By 2100
- 19,268 · -62.3%
Race, ethnicity, and origin ACS 2023
- Neighborhood character
- Predominantly White (92%)
- Race & ethnicity
- White 92% Two or more races 6% Hispanic / Latino 5%
- Common ancestry
- Romanian 7% Lithuanian 6% Iranian 6%
- Foreign-born
- 2% · Canada
- Languages at home
- 98% English-only · Spanish 1%
Political lean MEDSL · Fulton
- 2024 margin
- Solid R (+35.9) · D 32.1% · R 67.9%
- 2008→2024 swing
- -26.6pp toward R · 2008: -9.2pp · 2024: -35.9pp
- All cycles
- 2024: R+35.9 2020: R+31.4 2016: R+35.5 2012: R+10.5 2008: R+9.2
Not yet ingested
- Civics
- —
Market trends
- HPI YoY
- ▲ 25.95%
- Current HPI
- 358.0334
- Rent YoY
- —
- Metro
- —
- State GDP YoY
- ▲ 2.60%
- F500 in state
- 92
Industry mix (Fortune 500 HQ in NY)
| Industry | F500 HQs | Revenue |
|---|---|---|
| Financial Services | 10 | $950B |
|
||
| Consumer Goods | 9 | $162B |
|
||
| Insurance | 4 | $225B |
|
||
| Telecommunications | 2 | $144B |
|
||
| Pharmaceuticals | 2 | $112B |
|
||
| Media / Entertainment | 2 | $69B |
|
||
Price history
2 events — show timeline
- 2026-05-18 Pending — Global MLS
- 2026-05-05 Listed $245,000 Global MLS
Property tax history
+3.0%/yrLatest (2025): $3,177 · +4.1% YoY. Source: county tax records.
Cash-flow waterfall
monthlySold comps — $/sqft
last 12 mo · ≤1 miLoading sold comps…