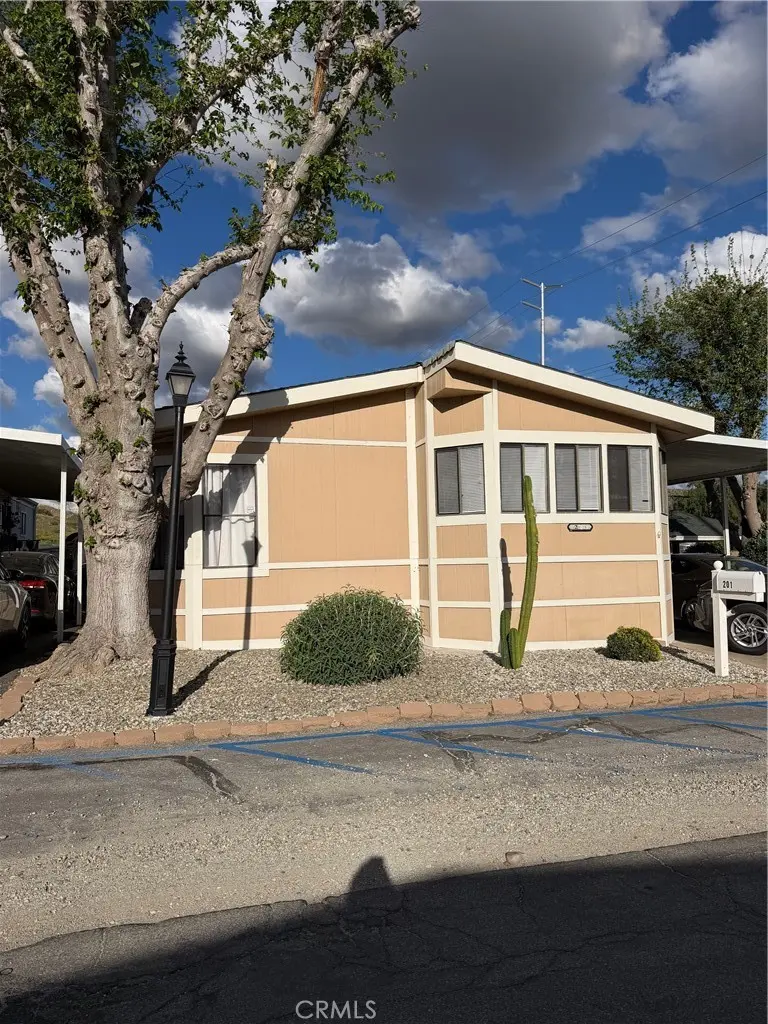
29021 Bouquet Cyn #201 · Santa Clarita, CA
Flood risk 1/10 · Minimal
- FEMA flood zone
- X (unshaded)
- Chance of flooding over 30 yrs
- 0.0%
- Est. flood insurance / yr
- $507 – $1,088
Fire risk 10/10 · Severe
- Est. fire insurance / yr
- $659 – $1,223
Heat risk 7/10 · Major
- Hot days now (above 99°F)
- 7 days/yr
- Hot days in 30 yrs
- 18 days/yr
Wind risk 1/10 · Minimal
- Chance of severe wind over 30 yrs
- —
Air-quality risk 7/10 · Major
- Unhealthy air days now
- 14 days/yr
- Unhealthy air days in 30 yrs
- 17 days/yr
Risk factors via First Street. Map © Google.
Why this score? — see what drove the B+ grade
The composite is a weighted blend of 9 inputs, each scored 0–100. Each bar is that input's sub-score; the figure is the points it added to the 100-point composite (weight × sub-score).
- Cash flow +30.0/30.0
- ARV discount +10.7/15.0
- 1% rule +10.0/10.0
- DSCR +10.0/10.0
- Schools +5.9/10.0
- Livability +3.5/5.0
- Rent growth +2.5/5.0
- Condition / age +2.5/5.0
- Appreciation +0.0/10.0
$249,900
🖨 Deal sheet 📄 Offer letter ✓ Due diligence
Listing remarks
Welcome to a beautifully updated and well-maintained mobile home offering comfort, functionality, and modern touches throughout. This inviting residence features a bright, open layout with newer kitchen appliances, updated bathrooms, new flooring throughout the home, as well as newer HVAC and a one-year old roof. This home offers a spacious bonus room with a separate entrance which adds incredible flexibility—perfect for a guest space, home office, hobby room, or additional living area. This is a wonderful opportunity to own an affordable home in a friendly, well-kept neighborhood. Don’t miss it!
Key facts
- Separate entrance
- New flooring
- Spacious bonus room
Tags
Property features AI
Finance
- HOA & community: Land lease in place ($1,104.77)
Exterior
- Parking: Located in Lily of the Valley park
- Utilities: Public sewer; District/public water
- Home design: Single-story; Mobile home remains on site; Mobile dimensions approximately 60 by 27 feet
- Construction: Year built recorded from other source
- Exterior features: Community pool; Street lighting
Interior
- Bathrooms: 2 full bathrooms
- Interior features: Ground-level entry on Bouquet Canyon Road; Patio-home style
- Laundry & utility: Washer hookup; Electric dryer hookup
Neighborhood map
What this means for you Summary
Snapshot
- This is a 4-bed/2.0-bath manufactured listed at $250k.
Deal economics
- At list price, monthly cash flow is $2k ($18k/yr) — positive.
- The deal already cash-flows at list — no discount required.
- Meets the 1% rule at list price ($4k rent vs $250k).
- Recommended offer: $235k (6.0% below list) — sets the bar for market timing.
- Cap rate 13.7% vs local median 2.8% in Santa Clarita — top-decile yield for the area; either an underpriced asset or a hidden risk that comps aren't pricing in. Stress-test before assuming the spread holds.
Location & tenants
- Location reads 70/100 on livability (#229 in CA) — a middle-class / working-renter tenant base. Strengths: employment A+, housing A, crime A-; Watch: amenities D+, cost of living F, health & safety F.
- William S. Hart Union High (suburban): math 52% / reading 72% proficiency, ranked #155 of 1,400 in CA (top 11%) — acceptable for families but not a draw, mixed tenant base, ~2y average lease; only 18% free/reduced lunch — higher-income household profile.
- Market conditions: 97 active listings in the ZIP; 8 comparable units currently listed for rent nearby; rentals leasing fast (median 4d on market — plan ~1-2 weeks tenant-placement turnaround); 19,697 units permitted in Los Angeles County in 2024 (9,426 in 5+ unit buildings).
Forward outlook
- Local home prices are declining (-3.0%/yr); year-one equity from $2k of loan paydown is wiped out by about $7k of value loss. Plan a longer hold.
- Los Angeles County population projected at +9% by 2050 — modest demand growth; plan on rents tracking national, not racing it.
- At projected returns (-3.0% appreciation + 3.0% rent growth), your $70k cash investment doubles in ~5 years — after that, you're playing with house money.
Negotiation context
- It's been on market 66 days — a 6% lower offer ($235k) is reasonable based on typical stale-listing flexibility.
- 2 sale attempts since 8y ago with the ask held roughly flat each time — persistent listings suggest the price (not the market) is what's stuck; bring a comps-based counter.
Risks & watch-outs
- Climate carrying-cost: severe wildfire risk; extreme-heat days projected 7→18/yr by 2055 (HVAC capex compounding) — expect insurance premiums to compound above CPI over the hold.
Questions for the listing agent
- It's been on market 66 days. Have you received any prior offers? Is the seller open to a 6% concession, seller financing, or rate buy-down credit?
- Why hasn't it sold? Are there any deal-killer items the seller is aware of (foundation, flood, title, zoning, code violations)?
- Is there a deadline driving the sale (1031 exchange, divorce, estate, relocation)? That informs how much negotiation room exists.
- Schools are B-rated — typically a magnet for longer-tenancy family renters. What's the average tenant stay here, and is there a school-zone premium baked into asking?
- What's the average days-on-market for RENTAL listings here right now (not sales)? A rising rental-DOM trend means longer vacancies and softer asking-rent achievability than the comps imply.
- What's the recent tenant-quality profile in this submarket — average credit score on applications, eviction rate, late-payment / NSF rate, and stable-employment percentage? A property-management company in the area should have these aggregated.
- How much new for-sale + rental construction is in the pipeline within 1–3 miles? Heavy new supply typically softens prices + rents 12–24 months out; constrained supply supports both.
Investment metrics
- 1% rule
- 1.52% ✓
- Cap rate
- 13.68%
- Cash-on-cash
- 26.39%
- DSCR
- 2.17
- GRM
- 5.5
CMA / ARV
- ARV (on-the-fly)
- $268,800
- Comps found
- 4
Show comp detail 4 sales within ~0.75 mi
| Address | Dist | Beds/Ba | Sqft | Sold | Price | $/sf | Match |
|---|---|---|---|---|---|---|---|
| 29021 Bouquet Canyon Rd | 0.01mi | 4/2.0 | 1,620 (-4%) | 7mo | $310,000 | $191 | 87 |
| 29021 Bouquet Canyon Rd #213 | 0.00mi | 3/2.0 (-1) | 1,792 (+7%) | 2mo | $260,000 | $145 | 82 |
| 29021 Bouquet Canyon Rd #249 | 0.00mi | 3/2.0 (-1) | 1,620 (-4%) | 10mo | $260,000 | $160 | 81 |
| 29021 Bouquet Canyon Rd #274 | 0.00mi | 3/2.0 (-1) | 1,560 (-7%) | 10mo | $250,000 | $160 | 75 |
Match score weights: distance 35% · size 25% · config 20% · recency 20%. Top-matched comps best support the ARV.
Projected returns pro-forma
-3.0% appreciation · 3.0% rent growth · sell at horizon
- IRR
- 20.2%
- Equity multiple
- 1.82×
- Total profit
- $57,423
- Equity at exit
- $37,261
- IRR
- 28.4%
- Equity multiple
- 3.51×
- Total profit
- $175,809
- Equity at exit
- $21,607
Cash invested: $69,972 (down + closing). Projections, not guarantees.
Landlord ↔ Tenant lean methodology
- Overall (STATE)
- 18 Strongly Tenant-Friendly
- State California
- 18 Strongly Tenant-Friendly · D+13
- County
- — inherits STATE
- City
- — inherits STATE
ZIP-level market 91390
- Home prices YoY
- -33.8%
- Active inventory
- 97
- Price-to-rent
- 5.5×
Monthly cashflow live
- Estimated rent
- $3,809 high interval (Pro) →
- Mortgage (P&I)
- −$1,311
- Tax from tax record
- −$55 /mo · $665/yr
- Insurance
- −$104
- HOA
- −$0
- Vacancy / Maint / Mgmt
- −$800
- Net cashflow
- $1,539
Break-even live
UW: 25.0% down · 7.5% · 30yr · 1.5% tax · 5.0% vac · 8.0% maint · 8.0% mgmt
Financing live
Cash to close
- Down payment
- $62,475
- Closing costs
- $7,497
- Reserves months
- —
- Total cash needed
- —
Loan-product check · same deal, 3 products live
Conventional
25% down · 7.5% · 30yr
- Down + closing
- —
- Monthly P&I
- —
- Monthly cashflow
- —
- DSCR
- —
- Eligible?
- —
Personal DTI + credit; lowest rate.
DSCR
20% down · 8.5% · 30yr
- Down + closing
- —
- Monthly P&I
- —
- Monthly cashflow
- —
- DSCR
- —
- Eligible?
- —
No personal income docs; deal must DSCR.
Hard money
10% down · 12.0% · 12mo
- Down + closing
- —
- Monthly P&I
- —
- Monthly cashflow
- —
- DSCR
- —
- Eligible?
- —
Short-term bridge; refi at stabilization.
Rent comps 8 comps
| Address | Beds | Baths | Sqft | Rent | $/sqft | DOM | Units | Dist |
|---|---|---|---|---|---|---|---|---|
| 20535 Alaminos Dr Santa Clarita, CA | 3.0 | 2.0 | 1562 | $3,849 | $2.46 | 1d | 1 | 0.82mi |
| 28189 Oaklar Dr Unit MEA2 Santa Clarita, CA | 4.0 | 2.0 | 1668 | $4,095 | $2.46 | 1d | 1 | 1.31mi |
| 28189 Oaklar Dr Santa Clarita, CA | 4.0 | 2.0 | 1668 | $4,095 | $2.46 | 4d | 1 | 1.31mi |
| 20000 Plum Canyon Rd Santa Clarita, CA | 3.0 | 3.0 | 1370 | $3,700 | $2.70 | 1d | 1 | 1.33mi |
| 20000 Plum Canyon Rd Santa Clarita, CA | 1.0–3.0 | 1.0–3.0 | 1051 | $3,700 | $3.52 | 24d | 2 | 1.34mi |
| 28371 Mirabelle Ln Santa Clarita, CA | 3.0 | 2.5 | 1710 | $3,400 | $1.99 | 6d | 1 | 1.43mi |
| 19341 Opal Ln Santa Clarita, CA | 3.0 | 3.0 | 1850 | $3,850 | $2.08 | 18d | 1 | 1.45mi |
| 28366 Casselman Ln Santa Clarita, CA | 3.0 | 2.5 | 1710 | $3,650 | $2.13 | 1d | 1 | 1.47mi |
Listing history 17 events
-
2026-06-18days on market $249,900 Active 66 DOM
-
2026-06-17days on market $249,900 Active 65 DOM
-
2026-06-16days on market $249,900 Active 64 DOM
-
2026-06-15days on market $249,900 Active 63 DOM
-
2026-06-13days on market $249,900 Active 61 DOM
-
2026-06-13days on market $249,900 Active 60 DOM
-
2026-06-09days on market $249,900 Active 57 DOM
-
2026-06-08days on market $249,900 Active 56 DOM
-
2026-06-07days on market $249,900 Active 55 DOM
-
2026-06-04days on market $249,900 Active 52 DOM
-
2026-06-03days on market $249,900 Active 51 DOM
-
2026-06-02days on market $249,900 Active 50 DOM
-
2026-06-01days on market $249,900 Active 49 DOM
-
2026-05-31days on market $249,900 Active 48 DOM
-
2026-04-13$249,900 Active
-
2018-03-31historical
-
2018-01-15$89,900 Active
ⓘ Source: listings_history table (triggers on properties + properties_extension) + one-shot
backfill from property_details.listing_events for pre-trigger history.
Tax reassessment forecast CA · Resets to sale price
- Current annual tax
- $665 · $55/mo
- Projected year-2 tax
- $1,899 · $158/mo
- Expected delta
- +$1,234/yr (+$103/mo · 185.4%)
ⓘ Screening estimate from a state-policy table — verify with the county assessor before closing.
Climate risk First Street
- Flood 1/10 Low FEMA zone X (unshaded) · 0% chance over 30 yrs
- Wildfire 10/10 Extreme
- Heat 7/10 Severe 7 d/yr ≥99°F today · 18 d/yr by 30 yrs out
- Wind 1/10 Low
- Air quality 7/10 Severe 14 unhealthy d/yr today · 17 by 30 yrs out
Nearby sold comps map
Loading sold comps map…
Walkable amenities ~0.75 mi
Loading nearby amenities…
Taxation est. · year 1
- Rental income
- $45,707
- − Mortgage interest
- −$13,998
- − Property taxes
- −$665
- − Insurance
- −$1,250
- − Repairs & maintenance
- −$3,657
- − Management
- −$3,657
- − Depreciation
- −$7,270
- Taxable income
- $15,211
- Est. tax owed @ 24.0%
- −$3,651
- After-tax cash flow
- $14,817/yr
For passive investors: Depreciation is non-cash, so a rental often shows a tax loss while cash-flowing — sheltering income. Rental losses are passive: they offset passive income freely, and up to $25,000/yr can offset ordinary (W-2) income if you actively participate and your MAGI is under $100k (phasing out to $0 by $150k); unused losses carry forward. On sale, claimed depreciation is recaptured at up to 25%, and gains may owe capital-gains tax (a 1031 exchange can defer both). Figures are a year-1 estimate at your 24.0% rate — not tax advice; consult a CPA.
Schools (NCES district)
- District
- William S. Hart Union High
- NCES district ID
- 0642510
- Math proficiency
- 52% ▬ 0.00%
- Reading proficiency
- 72% ▲ 1.00%
- Median HH income
- $95,844
- Composite
- 58.6/100
- National rank
- #2030
- State rank
- #155 of 1400 in CA
Livability — Santa Clarita
- Score
- 70/100
- State rank
- #229
- US rank
- #7378
Category grades
Schools grade is shown separately in the Schools card above.
Census & demographics
- City population
- 219,066
- Population (ZIP)
- 18,722
Population outlook (Los Angeles County) Hauer SSP2
- Today (2025)
- 10,940,515 people
- By 2030
- 11,256,481 · +2.9%
- By 2040
- 11,729,929 · +7.2%
- By 2050
- 11,948,407 · +9.2%
- By 2075
- 11,818,114 · +8.0%
- By 2100
- 10,842,928 · -0.9%
Race, ethnicity, and origin ACS 2023
- Neighborhood character
- Diverse neighborhood (Simpson 0.56)
- Race & ethnicity
- White 61% Hispanic / Latino 26% Two or more races 12% Asian 6% Black 2%
- Hispanic origin (detail)
- Mexican 14% Cuban 1%
- Common ancestry
- Lithuanian 2% Scottish 2% Portuguese 2%
- Foreign-born
- 14% · Canada, China, Dominican Republic
- Languages at home
- 81% English-only · Spanish 14% Other Indo-European 2% Chinese 1%
Political lean MEDSL · Los Angeles
- 2024 margin
- Solid D (+32.9) · D 64.8% · R 31.9% · Other 3.3%
- 2008→2024 swing
- -7.4pp toward R · 2008: 40.4pp · 2024: 32.9pp
- All cycles
- 2024: D+32.9 2020: D+44.2 2016: D+48.0 2012: D+40.0 2008: D+40.4
Not yet ingested
- Civics
- —
Market trends
- HPI YoY
- ▼ -165.65%
- Current HPI
- 325.09
- Rent YoY
- —
- Metro
- —
- State GDP YoY
- ▲ 3.21%
- F500 in state
- 116
Industry mix (Fortune 500 HQ in CA)
| Industry | F500 HQs | Revenue |
|---|---|---|
| Technology | 27 | $1,492B |
|
||
| Financial Services | 3 | $174B |
|
||
| Retail | 3 | $44B |
|
||
| Insurance | 3 | $26B |
|
||
| Media / Entertainment | 2 | $115B |
|
||
| Pharmaceuticals / Biotech | 2 | $62B |
|
||
Price history
+178.0% since first listed3 events — show timeline
- 2026-04-13 Listed $249,900 CRMLS
- 2018-03-31 Listing Removed — CRMLS
- 2018-01-15 Listed $89,900 CRMLS
Property tax history
+5.3%/yrLatest (2025): $665 · +5.3% YoY. Source: county tax records.
Cash-flow waterfall
monthlySold comps — $/sqft
last 12 mo · ≤1 miLoading sold comps…