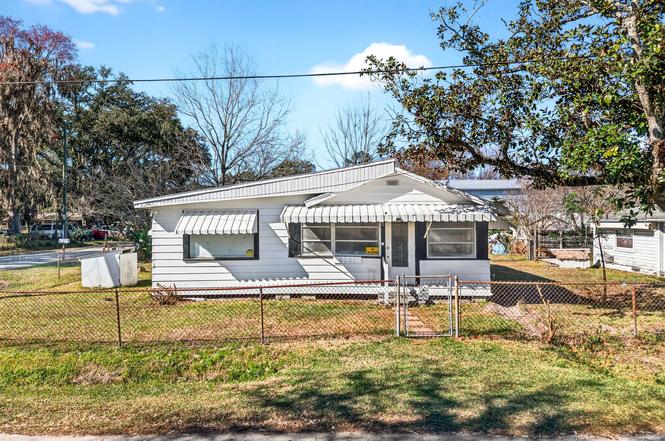
5021 Shannon Ave · Jacksonville, FL
Flood risk 6/10 · Moderate
- FEMA flood zone
- X (unshaded)
- Chance of flooding over 30 yrs
- 0.69%
- Est. flood insurance / yr
- $507 – $1,088
Fire risk 3/10 · Minor
- Est. fire insurance / yr
- $947 – $1,759
Heat risk 9/10 · Severe
- Hot days now (above 107°F)
- 7 days/yr
- Hot days in 30 yrs
- 20 days/yr
Wind risk 9/10 · Severe
- Chance of severe wind over 30 yrs
- 99.0%
Air-quality risk 4/10 · Minor
- Unhealthy air days now
- 6 days/yr
- Unhealthy air days in 30 yrs
- 6 days/yr
Risk factors via First Street. Map © Google.
Why this score? — see what drove the D grade
The composite is a weighted blend of 9 inputs, each scored 0–100. Each bar is that input's sub-score; the figure is the points it added to the 100-point composite (weight × sub-score).
- Cash flow +15.4/30.0
- Appreciation +6.7/10.0
- DSCR +4.7/10.0
- Livability +4.2/5.0
- Schools +3.9/10.0
- 1% rule +3.6/10.0
- Rent growth +2.9/5.0
- Condition / age +2.5/5.0
- ARV discount +0.0/15.0
$125,000
🖨 Deal sheet 📄 Offer letter ✓ Due diligence
Listing remarks
Tenant occupied until 12/31/26. This recently renovated 3-bedroom, 2-bath home features a fully fenced yard and a detached garage, offering both privacy and functionality. Updates throughout make it move-in ready once vacant, and the property includes a sunroom that is not included in the total square footage, providing additional flexible living space. A great opportunity for investors or future owner-occupants looking for a well-maintained home with added value.
Key facts
- Sunroom
- Recently renovated
- Fully fenced yard
Tags
Property features AI
Finance
- Other: Not a senior community
Exterior
- Parking: Detached garage; Additional off-street parking; 1-car garage
- Utilities: Electricity connected; Water connected; Sewer connected
- Home design: Single family residence; Property used for residential and commercial (single family)
- Construction: Shingle roof
- Exterior features: Chain link full fencing; Cleared lot; Asphalt road access
Interior
- Kitchen: Refrigerator
- Bedrooms: 3 bedrooms
- Flooring: Vinyl flooring
- Bathrooms: 2 full bathrooms
- Heating & cooling: Electric heating; Split system cooling
- Interior features: Refrigerator included
- Laundry & utility: Electric heating system
Neighborhood map
What this means for you Summary
Snapshot
- This is a 2-bed/1.0-bath single-family listed at $125k.
Deal economics
- At list price, monthly cash flow is $49 ($588/yr) — positive.
- The deal already cash-flows at list — no discount required.
- To meet the 1% rule (rent ≥ 1% of price), the offer needs to be $108k (13.8% below list).
- Recommended offer: $108k (13.8% below list) — sets the bar for 1% rule.
- Cap rate 6.8% vs local median 4.0% in Jacksonville — top-decile yield for the area; either an underpriced asset or a hidden risk that comps aren't pricing in. Stress-test before assuming the spread holds.
Location & tenants
- Location reads 83/100 on livability (#50 in FL, #911 nationally) — a professional / high-income tenant draw. Strengths: amenities A+, commute A+, housing A+.
- Duval (urban): math 46% / reading 45% proficiency, ranked #48 of 73 in FL (top 66%) — families likely to look elsewhere, expect single-tenant / working-renter base with shorter leases.
- Market conditions: Rents rising (+1.7%/yr); 172 active listings in the ZIP; 12 comparable units currently listed for rent nearby; rentals at typical pace (median 18d on market — plan ~3-4 weeks tenant-placement turnaround); lower-income renter base — watch delinquency; 6,503 units permitted in Duval County in 2024 (1,131 in 5+ unit buildings).
- This rent runs 37% of the median local income ($35k/yr) — at the standard rent-burdened threshold; future hikes will face affordability resistance.
Forward outlook
- In year one you build about $5k of equity ($864 loan paydown + $4k appreciation (3.4% local appreciation)).
- Duval County population projected at +19% by 2050 — long-run rental-demand tailwind backs the buy-and-hold thesis.
- At projected returns (3.4% appreciation + 1.7% rent growth), your $35k cash investment doubles in ~6 years — after that, you're playing with house money.
- By year 7, paydown + projected appreciation supports a ~$32k cash-out refi (75% LTV) — recoverable capital for the next deal without selling this one.
Negotiation context
- It's been on market 151 days — a 12% lower offer ($110k) is reasonable based on typical stale-listing flexibility.
- Current owner paid $54k; list at $125k implies a 131% gain — meaningful room to come down on a strong offer.
Risks & watch-outs
- Watch-outs: built in 1946 — expect roof / HVAC / electrical / plumbing capex.
- Climate carrying-cost: major flood risk; severe wind risk, 99% chance of damaging wind over 30y; extreme-heat days projected 7→20/yr by 2055 (HVAC capex compounding) — expect insurance premiums to compound above CPI over the hold.
Questions for the listing agent
- It's been on market 151 days. Have you received any prior offers? Is the seller open to a 14% concession, seller financing, or rate buy-down credit?
- Built in 1946 — when were the roof, HVAC, electrical panel, plumbing, and water heater last replaced?
- Why hasn't it sold? Are there any deal-killer items the seller is aware of (foundation, flood, title, zoning, code violations)?
- Is there a deadline driving the sale (1031 exchange, divorce, estate, relocation)? That informs how much negotiation room exists.
- Schools are B-rated — typically a magnet for longer-tenancy family renters. What's the average tenant stay here, and is there a school-zone premium baked into asking?
- The area grade is low — what's the realistic commute time and amenity access for the typical tenant pool here? Any planned neighborhood developments (good or bad) we should know about?
- What's the average days-on-market for RENTAL listings here right now (not sales)? A rising rental-DOM trend means longer vacancies and softer asking-rent achievability than the comps imply.
- What's the recent tenant-quality profile in this submarket — average credit score on applications, eviction rate, late-payment / NSF rate, and stable-employment percentage? A property-management company in the area should have these aggregated.
- How much new for-sale + rental construction is in the pipeline within 1–3 miles? Heavy new supply typically softens prices + rents 12–24 months out; constrained supply supports both.
Investment metrics
- 1% rule
- 0.86% ✗
- Cap rate
- 6.76%
- Cash-on-cash
- 1.68%
- DSCR
- 1.07
- GRM
- 9.7
CMA / ARV
- ARV (on-the-fly)
- $105,300
- Comps found
- 2
Show comp detail 2 sales within ~0.75 mi
| Address | Dist | Beds/Ba | Sqft | Sold | Price | $/sf | Match |
|---|---|---|---|---|---|---|---|
| 5409 Shenandoah Ave | 0.34mi | 3/1.0 (+1) | 824 (+2%) | 5mo | $100,000 | $121 | 72 |
| 2842 Lucoma Dr | 0.39mi | 3/1.0 (+1) | 924 (+14%) | 6mo | $120,000 | $130 | 48 |
Match score weights: distance 35% · size 25% · config 20% · recency 20%. Top-matched comps best support the ARV.
Projected returns pro-forma
3.41% appreciation · 1.7% rent growth · sell at horizon
- IRR
- 9.6%
- Equity multiple
- 1.56×
- Total profit
- $19,518
- Equity at exit
- $59,133
- IRR
- 11.2%
- Equity multiple
- 2.71×
- Total profit
- $59,925
- Equity at exit
- $93,476
Cash invested: $35,000 (down + closing). Projections, not guarantees.
Landlord ↔ Tenant lean methodology
- Overall (STATE)
- 87 Strongly Landlord-Friendly
- State Florida
- 87 Strongly Landlord-Friendly · R+3
- County
- — inherits STATE
- City
- — inherits STATE
ZIP-level market 32254
- Home prices YoY
- 1.2%
- Rents YoY
- 1.7%
- Active inventory
- 172
- Price-to-rent
- 9.7×
Monthly cashflow live
- Estimated rent
- $1,078 high interval (Pro) →
- Mortgage (P&I)
- −$656
- Tax from tax record
- −$95 /mo · $1,137/yr
- Insurance
- −$52
- HOA
- −$0
- Vacancy / Maint / Mgmt
- −$226
- Net cashflow
- $49
Break-even live
UW: 25.0% down · 7.5% · 30yr · 1.5% tax · 5.0% vac · 8.0% maint · 8.0% mgmt
Financing live
Cash to close
- Down payment
- $31,250
- Closing costs
- $3,750
- Reserves months
- —
- Total cash needed
- —
Loan-product check · same deal, 3 products live
Conventional
25% down · 7.5% · 30yr
- Down + closing
- —
- Monthly P&I
- —
- Monthly cashflow
- —
- DSCR
- —
- Eligible?
- —
Personal DTI + credit; lowest rate.
DSCR
20% down · 8.5% · 30yr
- Down + closing
- —
- Monthly P&I
- —
- Monthly cashflow
- —
- DSCR
- —
- Eligible?
- —
No personal income docs; deal must DSCR.
Hard money
10% down · 12.0% · 12mo
- Down + closing
- —
- Monthly P&I
- —
- Monthly cashflow
- —
- DSCR
- —
- Eligible?
- —
Short-term bridge; refi at stabilization.
Rent comps 12 comps
| Address | Beds | Baths | Sqft | Rent | $/sqft | DOM | Units | Dist |
|---|---|---|---|---|---|---|---|---|
| 5141 Shenandoah Ave Jacksonville, FL | 1.0–3.0 | 1.0–2.0 | 950 | $1,000 | $1.05 | 2d | 4 | 0.07mi |
| 5236 Wabash Blvd Jacksonville, FL | 2.0 | 1.0 | 712 | $999 | $1.40 | 20d | 1 | 0.16mi |
| 5355 New Kings Rd Unit 10 Jacksonville, FL | 2.0 | 1.0 | 528 | $775 | $1.47 | 24d | 1 | 0.90mi |
| 5355 New Kings Rd Unit 21 Jacksonville, FL | 2.0 | 1.0 | 700 | $800 | $1.14 | 4d | 1 | 0.94mi |
| 5355 New Kings Rd Unit 24 Jacksonville, FL | 1.0 | 1.0 | 600 | $700 | $1.17 | 8d | 1 | 0.94mi |
| 3138 W 15th St Jacksonville, FL | 2.0 | 1.0 | 734 | $1,150 | $1.57 | 8d | 1 | 0.96mi |
| 3138 W 15th St Jacksonville, FL | 2.0 | 1.0 | 734 | $1,150 | $1.57 | 24d | 1 | 0.96mi |
| 6718 Gaspar Cir W Jacksonville, FL | 3.0 | 2.0 | 1068 | $1,305 | $1.22 | 24d | 1 | 1.25mi |
| 6705 Gaspar Cir E Jacksonville, FL | 3.0 | 1.5 | 1116 | $1,254 | $1.12 | 17d | 1 | 1.25mi |
| 2939 W 11th St Jacksonville, FL | 3.0 | 1.0 | 1086 | $1,295 | $1.19 | 24d | 1 | 1.27mi |
| 2854 Wickwire St Jacksonville, FL | 2.0 | 1.0 | 948 | $1,300 | $1.37 | 4d | 1 | 1.33mi |
| 1612 Alfen St Jacksonville, FL | 3.0 | 1.5 | 945 | $1,113 | $1.18 | 8d | 1 | 1.42mi |
Listing history 13 events
-
2026-06-18days on market $125,000 Active 151 DOM
-
2026-06-17days on market $125,000 Active 150 DOM
-
2026-06-16days on market $125,000 Active 149 DOM
-
2026-06-15days on market $125,000 Active 148 DOM
-
2026-06-10pricedays on market $125,000 Active 142 DOM
-
2026-06-08days on market $130,000 Active 141 DOM
-
2026-06-08days on market $130,000 Active 140 DOM
-
2026-06-03days on market $130,000 Active 136 DOM
-
2026-06-02days on market $130,000 Active 135 DOM
-
2026-06-01days on market $130,000 Active 134 DOM
-
2026-05-31days on market $130,000 Active 133 DOM
-
2026-01-18$130,000 Active
-
2024-11-27soldstatus $54,000
ⓘ Source: listings_history table (triggers on properties + properties_extension) + one-shot
backfill from property_details.listing_events for pre-trigger history.
Tax reassessment forecast FL · Resets to sale price
- Current annual tax
- $1,137 · $95/mo
- Projected year-2 tax
- $1,137 · $95/mo
- Expected delta
- $0/yr ($0/mo · 0.0%)
ⓘ Screening estimate from a state-policy table — verify with the county assessor before closing.
Climate risk First Street
- Flood 6/10 Major FEMA zone X (unshaded) · 69% chance over 30 yrs
- Wildfire 3/10 Moderate
- Heat 9/10 Extreme 7 d/yr ≥107°F today · 20 d/yr by 30 yrs out
- Wind 9/10 Extreme 99% chance of damaging wind over 30 yrs
- Air quality 4/10 Moderate 6 unhealthy d/yr today · 6 by 30 yrs out
Nearby sold comps map
Loading sold comps map…
Walkable amenities ~0.75 mi
Loading nearby amenities…
Taxation est. · year 1
- Rental income
- $12,931
- − Mortgage interest
- −$7,002
- − Property taxes
- −$1,137
- − Insurance
- −$625
- − Repairs & maintenance
- −$1,034
- − Management
- −$1,034
- − Depreciation
- −$3,636
- Taxable loss
- −$1,538
- Est. tax savings @ 24.0%
- +$369
- After-tax cash flow
- $957/yr
For passive investors: Depreciation is non-cash, so a rental often shows a tax loss while cash-flowing — sheltering income. Rental losses are passive: they offset passive income freely, and up to $25,000/yr can offset ordinary (W-2) income if you actively participate and your MAGI is under $100k (phasing out to $0 by $150k); unused losses carry forward. On sale, claimed depreciation is recaptured at up to 25%, and gains may owe capital-gains tax (a 1031 exchange can defer both). Figures are a year-1 estimate at your 24.0% rate — not tax advice; consult a CPA.
Schools (NCES district)
- District
- Duval
- NCES district ID
- 1200480
- Math proficiency
- 46% ▼ -11.00%
- Reading proficiency
- 45% ▼ -4.00%
- Median HH income
- $48,987
- Composite
- 38.97/100
- National rank
- #4076
- State rank
- #48 of 73 in FL
Livability — Jacksonville
- Score
- 83/100
- State rank
- #50
- US rank
- #911
Category grades
Schools grade is shown separately in the Schools card above.
Census & demographics
- Census place
- Jacksonville, FL
- County
- Duval County · 1,015,274 people
- City population
- 979,034
- Metro
- Jacksonville, FL
- Population (ZIP)
- 13,927
- Household income
- $34,953
- Rent vs Own
- Severe rent burden
- 882.0
Population outlook (Duval County) Hauer SSP2
- Today (2025)
- 1,013,010 people
- By 2030
- 1,059,228 · +4.6%
- By 2040
- 1,141,439 · +12.7%
- By 2050
- 1,205,258 · +19.0%
- By 2075
- 1,324,282 · +30.7%
- By 2100
- 1,319,620 · +30.3%
Race, ethnicity, and origin ACS 2023
- Neighborhood character
- Diverse neighborhood (Simpson 0.56)
- Race & ethnicity
- Black 60% White 28% Two or more races 7% Hispanic / Latino 5%
- Hispanic origin (detail)
- Puerto Rican 1%
- Common ancestry
- Slovak 1% Hispanic 1% Lithuanian 1%
- Foreign-born
- 4% · Canada
- Languages at home
- 94% English-only · Spanish 4% French/Haitian/Cajun 2%
Political lean MEDSL · Duval
- 2024 margin
- Toss-up / Even · D 48.7% · R 50.1% · Other 1.2%
- 2008→2024 swing
- +0.4pp no change · 2008: -1.9pp · 2024: -1.5pp
- All cycles
- 2024: R+1.5 2020: D+3.8 2016: R+1.5 2012: R+3.6 2008: R+1.9
Not yet ingested
- Civics
- —
Market trends
- HPI YoY
- ▲ 3.41%
- Current HPI
- 282.2981
- Rent YoY
- ▲ 1.70%
- Metro
- Jacksonville, FL
- State GDP YoY
- ▲ 3.28%
- F500 in state
- 36
Industry mix (Fortune 500 HQ in FL)
| Industry | F500 HQs | Revenue |
|---|---|---|
| Industrial Technology | 2 | $29B |
|
||
| Insurance | 2 | $17B |
|
||
| Retail | 1 | $60B |
|
||
| Technology Distribution | 1 | $58B |
|
||
| Homebuilding | 1 | $35B |
|
||
| Technology Manufacturing | 1 | $35B |
|
||
Price history
+140.7% since first listed2 events — show timeline
- 2026-01-18 Listed $130,000 realMLS
- 2024-11-27 Sold (Public Records) $54,000 Public Records
Property tax history
+18.2%/yrLatest (2025): $1,137 · +16.6% YoY. Source: county tax records.
Cash-flow waterfall
monthlySold comps — $/sqft
last 12 mo · ≤1 miLoading sold comps…