 Triplex
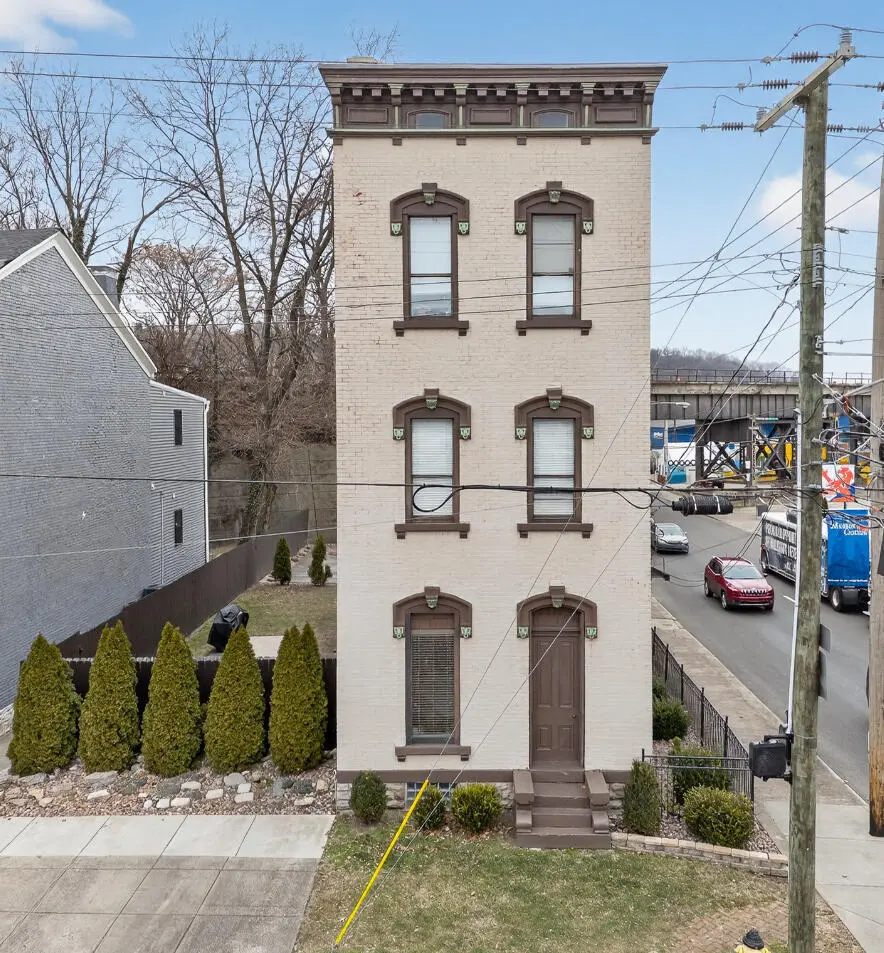
501 Johnson St · Covington, KY
Flood risk 1/10 · Minimal
- FEMA flood zone
- X (unshaded)
- Chance of flooding over 30 yrs
- 0.0%
- Est. flood insurance / yr
- $507 – $1,088
Fire risk 1/10 · Minimal
- Est. fire insurance / yr
- $839 – $1,559
Heat risk 5/10 · Moderate
- Hot days now (above 103°F)
- 7 days/yr
- Hot days in 30 yrs
- 20 days/yr
Wind risk 2/10 · Minimal
- Chance of severe wind over 30 yrs
- 1.0%
Air-quality risk 3/10 · Minor
- Unhealthy air days now
- 2 days/yr
- Unhealthy air days in 30 yrs
- 3 days/yr
Risk factors via First Street. Map © Google.
Why this score? — see what drove the C grade
The composite is a weighted blend of 9 inputs, each scored 0–100. Each bar is that input's sub-score; the figure is the points it added to the 100-point composite (weight × sub-score).
- Cash flow +25.4/30.0
- DSCR +8.4/10.0
- ARV discount +7.5/15.0
- 1% rule +5.9/10.0
- Livability +4.3/5.0
- Rent growth +2.9/5.0
- Condition / age +2.5/5.0
- Schools +1.5/10.0
- Appreciation +0.0/10.0
$649,900
🖨 Deal sheet (PDF) 📄 Offer letter ✓ Due diligence
Multi-family units
County records classify this as Multi-Family (2-4 Unit). Listing-text estimate: 3 units. confirmed
Listing remarks
Exceptional renovated triplex in the heart of Covington, KY--just steps from Cincinnati and Main Strasse Village. Zoned mixed use, this offering includes the adjacent vacant lot, creating a rare opportunity for expansion, additional parking, or future development (buyer to verify). Off street parking for six-eight cars! Located one block from the highly anticipated Covington Central Riverfront redevelopment, the property is positioned near future restaurants, retail, housing, and office space, offering strong long-term appreciation potential. Originally built in 1860, this historic property seamlessly blends timeless character with modern updates throughout. The building features three well
Key facts
- Renovated triplex
- Off street parking
- Historic property
Tags
Property features AI
Finance
- Financial info: Three total units (multi-family)
Exterior
- Parking: Six parking spaces; Off-street and on-street parking; no garage
- Utilities: Public water; Public sewer; Natural gas available
- Home design: Triplex; Three or more levels; Built in 1860; Stone foundation
- Construction: Brick construction
- Exterior features: Vinyl-clad windows; Membrane roof; 25 x 90 lot dimensions
Interior
- Kitchen: Electric oven; Electric cooktop; Dishwasher; Microwave; Refrigerator
- Bathrooms: Three full bathrooms; One half bathroom
- Heating & cooling: Forced air heating; Central air conditioning
- Interior features: Inoperable fireplace; Full basement; Stainless steel appliances
- Laundry & utility: Stacked washer and dryer
Neighborhood map
What this means for you Summary
Snapshot
- This is a 3 × 3-bed/3.5-bath units multifamily listed at $650k.
Deal economics
- At list price, monthly cash flow is $1k ($18k/yr) — positive. Per door: $497/mo.
- The deal already cash-flows at list — no discount required.
- Meets the 1% rule at list price ($7k rent vs $650k).
- Recommended offer: $630k (3.0% below list) — sets the bar for market timing.
- Cap rate 9.0% vs local median 5.3% in Covington — top-decile yield for the area; either an underpriced asset or a hidden risk that comps aren't pricing in. Stress-test before assuming the spread holds.
Location & tenants
- Location reads 86/100 on livability (#40 in KY, #376 nationally) — a professional / high-income tenant draw. Strengths: amenities A+, commute A+, cost of living A+; Watch: employment D+.
- Covington Independent (suburban): math 10% / reading 27% proficiency, ranked #162 of 165 in KY (top 98%) — low school quality limits family demand, transient renter base, plan for 1-2y turnover; 78% free/reduced lunch — lower-income household profile, screen leases tightly.
- Zoned schools: John G Carlisle Elementary (math 2% / reading 27%, grade F, #620 of 676 statewide, top 93%, 304 students, 81% FRL); Holmes Middle School (math 8% / reading 26%, grade F, #211 of 217 statewide, top 97%, 656 students, 84% FRL); Holmes High School (math 12% / reading 17%, grade F, #227 of 254 statewide, top 89%, 878 students, 80% FRL) — zoned schools at 82% FRL track the district average.
- Market conditions: Rents rising (+1.6%/yr); 217 active listings in the ZIP; 699 units permitted in Kenton County in 2024 (287 in 5+ unit buildings).
- At $7,098/mo this rent would consume 122% of the median local household income ($70k/yr) (locally 1488% of renters already pay >50% of income on rent) — very limited rent-growth headroom before tenants either downsize or default.
Forward outlook
- Local home prices are declining (-3.0%/yr); year-one equity from $4k of loan paydown is wiped out by about $19k of value loss. Plan a longer hold.
- Kenton County population projected at +5% by 2050 — modest demand growth; plan on rents tracking national, not racing it.
Negotiation context
- It's been on market 50 days — a 3% lower offer ($630k) is reasonable based on typical stale-listing flexibility.
- 7 sale attempts since 23y ago with the ask held roughly flat each time — persistent listings suggest the price (not the market) is what's stuck; bring a comps-based counter.
- Current owner paid $81k; list at $650k implies a 706% gain — meaningful room to come down on a strong offer.
Risks & watch-outs
- Watch-outs: built in 1860 — expect roof / HVAC / electrical / plumbing capex.
- Climate carrying-cost: extreme-heat days projected 7→20/yr by 2055 (HVAC capex compounding) — expect insurance premiums to compound above CPI over the hold.
Questions for the listing agent
- It's been on market 50 days. Have you received any prior offers? Is the seller open to a 3% concession, seller financing, or rate buy-down credit?
- Can we see the unit-by-unit rent roll, current vacancy, and any below-market leases? What's the average tenancy length?
- What capital expenditures (roof, boiler, parking lot, exteriors) have been made in the last 5 years, and what's planned in the next 2?
- Built in 1860 — when were the roof, HVAC, electrical panel, plumbing, and water heater last replaced?
- Is there a deadline driving the sale (1031 exchange, divorce, estate, relocation)? That informs how much negotiation room exists.
- What's the average days-on-market for RENTAL listings here right now (not sales)? A rising rental-DOM trend means longer vacancies and softer asking-rent achievability than the comps imply.
- What's the recent tenant-quality profile in this submarket — average credit score on applications, eviction rate, late-payment / NSF rate, and stable-employment percentage? A property-management company in the area should have these aggregated.
- How much new apartment / multifamily construction is in the pipeline within 1–3 miles? Heavy new supply (>2% of stock underway) typically softens rents 12–24 months out; light construction supports rent growth.
Investment metrics
- 1% rule
- 1.09% ✓
- Cap rate
- 9.04%
- Cash-on-cash
- 9.82%
- DSCR
- 1.44
- GRM
- 7.6
CMA / ARV
No comps found within radius.
Projected returns pro-forma
-3.0% appreciation · 1.55% rent growth · sell at horizon
- IRR
- -3.1%
- Equity multiple
- 0.89×
- Total profit
- $-20,756
- Equity at exit
- $96,902
- IRR
- 5.0%
- Equity multiple
- 1.35×
- Total profit
- $62,925
- Equity at exit
- $56,191
Cash invested: $181,972 (down + closing). Projections, not guarantees.
Landlord ↔ Tenant lean methodology
- Overall (STATE)
- 83 Strongly Landlord-Friendly
- State Kentucky
- 83 Strongly Landlord-Friendly · R+16
- County
- — inherits STATE
- City
- — inherits STATE
ZIP-level market 41011
- Rents YoY
- 1.6%
- Active inventory
- 217
- Price-to-rent
- 22.9×
Monthly cashflow live
- Estimated rent
- $7,098 high interval (Pro) →
- Mortgage (P&I)
- −$3,408
- Tax from tax record
- −$439 /mo · $5,264/yr
- Insurance
- −$271
- HOA
- −$0
- Vacancy / Maint / Mgmt
- −$1,491
- Net cashflow
- $1,490
Break-even live
Sensitivity live
| Price | -10% $1,858 | -5% $1,674 | +0% $1,490 | +5% $1,306 | +10% $1,122 |
|---|---|---|---|---|---|
| Rent | -10% $929 | -5% $1,209 | +0% $1,490 | +5% $1,770 | +10% $2,051 |
| Rate | -1.0pp $1,817 | -0.5pp $1,655 | base $1,490 | +0.5pp $1,321 | +1.0pp $1,150 |
3-unit breakdown (identical units grouped — click to expand)
| Units | Beds | Baths | Est. rent |
|---|---|---|---|
| 3× units | 3 | 3.5 | $7,098 |
| #1 | 3 | 3.5 | $2,366 |
| #2 | 3 | 3.5 | $2,366 |
| #3 | 3 | 3.5 | $2,366 |
| Total (3 units) | $7,098 | ||
UW: 25.0% down · 7.5% · 30yr · 1.5% tax · 5.0% vac · 8.0% maint · 8.0% mgmt
Financing live
Cash to close
- Down payment
- $162,475
- Closing costs
- $19,497
- Reserves months
- —
- Total cash needed
- —
Loan-product check · same deal, 3 products live
Conventional
25% down · 7.5% · 30yr
- Down + closing
- —
- Monthly P&I
- —
- Monthly cashflow
- —
- DSCR
- —
- Eligible?
- —
Personal DTI + credit; lowest rate.
DSCR
20% down · 8.5% · 30yr
- Down + closing
- —
- Monthly P&I
- —
- Monthly cashflow
- —
- DSCR
- —
- Eligible?
- —
No personal income docs; deal must DSCR.
Hard money
10% down · 12.0% · 12mo
- Down + closing
- —
- Monthly P&I
- —
- Monthly cashflow
- —
- DSCR
- —
- Eligible?
- —
Short-term bridge; refi at stabilization.
Listing history 31 events
-
2026-06-21days on market $649,900 Active 50 DOM
-
2026-06-18days on market $649,900 Active 47 DOM
-
2026-06-17days on market $649,900 Active 46 DOM
-
2026-06-16days on market $649,900 Active 45 DOM
-
2026-06-15days on market $649,900 Active 44 DOM
-
2026-06-09days on market $649,900 Active 38 DOM
-
2026-06-08days on market $649,900 Active 37 DOM
-
2026-06-07days on market $649,900 Active 36 DOM
-
2026-06-03days on market $649,900 Active 32 DOM
-
2026-06-02days on market $649,900 Active 31 DOM
-
2026-06-01days on market $649,900 Active 30 DOM
-
2026-05-31days on market $649,900 Active 29 DOM
-
2026-04-29$649,900 Active
-
2026-04-27historical
-
2026-02-27price $675,000
-
2026-01-27$690,000 Active
-
2016-10-04soldstatus $80,600
-
2016-08-29soldstatus $85,000
-
2016-08-05$125,000
-
2016-04-01soldstatus $66,262
-
2014-06-13soldstatus $55,100
-
2014-04-24$49,900
-
2014-01-11historical
-
2013-02-25$69,900
-
2012-05-11historical
-
2011-05-26$89,900
-
2003-10-02soldstatus $103,000
-
2003-09-23soldstatus $103,000
-
2003-03-17$107,900
-
1995-08-31soldstatus $37,000
-
1985-12-02soldstatus $29,000
ⓘ Source: listings_history table (triggers on properties + properties_extension) + one-shot
backfill from property_details.listing_events for pre-trigger history.
Tax reassessment forecast KY · Resets to sale price
- Current annual tax
- $5,264 · $439/mo
- Projected year-2 tax
- $5,589 · $466/mo
- Expected delta
- +$325/yr (+$27/mo · 6.2%)
ⓘ Screening estimate from a state-policy table — verify with the county assessor before closing.
Climate risk First Street
- Flood 1/10 Low FEMA zone X (unshaded) · 0% chance over 30 yrs
- Wildfire 1/10 Low
- Heat 5/10 Major 7 d/yr ≥103°F today · 20 d/yr by 30 yrs out
- Wind 2/10 Low 100% chance of damaging wind over 30 yrs
- Air quality 3/10 Moderate 2 unhealthy d/yr today · 3 by 30 yrs out
Nearby sold comps map
Loading sold comps map…
Walkable amenities ~0.75 mi
Loading nearby amenities…
Taxation est. · year 1
- Rental income
- $85,176
- − Mortgage interest
- −$36,405
- − Property taxes
- −$5,264
- − Insurance
- −$3,250
- − Repairs & maintenance
- −$6,814
- − Management
- −$6,814
- − Depreciation
- −$18,906
- Taxable income
- $7,724
- Est. tax owed @ 24.0%
- −$1,854
- After-tax cash flow
- $16,024/yr
For passive investors: Depreciation is non-cash, so a rental often shows a tax loss while cash-flowing — sheltering income. Rental losses are passive: they offset passive income freely, and up to $25,000/yr can offset ordinary (W-2) income if you actively participate and your MAGI is under $100k (phasing out to $0 by $150k); unused losses carry forward. On sale, claimed depreciation is recaptured at up to 25%, and gains may owe capital-gains tax (a 1031 exchange can defer both). Figures are a year-1 estimate at your 24.0% rate — not tax advice; consult a CPA.
Schools (NCES district)
- District
- Covington Independent
- NCES district ID
- 2101350
- Math proficiency
- 10% ▼ -20.00%
- Reading proficiency
- 27% ▼ -14.00%
- Median HH income
- $33,681
- Composite
- 15.04/100
- National rank
- #9353
- State rank
- #162 of 165 in KY
Livability — Covington
- Score
- 86/100
- State rank
- #40
- US rank
- #376
Category grades
Schools grade is shown separately in the Schools card above.
Census & demographics
- Census place
- Covington, KY
- County
- Kenton County · 142,881 people
- City population
- 34,373
- Metro
- Cincinnati, OH-KY-IN
- Population (ZIP)
- 26,981
- Household income
- $69,970
- Rent vs Own
- Severe rent burden
- 1488.0
Population outlook (Kenton County) Hauer SSP2
- Today (2025)
- 174,205 people
- By 2030
- 177,897 · +2.1%
- By 2040
- 182,671 · +4.9%
- By 2050
- 183,543 · +5.4%
- By 2075
- 178,977 · +2.7%
- By 2100
- 159,920 · -8.2%
Race, ethnicity, and origin ACS 2023
- Neighborhood character
- Predominantly White (72%)
- Race & ethnicity
- White 72% Hispanic / Latino 12% Black 10% Two or more races 7% Asian 1%
- Hispanic origin (detail)
- Mexican 2%
- Common ancestry
- Lithuanian 2% Italian 1% Slovak 1%
- Foreign-born
- 7% · Canada
- Languages at home
- 90% English-only · Spanish 6% Other Indo-European 1%
Political lean MEDSL · Kenton
- 2024 margin
- Strong R (+21.7) · D 38.2% · R 59.9% · Other 1.9%
- 2008→2024 swing
- -0.9pp no change · 2008: -20.9pp · 2024: -21.7pp
- All cycles
- 2024: R+21.7 2020: R+19.3 2016: R+26.1 2012: R+24.3 2008: R+20.9
Not yet ingested
- Civics
- —
Market trends
- HPI YoY
- ▼ -215.20%
- Current HPI
- 237.0869
- Rent YoY
- ▲ 1.55%
- Metro
- Cincinnati, OH-KY-IN
- State GDP YoY
- ▲ 1.81%
- F500 in state
- 4
Industry mix (Fortune 500 HQ in KY)
| Industry | F500 HQs | Revenue |
|---|---|---|
| Healthcare | 1 | $118B |
|
||
| Food / Beverage | 1 | $7B |
|
||
Price history
+2141.0% since first listed19 events — show timeline
- 2026-04-29 Listed $649,900 NKMLS
- 2026-04-27 Listing Removed — NKMLS
- 2026-02-27 Price Changed $675,000 NKMLS
- 2026-01-27 Listed $690,000 NKMLS
- 2016-10-04 Sold (Public Records) $80,600 Public Records
- 2016-08-29 Sold (MLS) $85,000 NKMLS
- 2016-08-05 Listed $125,000 NKMLS
- 2016-04-01 Sold (Public Records) $66,262 Public Records
- 2014-06-13 Sold (MLS) $55,100 NKMLS
- 2014-04-24 Listed $49,900 NKMLS
- 2014-01-11 Listing Removed — NKMLS
- 2013-02-25 Listed $69,900 NKMLS
- 2012-05-11 Listing Removed — NKMLS
- 2011-05-26 Listed $89,900 NKMLS
- 2003-10-02 Sold (Public Records) $103,000 Public Records
- 2003-09-23 Sold (MLS) $103,000 NKMLS
- 2003-03-17 Listed $107,900 NKMLS
- 1995-08-31 Sold (Public Records) $37,000 Public Records
- 1985-12-02 Sold (Public Records) $29,000 Public Records
Property tax history
+10.9%/yrLatest (2025): $5,264 · +0.8% YoY. Source: county tax records.
Cash-flow waterfall
monthlySold comps — $/sqft
last 12 mo · ≤1 miLoading sold comps…