1524 Waverly Rd · Jeffersonville, IN
Flood risk 8/10 · Major
- FEMA flood zone
- X (unshaded)
- Chance of flooding over 30 yrs
- 0.99%
- Est. flood insurance / yr
- $507 – $1,088
Fire risk 1/10 · Minimal
- Est. fire insurance / yr
- $717 – $1,331
Heat risk 5/10 · Moderate
- Hot days now (above 105°F)
- 7 days/yr
- Hot days in 30 yrs
- 20 days/yr
Wind risk 2/10 · Minimal
- Chance of severe wind over 30 yrs
- 2.0%
Air-quality risk 3/10 · Minor
- Unhealthy air days now
- 2 days/yr
- Unhealthy air days in 30 yrs
- 4 days/yr
Risk factors via First Street. Map © Google.
Why this score? — see what drove the C grade
The composite is a weighted blend of 9 inputs, each scored 0–100. Each bar is that input's sub-score; the figure is the points it added to the 100-point composite (weight × sub-score).
- Cash flow +21.1/30.0
- ARV discount +15.0/15.0
- DSCR +6.7/10.0
- 1% rule +4.7/10.0
- Livability +4.2/5.0
- Schools +2.7/10.0
- Rent growth +2.6/5.0
- Condition / age +2.5/5.0
- Appreciation +0.0/10.0
$149,900
🖨 Deal sheet (PDF) 📄 Offer letter ✓ Due diligence
Listing remarks MLS
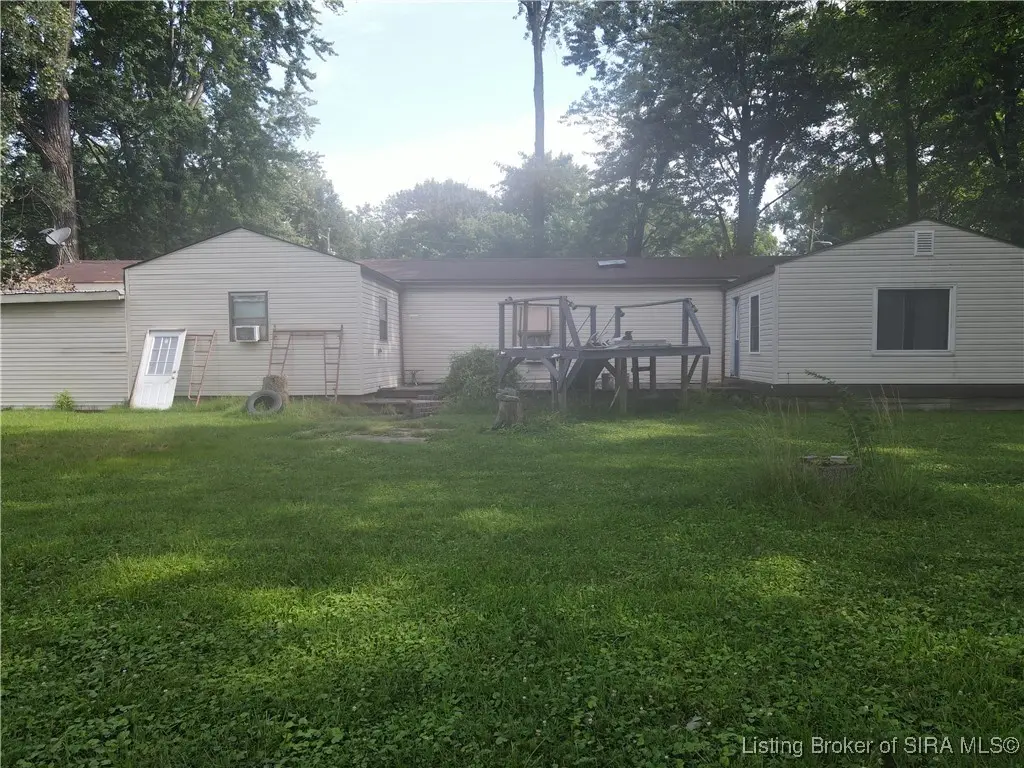
Spacious manufactured home situated on a beautiful wooded lot in a convenient location! This 3-bedroom home features an enclosed sunroom addition that offers extra living space and great views of the surrounding nature. Whether you're looking for a primary residence or an investment opportunity, this property has potential. Home is being sold AS IS—seller welcomes inspections at the buyer’s expense. THIS PROPERTY HAS 2 BUILDABLE LOTS IF YOU DO NOT WANT THE HOME.
Key facts
- Wooded lot
- Buildable lots
- Enclosed sunroom
Tags
Neighborhood map
What this means for you Summary
Snapshot
- This is a 3-bed/1.5-bath manufactured listed at $150k.
Deal economics
- At list price, monthly cash flow is $146 ($2k/yr) — positive.
- The deal already cash-flows at list — no discount required.
- To meet the 1% rule (rent ≥ 1% of price), the offer needs to be $145k (3.1% below list).
- Recommended offer: $132k (12.0% below list) — sets the bar for market timing.
- Cap rate 8.0% vs local median 3.5% in Jeffersonville — top-decile yield for the area; either an underpriced asset or a hidden risk that comps aren't pricing in. Stress-test before assuming the spread holds.
Location & tenants
- Location reads 83/100 on livability (#8 in IN, #843 nationally) — a professional / high-income tenant draw. Strengths: commute A+, cost of living A+, housing A+; Watch: schools C-.
- Greater Clark County Schools (suburban): math 26% / reading 37% proficiency, ranked #224 of 301 in IN (top 74%) — families likely to look elsewhere, expect single-tenant / working-renter base with shorter leases.
- Market conditions: Rents flat; 425 active listings in the ZIP; 12 comparable units currently listed for rent nearby; rentals lingering (median 45d on market — plan ~5-8 weeks vacancy on turnover, expect pricing pressure); 58% of comp listings sitting > 30 days — soft ceiling on asking rent; 911 units permitted in Clark County in 2024 (133 in 5+ unit buildings).
Forward outlook
- Local home prices are declining (-3.0%/yr); year-one equity from $1k of loan paydown is wiped out by about $4k of value loss. Plan a longer hold.
- Clark County population projected at +17% by 2050 — long-run rental-demand tailwind backs the buy-and-hold thesis.
Negotiation context
- It's been on market 150 days — a 12% lower offer ($132k) is reasonable based on typical stale-listing flexibility.
- Current owner paid $60k; list at $150k implies a 150% gain — meaningful room to come down on a strong offer.
Risks & watch-outs
- Watch-outs: flood insurance adds $66/mo.
- Climate carrying-cost: severe flood risk; extreme-heat days projected 7→20/yr by 2055 (HVAC capex compounding) — expect insurance premiums to compound above CPI over the hold.
Questions for the listing agent
- It's been on market 150 days. Have you received any prior offers? Is the seller open to a 12% concession, seller financing, or rate buy-down credit?
- What's the actual annual flood-insurance premium (NFIP or private), and is the property in a SFHA with mandatory coverage?
- Why hasn't it sold? Are there any deal-killer items the seller is aware of (foundation, flood, title, zoning, code violations)?
- Is there a deadline driving the sale (1031 exchange, divorce, estate, relocation)? That informs how much negotiation room exists.
- What's the average days-on-market for RENTAL listings here right now (not sales)? A rising rental-DOM trend means longer vacancies and softer asking-rent achievability than the comps imply.
- What's the recent tenant-quality profile in this submarket — average credit score on applications, eviction rate, late-payment / NSF rate, and stable-employment percentage? A property-management company in the area should have these aggregated.
- How much new for-sale + rental construction is in the pipeline within 1–3 miles? Heavy new supply typically softens prices + rents 12–24 months out; constrained supply supports both.
Investment metrics
- 1% rule
- 0.97% ✗
- Cap rate
- 8.00%
- Cash-on-cash
- 6.09%
- DSCR
- 1.27
- GRM
- 8.6
CMA / ARV
- ARV (median comp)
- $282,144
- List price
- $149,900
- Delta
- -46.87%
- Verdict
- UNDERPRICED
- Comps
- 20 within 1.0 mi
Projected returns pro-forma
-3.0% appreciation · 0.58% rent growth · sell at horizon
- IRR
- -12.4%
- Equity multiple
- 0.56×
- Total profit
- $-18,420
- Equity at exit
- $22,351
- IRR
- -7.4%
- Equity multiple
- 0.58×
- Total profit
- $-17,530
- Equity at exit
- $12,961
Cash invested: $41,972 (down + closing). Projections, not guarantees.
Landlord ↔ Tenant lean methodology
- Overall (STATE)
- 90 Strongly Landlord-Friendly
- State Indiana
- 90 Strongly Landlord-Friendly · R+11
- County
- — inherits STATE
- City
- — inherits STATE
ZIP-level market 47130
- Rents YoY
- 0.6%
- Active inventory
- 425
- Price-to-rent
- 8.6×
Monthly cashflow live
- Estimated rent
- $1,452 high interval (Pro) →
- Mortgage (P&I)
- −$786
- Tax from tax record
- −$86 /mo · $1,030/yr
- Insurance
- −$62
- Flood insurance flood zone
- −$66 /mo · $798/yr
- HOA
- −$0
- Vacancy / Maint / Mgmt
- −$305
- Net cashflow
- $146
Break-even live
Sensitivity live
| Price | -10% $231 | -5% $189 | +0% $146 | +5% $104 | +10% $62 |
|---|---|---|---|---|---|
| Rent | -10% $32 | -5% $89 | +0% $146 | +5% $204 | +10% $261 |
| Rate | -1.0pp $222 | -0.5pp $185 | base $146 | +0.5pp $108 | +1.0pp $68 |
UW: 25.0% down · 7.5% · 30yr · 1.5% tax · 5.0% vac · 8.0% maint · 8.0% mgmt
Financing live
Cash to close
- Down payment
- $37,475
- Closing costs
- $4,497
- Reserves months
- —
- Total cash needed
- —
Loan-product check · same deal, 3 products live
Conventional
25% down · 7.5% · 30yr
- Down + closing
- —
- Monthly P&I
- —
- Monthly cashflow
- —
- DSCR
- —
- Eligible?
- —
Personal DTI + credit; lowest rate.
DSCR
20% down · 8.5% · 30yr
- Down + closing
- —
- Monthly P&I
- —
- Monthly cashflow
- —
- DSCR
- —
- Eligible?
- —
No personal income docs; deal must DSCR.
Hard money
10% down · 12.0% · 12mo
- Down + closing
- —
- Monthly P&I
- —
- Monthly cashflow
- —
- DSCR
- —
- Eligible?
- —
Short-term bridge; refi at stabilization.
Rent comps 12 comps
| Address | Beds | Baths | Sqft | Rent | $/sqft | DOM | Units | Dist |
|---|---|---|---|---|---|---|---|---|
| 3512 Hamburg Pike #7 Jeffersonville, IN | 2.0 | 1.5 | 1200 | $1,025 | $0.85 | 44d | 1 | 0.23mi |
| 4501 Town Center Blvd Jeffersonville, IN | 1.0–3.0 | 1.0–2.0 | 1172 | $1,930 | $1.65 | 2d | 62 | 0.89mi |
| 4903 Hamburg Pike Jeffersonville, IN | 1.0–3.0 | 1.0–2.0 | 1172 | $1,820 | $1.55 | 2d | 21 | 1.10mi |
| 1815 Greentree Blvd Unit 1813-170 Clarksville, IN | 3.0 | 2.0 | 1260 | $1,307 | $1.04 | 44d | 1 | 1.23mi |
| 1527 Lynch Ln Unit B Clarksville, IN | 3.0 | 1.5 | 1224 | $1,325 | $1.08 | 24d | 1 | 1.28mi |
| 2022 Greentree N Unit 1 Clarksville, IN | 3.0 | 2.5 | 1635 | $2,110 | $1.29 | 44d | 1 | 1.33mi |
| 2102 Bradford St Unit 94B Clarksville, IN | 3.0 | 2.0 | 1568 | $1,259 | $0.80 | 4d | 1 | 1.35mi |
| 1909 Greentree Blvd Clarksville, IN | 1.0–3.0 | 1.0–2.0 | 980 | $2,010 | $2.05 | 2d | 11 | 1.39mi |
| 2132 Pacific Dr Unit 16B Clarksville, IN | 3.0 | 2.0 | 1056 | $1,299 | $1.23 | 44d | 1 | 1.41mi |
| 2331 Wellington Green Dr Unit 66 Clarksville, IN | 3.0 | 2.0 | 1088 | $1,059 | $0.97 | 44d | 1 | 1.42mi |
| 1534 Blackiston Mill Rd Unit 2 Clarksville, IN | 3.0 | 1.0 | 1500 | $1,650 | $1.10 | 44d | 1 | 1.46mi |
| 2304 Wellington Green Dr Unit 170 Clarksville, IN | 3.0 | 2.0 | 1088 | $1,169 | $1.07 | 44d | 1 | 1.46mi |
Listing history 17 events
-
2026-06-18days on market $149,900 Active 150 DOM
-
2026-06-17days on market $149,900 Active 149 DOM
-
2026-06-16days on market $149,900 Active 148 DOM
-
2026-06-15days on market $149,900 Active 147 DOM
-
2026-06-13days on market $149,900 Active 145 DOM
-
2026-06-13days on market $149,900 Active 144 DOM
-
2026-06-10days on market $149,900 Active 142 DOM
-
2026-06-09days on market $149,900 Active 141 DOM
-
2026-06-08days on market $149,900 Active 140 DOM
-
2026-06-07days on market $149,900 Active 139 DOM
-
2026-06-03days on market $149,900 Active 135 DOM
-
2026-06-02days on market $149,900 Active 134 DOM
-
2026-06-01days on market $149,900 Active 133 DOM
-
2026-05-31days on market $149,900 Active 132 DOM
-
2026-01-19$149,900 Active 481-char remark
Show marketing remark (481 chars)
Spacious manufactured home situated on a beautiful wooded lot in a convenient location! This 3-bedroom home features an enclosed sunroom addition that offers extra living space and great views of the surrounding nature. Whether you're looking for a primary residence or an investment opportunity, this property has potential. Home is being sold AS IS—seller welcomes inspections at the buyer’s expense. THIS PROPERTY HAS 2 BUILDABLE LOTS IF YOU DO NOT WANT THE HOME.
-
2026-01-12price $149,900
-
2010-04-29soldstatus $60,000
ⓘ Source: listings_history table (triggers on properties + properties_extension) + one-shot
backfill from property_details.listing_events for pre-trigger history.
Tax reassessment forecast IN · Partial reset (capped growth)
- Current annual tax
- $1,030 · $86/mo
- Projected year-2 tax
- $1,152 · $96/mo
- Expected delta
- +$122/yr (+$10/mo · 11.9%)
ⓘ Screening estimate from a state-policy table — verify with the county assessor before closing.
Climate risk First Street
- Flood 8/10 Severe FEMA zone X (unshaded) · 99% chance over 30 yrs
- Wildfire 1/10 Low
- Heat 5/10 Major 7 d/yr ≥105°F today · 20 d/yr by 30 yrs out
- Wind 2/10 Low 2% chance of damaging wind over 30 yrs
- Air quality 3/10 Moderate 2 unhealthy d/yr today · 4 by 30 yrs out
Nearby sold comps map
Loading sold comps map…
Walkable amenities ~0.75 mi
Loading nearby amenities…
Taxation est. · year 1
- Rental income
- $17,426
- − Mortgage interest
- −$8,397
- − Property taxes
- −$1,030
- − Insurance
- −$1,547
- − Repairs & maintenance
- −$1,394
- − Management
- −$1,394
- − Depreciation
- −$4,361
- Taxable loss
- −$696
- Est. tax savings @ 24.0%
- +$167
- After-tax cash flow
- $1,924/yr
For passive investors: Depreciation is non-cash, so a rental often shows a tax loss while cash-flowing — sheltering income. Rental losses are passive: they offset passive income freely, and up to $25,000/yr can offset ordinary (W-2) income if you actively participate and your MAGI is under $100k (phasing out to $0 by $150k); unused losses carry forward. On sale, claimed depreciation is recaptured at up to 25%, and gains may owe capital-gains tax (a 1031 exchange can defer both). Figures are a year-1 estimate at your 24.0% rate — not tax advice; consult a CPA.
Schools (NCES district)
- District
- Greater Clark County Schools
- NCES district ID
- 1803940
- Math proficiency
- 26% ▼ -15.00%
- Reading proficiency
- 37% ▼ -13.00%
- Median HH income
- $47,838
- Composite
- 27.2/100
- National rank
- #7020
- State rank
- #224 of 301 in IN
Livability — Jeffersonville
- Score
- 83/100
- State rank
- #8
- US rank
- #843
Category grades
Schools grade is shown separately in the Schools card above.
Census & demographics
- Census place
- Jeffersonville, IN
- County
- Clark County · 108,879 people
- City population
- 50,514
- Metro
- Louisville/Jefferson County, KY-IN
- Population (ZIP)
- 50,514
- Household income
- $70,290
- Rent vs Own
- Severe rent burden
- 1088.0
Population outlook (Clark County) Hauer SSP2
- Today (2025)
- 126,401 people
- By 2030
- 131,455 · +4.0%
- By 2040
- 140,471 · +11.1%
- By 2050
- 147,677 · +16.8%
- By 2075
- 161,702 · +27.9%
- By 2100
- 164,078 · +29.8%
Race, ethnicity, and origin ACS 2023
- Neighborhood character
- Predominantly White (73%)
- Race & ethnicity
- White 73% Black 12% Two or more races 8% Hispanic / Latino 6% Asian 2%
- Hispanic origin (detail)
- Mexican 3% Puerto Rican 1%
- Common ancestry
- Slovak 3% Lithuanian 2% Romanian 2%
- Foreign-born
- 4% · Canada
- Languages at home
- 95% English-only · Spanish 3% Other Indo-European 1%
Political lean MEDSL · Clark
- 2024 margin
- Strong R (+20.4) · D 38.9% · R 59.3% · Other 1.8%
- 2008→2024 swing
- -13.3pp toward R · 2008: -7.1pp · 2024: -20.4pp
- All cycles
- 2024: R+20.4 2020: R+18.3 2016: R+22.0 2012: R+9.9 2008: R+7.1
Not yet ingested
- Civics
- —
Market trends
- HPI YoY
- ▼ -149.13%
- Current HPI
- 218.1985
- Rent YoY
- ▲ 0.58%
- Metro
- Louisville/Jefferson County, KY-IN
- State GDP YoY
- ▲ 2.90%
- F500 in state
- 18
Industry mix (Fortune 500 HQ in IN)
| Industry | F500 HQs | Revenue |
|---|---|---|
| Industrial Machinery | 2 | $37B |
|
||
| Healthcare | 1 | $177B |
|
||
| Pharmaceuticals | 1 | $45B |
|
||
| Metals / Steel | 1 | $18B |
|
||
| Agriculture | 1 | $17B |
|
||
| Packaging | 1 | $12B |
|
||
Price history
+149.8% since first listed3 events — show timeline
- 2026-01-19 Listed $149,900 SIRA
- 2026-01-12 Price Changed $149,900 SIRA
- 2010-04-29 Sold (Public Records) $60,000 Public Records
Property tax history
+10.6%/yrLatest (2024): $1,030 · +0.2% YoY. Source: county tax records.
Cash-flow waterfall
monthlySold comps — $/sqft
last 12 mo · ≤1 miLoading sold comps…