 Triplex
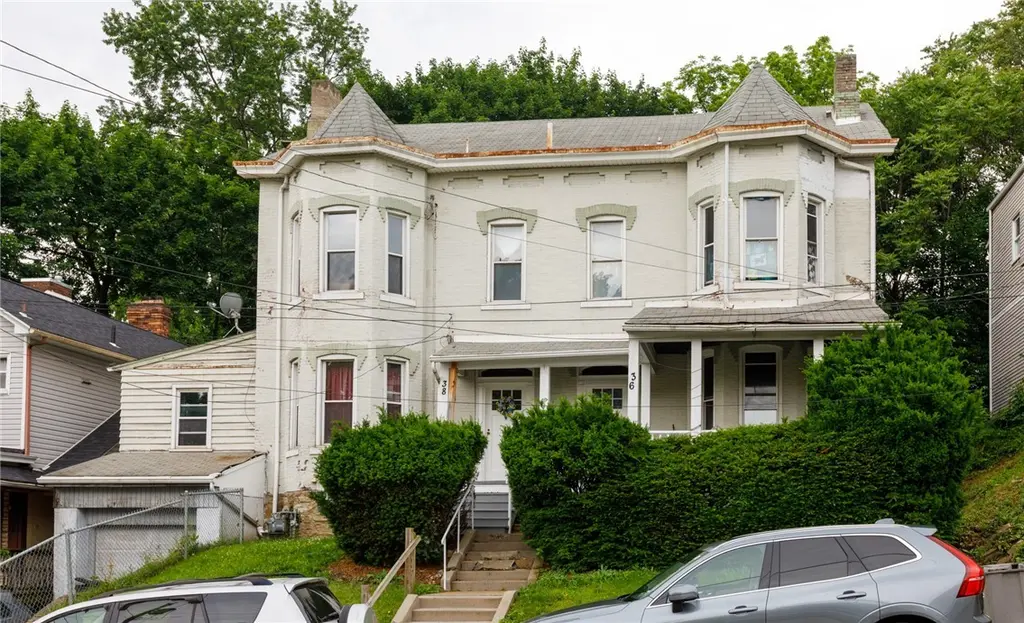
36-38 S Starr Ave · Avalon, PA
Flood risk 1/10 · Minimal
- FEMA flood zone
- X (unshaded)
- Chance of flooding over 30 yrs
- 0.0%
- Est. flood insurance / yr
- $473 – $860
Fire risk 1/10 · Minimal
- Est. fire insurance / yr
- $511 – $949
Heat risk 4/10 · Minor
- Hot days now (above 99°F)
- 7 days/yr
- Hot days in 30 yrs
- 18 days/yr
Wind risk 2/10 · Minimal
- Chance of severe wind over 30 yrs
- —
Air-quality risk 3/10 · Minor
- Unhealthy air days now
- 3 days/yr
- Unhealthy air days in 30 yrs
- 3 days/yr
Risk factors via First Street. Map © Google.
Why this score? — see what drove the C+ grade
The composite is a weighted blend of 9 inputs, each scored 0–100. Each bar is that input's sub-score; the figure is the points it added to the 100-point composite (weight × sub-score).
- Cash flow +25.4/30.0
- DSCR +8.4/10.0
- ARV discount +7.5/15.0
- 1% rule +6.7/10.0
- Livability +4.3/5.0
- Rent growth +3.8/5.0
- Schools +3.4/10.0
- Condition / age +2.2/5.0
- Appreciation +0.0/10.0
$320,000
🖨 Deal sheet 📄 Offer letter ✓ Due diligence
Multi-family units
County records classify this as Multi-Family (2-4 Unit). Listing-text estimate: 3 units. confirmed
Listing remarks
Opportunity awaits with this stately 1920 triplex in the heart of Avalon! Whether you're an investor looking for a solid income-producing property or a buyer hoping to live in one unit while renting the others, this versatile multi-unit property offers tremendous potential. The building features one spacious 3-bedroom unit and two 2-bedroom units. Two of the apartments have been updated with refreshed kitchens and bathrooms. One of the updated 2-bedroom units also features a warm, cabin-like wood-paneled bedroom full of character and charm. The owner’s unit on the second floor includes an updated kitchen and bathroom along with LVP flooring, creating a comfortable and move-in-ready li
Key facts
- Modern updates
- Updated bathrooms
- Historic character
Tags
Property features AI
Finance
- Financial info: Gross rental income reported at $38,700 annually; Unit rents reported approximately $825, $1,250 and $1,150
Exterior
- Parking: Attached garage; Off-street parking; Total of 2 parking spaces
- Utilities: Electricity available; Natural gas available; Public water; Public sewer
- Home design: Multi-unit property with 3 total units
- Construction: Frame construction; Asphalt roof
- Exterior features: Zoned MU (mixed use); Public transportation nearby
Interior
- Bedrooms: Two 2-bedroom units; One 3-bedroom unit
- Bathrooms: Each unit has one full bathroom
- Interior features: Unfinished basement
Neighborhood map
What this means for you Summary
Snapshot
- This is a 2×2bd/1.0ba + 1×3bd/1.0ba units multifamily listed at $320k. Condition is rated fair.
Deal economics
- At list price, monthly cash flow is $738 ($9k/yr) — positive. Per door: $246/mo.
- The deal already cash-flows at list — no discount required.
- Meets the 1% rule at list price ($4k rent vs $320k).
- Recommended offer: $315k (1.5% below list) — sets the bar for market timing.
- Cap rate 9.1% vs local median 5.2% in Avalon — top-decile yield for the area; either an underpriced asset or a hidden risk that comps aren't pricing in. Stress-test before assuming the spread holds.
Location & tenants
- Location reads 86/100 on livability (#63 in PA, #439 nationally) — a professional / high-income tenant draw. Strengths: crime A+, commute A+, cost of living A+; Watch: amenities C-.
- Northgate SD (suburban): math 25% / reading 57% proficiency, ranked #354 of 539 in PA (top 66%) — families likely to look elsewhere, expect single-tenant / working-renter base with shorter leases.
- Market conditions: Rents rising fast (+5.2%/yr); 80 active listings in the ZIP; 2 comparable units currently listed for rent nearby; 2,996 units permitted in Allegheny County in 2024 (1,588 in 5+ unit buildings).
- At $3,733/mo this rent would consume 66% of the median local household income ($68k/yr) (locally 952% of renters already pay >50% of income on rent) — very limited rent-growth headroom before tenants either downsize or default.
Forward outlook
- Local home prices are declining (-3.0%/yr); year-one equity from $2k of loan paydown is wiped out by about $10k of value loss. Plan a longer hold.
- At projected returns (-3.0% appreciation + 5.2% rent growth), your $90k cash investment doubles in ~9 years — after that, you're playing with house money.
Negotiation context
- It's been on market 20 days — a 2% lower offer ($315k) is reasonable based on typical stale-listing flexibility.
Risks & watch-outs
- Watch-outs: built in 1920 — expect roof / HVAC / electrical / plumbing capex.
Questions for the listing agent
- Can we see the unit-by-unit rent roll, current vacancy, and any below-market leases? What's the average tenancy length?
- What capital expenditures (roof, boiler, parking lot, exteriors) have been made in the last 5 years, and what's planned in the next 2?
- Have any recent inspections been done? Can we get a copy of the seller's disclosures and any deferred-maintenance estimates?
- Built in 1920 — when were the roof, HVAC, electrical panel, plumbing, and water heater last replaced?
- Is there a deadline driving the sale (1031 exchange, divorce, estate, relocation)? That informs how much negotiation room exists.
- What's the average days-on-market for RENTAL listings here right now (not sales)? A rising rental-DOM trend means longer vacancies and softer asking-rent achievability than the comps imply.
- What's the recent tenant-quality profile in this submarket — average credit score on applications, eviction rate, late-payment / NSF rate, and stable-employment percentage? A property-management company in the area should have these aggregated.
- How much new apartment / multifamily construction is in the pipeline within 1–3 miles? Heavy new supply (>2% of stock underway) typically softens rents 12–24 months out; light construction supports rent growth.
Investment metrics
- 1% rule
- 1.17% ✓
- Cap rate
- 9.06%
- Cash-on-cash
- 9.88%
- DSCR
- 1.44
- GRM
- 7.1
CMA / ARV
No comps found within radius.
Show comp detail 12 sales within ~0.75 mi
| Address | Dist | Beds/Ba | Sqft | Sold | Price | $/sf | Match |
|---|---|---|---|---|---|---|---|
| 918 California Ave | 0.18mi | 5/3.0 (-1) | — | 10mo | $275,000 | — | 66 |
| 723 Taylor Ave | 0.39mi | 5/3.0 (-1) | — | 1mo | $289,000 | — | 63 |
| 505 Dawson | 0.38mi | 6/3.0 | — | 12mo | $272,000 | — | 60 |
| 566 Orchard Ave | 0.40mi | 5/3.0 (-1) | — | 8mo | $280,000 | — | 57 |
| 622 Means Ave | 0.40mi | 6/2.0 | — | 10mo | $240,000 | — | 56 |
| 232 Summit Ave | 0.57mi | 6/2.0 | — | 2mo | $250,000 | — | 55 |
| 240 W Riverview Ave | 0.44mi | 7/3.0 (+1) | — | 11mo | $379,000 | — | 52 |
| 504 Florence Ave | 0.60mi | 5/2.0 (-1) | — | 4mo | $267,000 | — | 47 |
| 530 California Ave | 0.59mi | 5/4.0 (-1) | — | 10mo | $282,500 | — | 43 |
| 640 Maryland Ave | 0.69mi | 5/3.0 (-1) | — | 10mo | $270,000 | — | 42 |
| 101 Grant Ave | 0.73mi | 5/3.0 (-1) | — | 9mo | $285,000 | — | 41 |
| 511-513 California Ave | 0.63mi | 5/5.0 (-1) | — | 5mo | $132,500 | — | 41 |
Match score weights: distance 35% · size 25% · config 20% · recency 20%. Top-matched comps best support the ARV.
Projected returns pro-forma
-3.0% appreciation · 5.16% rent growth · sell at horizon
- IRR
- 1.0%
- Equity multiple
- 1.04×
- Total profit
- $3,470
- Equity at exit
- $47,713
- IRR
- 12.7%
- Equity multiple
- 2.11×
- Total profit
- $99,289
- Equity at exit
- $27,668
Cash invested: $89,600 (down + closing). Projections, not guarantees.
Landlord ↔ Tenant lean methodology
- Overall (STATE)
- 62 Landlord-Friendly
- State Pennsylvania
- 62 Landlord-Friendly · EVEN
- County
- — inherits STATE
- City
- — inherits STATE
ZIP-level market 15202
- Home prices YoY
- -30.2%
- Rents YoY
- 5.2%
- Active inventory
- 80
- Price-to-rent
- 23.3×
Monthly cashflow live
- Estimated rent
- $3,733 high interval (Pro) →
- Mortgage (P&I)
- −$1,678
- Tax est. 1.5%
- −$400 /mo · $4,800/yr
- Insurance
- −$133
- HOA
- −$0
- Vacancy / Maint / Mgmt
- −$784
- Net cashflow
- $738
Break-even live
3-unit breakdown (identical units grouped — click to expand)
| Units | Beds | Baths | Est. rent |
|---|---|---|---|
| 2× units | 2 | 1 | $2,286 |
| #1 | 2 | 1 | $1,143 |
| #2 | 2 | 1 | $1,143 |
| 1× unit | 3 | 1 | $1,448 |
| Total (3 units) | $3,733 | ||
UW: 25.0% down · 7.5% · 30yr · 1.5% tax · 5.0% vac · 8.0% maint · 8.0% mgmt
Financing live
Cash to close
- Down payment
- $80,000
- Closing costs
- $9,600
- Reserves months
- —
- Total cash needed
- —
Loan-product check · same deal, 3 products live
Conventional
25% down · 7.5% · 30yr
- Down + closing
- —
- Monthly P&I
- —
- Monthly cashflow
- —
- DSCR
- —
- Eligible?
- —
Personal DTI + credit; lowest rate.
DSCR
20% down · 8.5% · 30yr
- Down + closing
- —
- Monthly P&I
- —
- Monthly cashflow
- —
- DSCR
- —
- Eligible?
- —
No personal income docs; deal must DSCR.
Hard money
10% down · 12.0% · 12mo
- Down + closing
- —
- Monthly P&I
- —
- Monthly cashflow
- —
- DSCR
- —
- Eligible?
- —
Short-term bridge; refi at stabilization.
Rent comps 2 comps
| Address | Beds | Baths | Sqft | Rent | $/sqft | DOM | Units | Dist |
|---|---|---|---|---|---|---|---|---|
| 535 Marie Ave Pittsburgh, PA | 5.0 | 4.0 | — | $2,445 | — | 1d | 1 | 0.63mi |
| 1712 Termon Ave Pittsburgh, PA | 7.0 | 4.5 | — | $3,500 | — | 1d | 1 | 1.40mi |
Listing history 13 events
-
2026-06-18days on market $320,000 Active 20 DOM
-
2026-06-17days on market $320,000 Active 19 DOM
-
2026-06-16days on market $320,000 Active 18 DOM
-
2026-06-15days on market $320,000 Active 17 DOM
-
2026-06-13days on market $320,000 Active 15 DOM
-
2026-06-13days on market $320,000 Active 14 DOM
-
2026-06-09days on market $320,000 Active 11 DOM
-
2026-06-08days on market $320,000 Active 10 DOM
-
2026-06-07days on market $320,000 Active 9 DOM
-
2026-06-03days on market $320,000 Active 5 DOM
-
2026-06-02days on market $320,000 Active 4 DOM
-
2026-06-01days on market $320,000 Active 3 DOM
-
2026-05-31days on market $320,000 Active 2 DOM
ⓘ Source: listings_history table (triggers on properties + properties_extension) + one-shot
backfill from property_details.listing_events for pre-trigger history.
Climate risk First Street
- Flood 1/10 Low FEMA zone X (unshaded) · 0% chance over 30 yrs
- Wildfire 1/10 Low
- Heat 4/10 Moderate 7 d/yr ≥99°F today · 18 d/yr by 30 yrs out
- Wind 2/10 Low
- Air quality 3/10 Moderate 3 unhealthy d/yr today · 3 by 30 yrs out
Nearby sold comps map
Loading sold comps map…
Walkable amenities ~0.75 mi
Loading nearby amenities…
Taxation est. · year 1
- Rental income
- $44,796
- − Mortgage interest
- −$17,925
- − Property taxes
- −$4,800
- − Insurance
- −$1,600
- − Repairs & maintenance
- −$3,584
- − Management
- −$3,584
- − Depreciation
- −$9,309
- Taxable income
- $3,995
- Est. tax owed @ 24.0%
- −$959
- After-tax cash flow
- $7,893/yr
For passive investors: Depreciation is non-cash, so a rental often shows a tax loss while cash-flowing — sheltering income. Rental losses are passive: they offset passive income freely, and up to $25,000/yr can offset ordinary (W-2) income if you actively participate and your MAGI is under $100k (phasing out to $0 by $150k); unused losses carry forward. On sale, claimed depreciation is recaptured at up to 25%, and gains may owe capital-gains tax (a 1031 exchange can defer both). Figures are a year-1 estimate at your 24.0% rate — not tax advice; consult a CPA.
Condition & rehab AI · 12 photos
This 1920 triplex in Avalon requires moderate renovations to improve its condition and increase its value. Focus on updating the kitchen and bathrooms to attract buyers and renters.
Repairs flagged
- Moderate kitchen cabinets — dated and in need of replacement
- Moderate bathroom fixtures — outdated and possibly in need of replacement
- Moderate flooring — carpeted floors in living areas, possibly outdated
- Minor interior paint — paint appears worn in some areas
Value-add opportunities
- Both kitchen renovation — modernizing the kitchen can increase both resale and rental value
- Both bathroom updates — modernizing bathrooms can increase both resale and rental value
- Both HVAC system upgrade — upgrading the HVAC system can improve comfort and energy efficiency, increasing both resale and rental value
Renovation cost estimate screening
| Repair item | Severity | Est. cost |
|---|---|---|
| kitchen cabinets · dated and in need of replacement | Moderate | $3,000–15,000 |
| bathroom fixtures · outdated and possibly in need of replacement | Moderate | $3,000–15,000 |
| flooring · carpeted floors in living areas, possibly outdated | Moderate | $3,000–15,000 |
| interior paint · paint appears worn in some areas | Minor | $500–3,000 |
| Total estimated repair cost · 4 items | $9,500–48,000 |
Value-add ROI direction
- Both kitchen renovation — modernizing the kitchen can increase both resale and rental value ↑
- Both bathroom updates — modernizing bathrooms can increase both resale and rental value ↑
- Both HVAC system upgrade — upgrading the HVAC system can improve comfort and energy efficiency, increasing both resale and rental value ↑
ⓘ Cost ranges are severity-bucket heuristics (US national rule-of-thumb). Get contractor quotes + a written scope before underwriting a rehab budget.
Schools (NCES district)
- District
- Northgate SD
- NCES district ID
- 4217770
- Math proficiency
- 25% ▼ -12.00%
- Reading proficiency
- 57% ▼ -5.00%
- Median HH income
- $39,084
- Composite
- 34.15/100
- National rank
- #5279
- State rank
- #354 of 539 in PA
Livability — Avalon
- Score
- 86/100
- State rank
- #63
- US rank
- #439
Category grades
Schools grade is shown separately in the Schools card above.
Census & demographics
- Census place
- Avalon, PA
- County
- Allegheny County · 1,022,028 people
- City population
- 19,642
- Metro
- Pittsburgh, PA
- Population (ZIP)
- 19,564
- Household income
- $68,287
- Rent vs Own
- Severe rent burden
- 952.0
Population outlook (Allegheny County) Hauer SSP2
- Today (2025)
- 1,250,282 people
- By 2030
- 1,256,482 · +0.5%
- By 2040
- 1,256,318 · +0.5%
- By 2050
- 1,244,169 · -0.5%
- By 2075
- 1,197,693 · -4.2%
- By 2100
- 1,093,187 · -12.6%
Race, ethnicity, and origin ACS 2023
- Neighborhood character
- Predominantly White (83%)
- Race & ethnicity
- White 83% Black 9% Two or more races 5% Hispanic / Latino 2% Asian 1%
- Common ancestry
- Romanian 6% Italian 2% Lithuanian 2%
- Foreign-born
- 2% · Canada, China
- Languages at home
- 96% English-only · Other Indo-European 1% Spanish 1% Chinese 1%
Political lean MEDSL · Allegheny
- 2024 margin
- Strong D (+20.3) · D 59.7% · R 39.4%
- 2008→2024 swing
- +4.8pp toward D · 2008: 15.5pp · 2024: 20.3pp
- All cycles
- 2024: D+20.3 2020: D+20.4 2016: D+16.4 2012: D+14.4 2008: D+15.5
Not yet ingested
- Civics
- —
Market trends
- HPI YoY
- ▼ -118.40%
- Current HPI
- 274.1929
- Rent YoY
- ▲ 5.16%
- Metro
- Pittsburgh, PA
- State GDP YoY
- ▲ 1.68%
- F500 in state
- 34
Industry mix (Fortune 500 HQ in PA)
| Industry | F500 HQs | Revenue |
|---|---|---|
| Healthcare | 2 | $309B |
|
||
| Insurance | 2 | $27B |
|
||
| Telecommunications / Media | 1 | $124B |
|
||
| Industrial Distribution | 1 | $22B |
|
||
| Financial Services | 1 | $20B |
|
||
| Chemicals / Materials | 1 | $18B |
|
||
Price history
1 event — show timeline
- 2026-05-29 Listed $320,000 West Penn MLS
Cash-flow waterfall
monthlySold comps — $/sqft
last 12 mo · ≤1 miLoading sold comps…