109 Westkill Rd · Jefferson, NY
Flood risk 1/10 · Minimal
- FEMA flood zone
- X (unshaded)
- Chance of flooding over 30 yrs
- 0.0%
- Est. flood insurance / yr
- $473 – $860
Fire risk 3/10 · Minor
- Est. fire insurance / yr
- $691 – $1,283
Heat risk 1/10 · Minimal
- Hot days now (above 89°F)
- 7 days/yr
- Hot days in 30 yrs
- 17 days/yr
Wind risk 2/10 · Minimal
- Chance of severe wind over 30 yrs
- 2.0%
Air-quality risk 2/10 · Minimal
- Unhealthy air days now
- 0 days/yr
- Unhealthy air days in 30 yrs
- 1 days/yr
Risk factors via First Street. Map © Google.
Why this score? — see what drove the C- grade
The composite is a weighted blend of 9 inputs, each scored 0–100. Each bar is that input's sub-score; the figure is the points it added to the 100-point composite (weight × sub-score).
- Cash flow +14.8/30.0
- Appreciation +10.0/10.0
- ARV discount +7.5/15.0
- DSCR +4.5/10.0
- 1% rule +4.3/10.0
- Schools +2.9/10.0
- Rent growth +2.5/5.0
- Livability +2.5/5.0
- Condition / age +2.5/5.0
$130,000
🖨 Deal sheet 📄 Offer letter ✓ Due diligence
Listing remarks
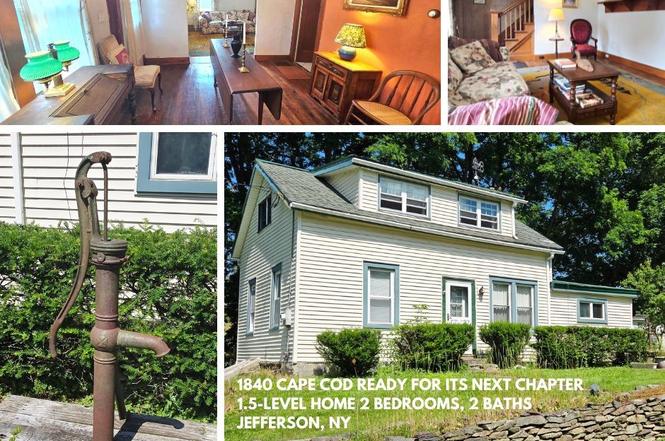
Price Adjustment - All reasonable offers will be presented to the seller. Buyers should understand that they could move in tomorrow but the home does require some work that can be done at their pace. A new furnace is needed therefore unlikely to qualify for conventional or FHA loans. Timeless 1840 Cape Cod Ready for Its Next Chapter Step into the story of this classic 1840 Cape Cod—a 1.5-level home offering 2 bedrooms, 2 baths, and approximately 1,280 sq ft of warm, character-rich living space. Nestled on a manageable 0.3-acre lot, this home is a blend of early American charm and practical updates, waiting for its next caretaker to continue its journey. Inside, discover sunlit room
Key facts
- Updated appliances
- Working fireplace
- Thermal windows
Tags
Property features AI
Exterior
- Parking: No garage
- Utilities: Electricity connected; High-speed internet available; Public water connected; Septic tank
- Home design: Single-story; Resale property; Stone foundation
- Construction: Frame construction with vinyl siding; Asphalt and metal roof
- Exterior features: Deck; Dirt driveway; TV antenna; Leased propane tank; Shed(s) and storage
Interior
- Kitchen: Dishwasher; Gas oven; Gas range; Refrigerator
- Bedrooms: Total rooms include bedroom spaces as part of the 9 total rooms
- Flooring: Hardwood; Vinyl; Varied flooring
- Bathrooms: 1 full bathroom; 1 half bathroom; 1 main-level bathroom
- Heating & cooling: Propane heating; Baseboard heating; Forced air; Space heater
- Interior features: Entrance foyer; Eat-in kitchen; Jetted tub; Living/dining room combination; Sunroom; Sitting room; Other interior spaces (see remarks); Thermal windows
- Laundry & utility: Propane water heater; Sump pump
Neighborhood map
What this means for you Summary
Snapshot
- This is a 2-bed/2.0-bath single-family listed at $130k.
Deal economics
- At list price, monthly cash flow is $36 ($434/yr) — positive.
- The deal already cash-flows at list — no discount required.
- To meet the 1% rule (rent ≥ 1% of price), the offer needs to be $121k (7.0% below list).
- Recommended offer: $114k (12.0% below list) — sets the bar for market timing.
Location & tenants
- Location reads: area grade C — affects rentability + tenant quality, not the cash-flow math above.
- Jefferson Central School District (rural): math 30% / reading 30% proficiency, ranked #723 of 755 in NY (top 96%) — families likely to look elsewhere, expect single-tenant / working-renter base with shorter leases.
- Market conditions: 35 active listings in the ZIP; 35 units permitted in Schoharie County in 2024 (0 in 5+ unit buildings).
Forward outlook
- In year one you build about $14k of equity ($899 loan paydown + $13k appreciation (10.0% local appreciation)).
- Schoharie County population projected at -30% by 2050 — secular population decline; favor cash flow + early exit over multi-decade hold.
- At projected returns (10.0% appreciation + 3.0% rent growth), your $36k cash investment doubles in ~3 years — after that, you're playing with house money.
- By year 3, paydown + projected appreciation supports a ~$35k cash-out refi (75% LTV) — recoverable capital for the next deal without selling this one.
Negotiation context
- It's been on market 275 days — a 12% lower offer ($114k) is reasonable based on typical stale-listing flexibility.
- 2 sale attempts; this cycle's ask has dropped $20k (13%) from the opening price — seller is motivated, your offer sets the floor, not the list.
Risks & watch-outs
- Watch-outs: built in 1840 — expect roof / HVAC / electrical / plumbing capex.
Questions for the listing agent
- It's been on market 275 days. Have you received any prior offers? Is the seller open to a 12% concession, seller financing, or rate buy-down credit?
- Built in 1840 — when were the roof, HVAC, electrical panel, plumbing, and water heater last replaced?
- Why hasn't it sold? Are there any deal-killer items the seller is aware of (foundation, flood, title, zoning, code violations)?
- Is there a deadline driving the sale (1031 exchange, divorce, estate, relocation)? That informs how much negotiation room exists.
- What's the average days-on-market for RENTAL listings here right now (not sales)? A rising rental-DOM trend means longer vacancies and softer asking-rent achievability than the comps imply.
- What's the recent tenant-quality profile in this submarket — average credit score on applications, eviction rate, late-payment / NSF rate, and stable-employment percentage? A property-management company in the area should have these aggregated.
- How much new for-sale + rental construction is in the pipeline within 1–3 miles? Heavy new supply typically softens prices + rents 12–24 months out; constrained supply supports both.
Investment metrics
- 1% rule
- 0.93% ✗
- Cap rate
- 6.63%
- Cash-on-cash
- 1.19%
- DSCR
- 1.05
- GRM
- 9.0
CMA / ARV
No comps found within radius.
Projected returns pro-forma
10.0% appreciation · 3.0% rent growth · sell at horizon
- IRR
- 25.1%
- Equity multiple
- 3.01×
- Total profit
- $73,138
- Equity at exit
- $117,114
- IRR
- 22.2%
- Equity multiple
- 6.87×
- Total profit
- $213,626
- Equity at exit
- $252,561
Cash invested: $36,400 (down + closing). Projections, not guarantees.
Landlord ↔ Tenant lean methodology
- Overall (STATE)
- 15 Strongly Tenant-Friendly
- State New York
- 15 Strongly Tenant-Friendly · D+10
- County
- — inherits STATE
- City
- — inherits STATE
ZIP-level market 12093
- Home prices YoY
- 4.8%
- Active inventory
- 35
- Price-to-rent
- 9.0×
Monthly cashflow live
- Estimated rent
- $1,209 medium interval (Pro) →
- Mortgage (P&I)
- −$682
- Tax from tax record
- −$183 /mo · $2,194/yr
- Insurance
- −$54
- HOA
- −$0
- Vacancy / Maint / Mgmt
- −$254
- Net cashflow
- $36
Break-even live
UW: 25.0% down · 7.5% · 30yr · 1.5% tax · 5.0% vac · 8.0% maint · 8.0% mgmt
Financing live
Cash to close
- Down payment
- $32,500
- Closing costs
- $3,900
- Reserves months
- —
- Total cash needed
- —
Loan-product check · same deal, 3 products live
Conventional
25% down · 7.5% · 30yr
- Down + closing
- —
- Monthly P&I
- —
- Monthly cashflow
- —
- DSCR
- —
- Eligible?
- —
Personal DTI + credit; lowest rate.
DSCR
20% down · 8.5% · 30yr
- Down + closing
- —
- Monthly P&I
- —
- Monthly cashflow
- —
- DSCR
- —
- Eligible?
- —
No personal income docs; deal must DSCR.
Hard money
10% down · 12.0% · 12mo
- Down + closing
- —
- Monthly P&I
- —
- Monthly cashflow
- —
- DSCR
- —
- Eligible?
- —
Short-term bridge; refi at stabilization.
Listing history 19 events
-
2026-06-18days on market $130,000 Active 275 DOM
-
2026-06-17days on market $130,000 Active 274 DOM
-
2026-06-16days on market $130,000 Active 273 DOM
-
2026-06-15days on market $130,000 Active 272 DOM
-
2026-06-13days on market $130,000 Active 270 DOM
-
2026-06-12days on market $130,000 Active 269 DOM
-
2026-06-09days on market $130,000 Active 266 DOM
-
2026-06-08days on market $130,000 Active 265 DOM
-
2026-06-07days on market $130,000 Active 264 DOM
-
2026-06-05days on market $130,000 Active 262 DOM
-
2026-06-04days on market $130,000 Active 260 DOM
-
2026-06-02days on market $130,000 Active 259 DOM
-
2026-06-01days on market $130,000 Active 258 DOM
-
2026-05-31days on market $130,000 Active 257 DOM
-
2025-12-12status Active
-
2025-10-27status Pending
-
2025-10-09historical Active Under Contract
-
2025-09-05price $130,000
-
2025-08-01$150,000 Active
ⓘ Source: listings_history table (triggers on properties + properties_extension) + one-shot
backfill from property_details.listing_events for pre-trigger history.
Tax reassessment forecast NY · Partial reset (capped growth)
- Current annual tax
- $2,194 · $183/mo
- Projected year-2 tax
- $2,195 · $183/mo
- Expected delta
- +$2/yr ($0/mo · 0.1%)
ⓘ Screening estimate from a state-policy table — verify with the county assessor before closing.
Climate risk First Street
- Flood 1/10 Low FEMA zone X (unshaded) · 0% chance over 30 yrs
- Wildfire 3/10 Moderate
- Heat 1/10 Low 7 d/yr ≥89°F today · 17 d/yr by 30 yrs out
- Wind 2/10 Low 2% chance of damaging wind over 30 yrs
- Air quality 2/10 Low 0 unhealthy d/yr today · 1 by 30 yrs out
Nearby sold comps map
Loading sold comps map…
Walkable amenities ~0.75 mi
Loading nearby amenities…
Taxation est. · year 1
- Rental income
- $14,505
- − Mortgage interest
- −$7,282
- − Property taxes
- −$2,194
- − Insurance
- −$650
- − Repairs & maintenance
- −$1,160
- − Management
- −$1,160
- − Depreciation
- −$3,782
- Taxable loss
- −$1,723
- Est. tax savings @ 24.0%
- +$414
- After-tax cash flow
- $848/yr
For passive investors: Depreciation is non-cash, so a rental often shows a tax loss while cash-flowing — sheltering income. Rental losses are passive: they offset passive income freely, and up to $25,000/yr can offset ordinary (W-2) income if you actively participate and your MAGI is under $100k (phasing out to $0 by $150k); unused losses carry forward. On sale, claimed depreciation is recaptured at up to 25%, and gains may owe capital-gains tax (a 1031 exchange can defer both). Figures are a year-1 estimate at your 24.0% rate — not tax advice; consult a CPA.
Schools (NCES district)
- District
- Jefferson Central School District
- NCES district ID
- 3615720
- Math proficiency
- 30% ▬ 0.00%
- Reading proficiency
- 30% ▬ 0.00%
- Median HH income
- $50,778
- Composite
- 29.11/100
- National rank
- #11892
- State rank
- #723 of 755 in NY
Livability — Jefferson
No livability data for this city. (Only ~50 U.S. cities are tracked.)
Census & demographics
- Census place
- Jefferson, NY
- Population (ZIP)
- 1,258
Population outlook (Schoharie County) Hauer SSP2
- Today (2025)
- 29,080 people
- By 2030
- 27,417 · -5.7%
- By 2040
- 23,835 · -18.0%
- By 2050
- 20,482 · -29.6%
- By 2075
- 14,323 · -50.7%
- By 2100
- 9,636 · -66.9%
Race, ethnicity, and origin ACS 2023
- Neighborhood character
- Predominantly White (87%)
- Race & ethnicity
- White 87% Two or more races 11% Hispanic / Latino 3% Asian 1%
- Common ancestry
- Iranian 4% Romanian 3% Slovak 3%
- Foreign-born
- 4% · Canada
- Languages at home
- 89% English-only · Other Indo-European 4% Spanish 3% Other Asian/Pacific 3%
Political lean MEDSL · Schoharie
- 2024 margin
- Solid R (+30.5) · D 34.7% · R 65.3%
- 2008→2024 swing
- -16.2pp toward R · 2008: -14.3pp · 2024: -30.5pp
- All cycles
- 2024: R+30.5 2020: R+29.0 2016: R+34.7 2012: R+16.6 2008: R+14.3
Not yet ingested
- Civics
- —
Market trends
- HPI YoY
- ▲ 16.67%
- Current HPI
- 365.9951
- Rent YoY
- —
- Metro
- —
- State GDP YoY
- ▲ 2.60%
- F500 in state
- 92
Industry mix (Fortune 500 HQ in NY)
| Industry | F500 HQs | Revenue |
|---|---|---|
| Financial Services | 10 | $950B |
|
||
| Consumer Goods | 9 | $162B |
|
||
| Insurance | 4 | $225B |
|
||
| Telecommunications | 2 | $144B |
|
||
| Pharmaceuticals | 2 | $112B |
|
||
| Media / Entertainment | 2 | $69B |
|
||
Price history
-13.3% since first listed5 events — show timeline
- 2025-12-12 Relisted — UNYREIS
- 2025-10-27 Pending — UNYREIS
- 2025-10-09 Contingent — UNYREIS
- 2025-09-05 Price Changed $130,000 UNYREIS
- 2025-08-01 Listed $150,000 UNYREIS
Property tax history
+1.5%/yrLatest (2025): $2,194 · +8.6% YoY. Source: county tax records.
Cash-flow waterfall
monthlySold comps — $/sqft
last 12 mo · ≤1 miLoading sold comps…