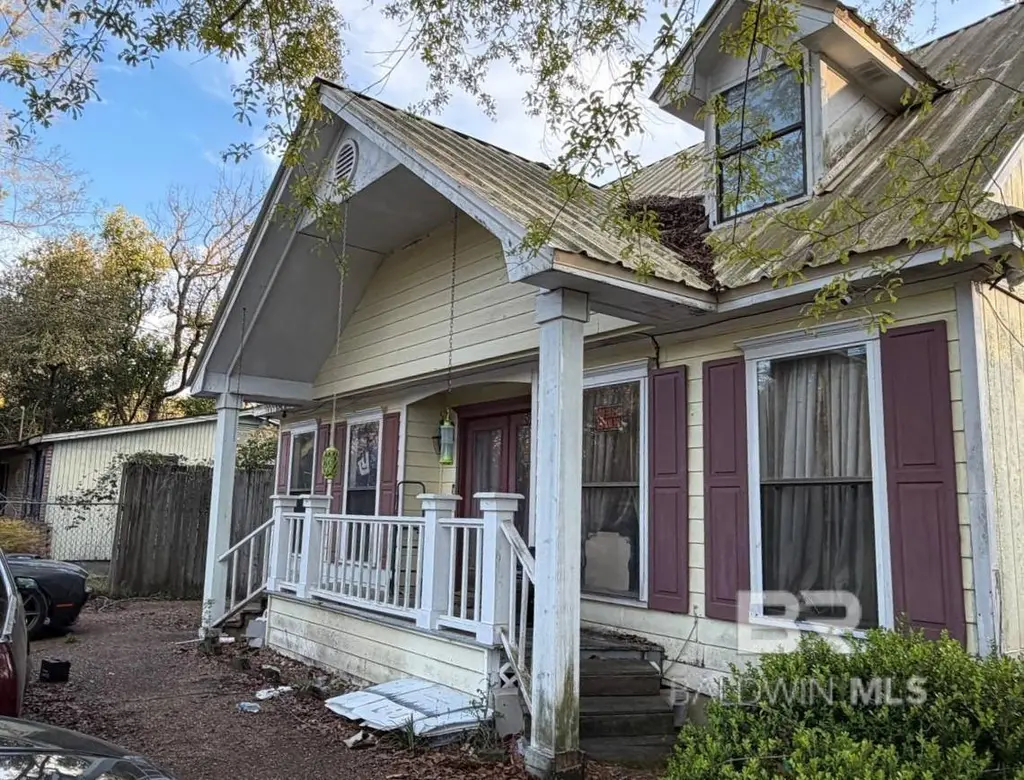
5211 Jones Rd · Mobile, AL
Flood risk 1/10 · Minimal
- FEMA flood zone
- X (unshaded)
- Chance of flooding over 30 yrs
- 0.0%
- Est. flood insurance / yr
- $507 – $1,088
Fire risk 5/10 · Moderate
- Est. fire insurance / yr
- $916 – $1,700
Heat risk 10/10 · Severe
- Hot days now (above 105°F)
- 7 days/yr
- Hot days in 30 yrs
- 22 days/yr
Wind risk 9/10 · Severe
- Chance of severe wind over 30 yrs
- 99.0%
Air-quality risk 2/10 · Minimal
- Unhealthy air days now
- 1 days/yr
- Unhealthy air days in 30 yrs
- 1 days/yr
Risk factors via First Street. Map © Google.
Why this score? — see what drove the B- grade
The composite is a weighted blend of 9 inputs, each scored 0–100. Each bar is that input's sub-score; the figure is the points it added to the 100-point composite (weight × sub-score).
- Cash flow +30.0/30.0
- 1% rule +10.0/10.0
- DSCR +10.0/10.0
- ARV discount +7.5/15.0
- Livability +3.8/5.0
- Rent growth +2.5/5.0
- Condition / age +2.5/5.0
- Schools +2.3/10.0
- Appreciation +0.0/10.0
$63,000
🖨 Deal sheet 📄 Offer letter ✓ Due diligence
Listing remarks MLS
*Investor special, cash only property.* 3 bedrooms, 2.5 baths, and over 1,600 square feet. Two-story layout with a family room open to the kitchen. Primary bedroom with private bath on the main level, along with a half bath off the hallway and a separate formal living room at the front. Upstairs features two bedrooms connected by a Jack and Jill bathroom, each with private access. Large rear deck. Per seller, hot water is 2 years old. Schedule a showing with your favorite realtor today! *More photos available upon request*.
Key facts
- 6,795 sq ft lot
- Built 1992
- Listed 69 days
Neighborhood map
What this means for you Summary
Snapshot
- This is a 3-bed/2.0-bath single-family listed at $63k.
Deal economics
- At list price, monthly cash flow is $1k ($13k/yr) — positive.
- The deal already cash-flows at list — no discount required.
- Meets the 1% rule at list price ($2k rent vs $63k).
- Recommended offer: $59k (6.0% below list) — sets the bar for market timing.
- Cap rate 26.3% vs local median 4.9% in Mobile — top-decile yield for the area; either an underpriced asset or a hidden risk that comps aren't pricing in. Stress-test before assuming the spread holds.
Location & tenants
- Location reads 75/100 on livability (#20 in AL, #4,262 nationally) — a middle-class / working-renter tenant base. Strengths: commute A+, cost of living A+, housing A+; Watch: schools D-, crime F, employment D-.
- Mobile County (urban): math 15% / reading 39% proficiency, ranked #81 of 129 in AL (top 63%) — low school quality limits family demand, transient renter base, plan for 1-2y turnover; 67% free/reduced lunch — lower-income household profile, screen leases tightly.
- Market conditions: 250 active listings in the ZIP; 2 comparable units currently listed for rent nearby; 1,678 units permitted in Mobile County in 2024 (264 in 5+ unit buildings).
- This rent runs 34% of the median local income ($65k/yr) — at the standard rent-burdened threshold; future hikes will face affordability resistance.
Forward outlook
- Local home prices are declining (-3.0%/yr); year-one equity from $436 of loan paydown is wiped out by about $2k of value loss. Plan a longer hold.
- Mobile County population projected to shrink 8% by 2050 — rents likely to lag national; underwrite the cash flow, not the appreciation.
- At projected returns (-3.0% appreciation + 3.0% rent growth), your $18k cash investment doubles in ~2 years — after that, you're playing with house money.
Negotiation context
- It's been on market 69 days — a 6% lower offer ($59k) is reasonable based on typical stale-listing flexibility.
- 3 sale attempts; this cycle's ask has dropped $10k (14%) from the opening price — seller is motivated, your offer sets the floor, not the list.
Risks & watch-outs
- Climate carrying-cost: severe wind risk, 99% chance of damaging wind over 30y; moderate wildfire risk; extreme-heat days projected 7→22/yr by 2055 (HVAC capex compounding) — expect insurance premiums to compound above CPI over the hold.
Questions for the listing agent
- It's been on market 69 days. Have you received any prior offers? Is the seller open to a 6% concession, seller financing, or rate buy-down credit?
- Why hasn't it sold? Are there any deal-killer items the seller is aware of (foundation, flood, title, zoning, code violations)?
- Is there a deadline driving the sale (1031 exchange, divorce, estate, relocation)? That informs how much negotiation room exists.
- Schools are D-rated, which usually means shorter tenancies and higher turnover. Who's the typical renter profile here, and what's been the actual vacancy rate?
- Crime grade is F in this area — have there been break-ins, vandalism, or insurance claims at this property in the last 3 years? What carrier currently insures it and at what premium?
- What's the average days-on-market for RENTAL listings here right now (not sales)? A rising rental-DOM trend means longer vacancies and softer asking-rent achievability than the comps imply.
- What's the recent tenant-quality profile in this submarket — average credit score on applications, eviction rate, late-payment / NSF rate, and stable-employment percentage? A property-management company in the area should have these aggregated.
- How much new for-sale + rental construction is in the pipeline within 1–3 miles? Heavy new supply typically softens prices + rents 12–24 months out; constrained supply supports both.
Investment metrics
- 1% rule
- 2.90% ✓
- Cap rate
- 26.27%
- Cash-on-cash
- 71.34%
- DSCR
- 4.17
- GRM
- 2.9
CMA / ARV
- ARV (median comp)
- $226,935
- List price
- $63,000
- Delta
- -72.24%
- Verdict
- UNDERPRICED
- Comps
- 20 within 1.0 mi
Show comp detail 12 sales within ~0.75 mi
| Address | Dist | Beds/Ba | Sqft | Sold | Price | $/sf | Match |
|---|---|---|---|---|---|---|---|
| 7202 Old Military Rd | 0.07mi | 3/2.0 | 1,535 (-9%) | 8mo | $210,000 | $137 | 75 |
| 7563 Willard Dr W | 0.53mi | 3/2.0 | 1,584 (-6%) | 2mo | $212,900 | $134 | 63 |
| 5280 Willard Dr N | 0.42mi | 3/2.0 | 1,525 (-10%) | 4mo | $241,566 | $158 | 60 |
| 5219 Willard Dr N | 0.49mi | 4/2.0 (+1) | 1,635 (-3%) | 8mo | $257,232 | $157 | 60 |
| 7611 Heaton Dr | 0.62mi | 4/2.0 (+1) | 1,759 (+4%) | 3mo | $230,000 | $131 | 57 |
| 5275 Willard Dr N | 0.44mi | 4/2.0 (+1) | 1,820 (+8%) | 7mo | $267,346 | $147 | 56 |
| 5235 Willard Dr N | 0.49mi | 4/2.0 (+1) | 1,820 (+8%) | 6mo | $250,246 | $137 | 54 |
| 7575 Kelcey Ct | 0.53mi | 3/2.0 | 1,525 (-10%) | 6mo | $249,232 | $163 | 54 |
| 7560 Kelcey Ct | 0.50mi | 3/2.0 | 1,525 (-10%) | 8mo | $178,000 | $117 | 53 |
| 5420 Helen Dr | 0.51mi | 3/2.0 | 1,460 (-14%) | 6mo | $158,000 | $108 | 48 |
| 7587 Braxton Ct | 0.58mi | 4/2.0 (+1) | 1,820 (+8%) | 10mo | $268,850 | $148 | 47 |
| 7615 Kelcey Ct | 0.58mi | 3/2.0 | 1,454 (-14%) | 9mo | $225,000 | $155 | 42 |
Match score weights: distance 35% · size 25% · config 20% · recency 20%. Top-matched comps best support the ARV.
Projected returns pro-forma
-3.0% appreciation · 3.0% rent growth · sell at horizon
- IRR
- 71.0%
- Equity multiple
- 4.21×
- Total profit
- $56,589
- Equity at exit
- $9,394
- IRR
- 74.9%
- Equity multiple
- 8.67×
- Total profit
- $135,302
- Equity at exit
- $5,447
Cash invested: $17,640 (down + closing). Projections, not guarantees.
Landlord ↔ Tenant lean methodology
- Overall (STATE)
- 90 Strongly Landlord-Friendly
- State Alabama
- 90 Strongly Landlord-Friendly · R+15
- County
- — inherits STATE
- City
- — inherits STATE
ZIP-level market 36582
- Home prices YoY
- -19.1%
- Active inventory
- 250
- Price-to-rent
- 2.9×
Monthly cashflow live
- Estimated rent
- $1,830 medium interval (Pro) →
- Mortgage (P&I)
- −$330
- Tax from tax record
- −$40 /mo · $485/yr
- Insurance
- −$26
- HOA
- −$0
- Vacancy / Maint / Mgmt
- −$384
- Net cashflow
- $1,049
Break-even live
UW: 25.0% down · 7.5% · 30yr · 1.5% tax · 5.0% vac · 8.0% maint · 8.0% mgmt
Financing live
Cash to close
- Down payment
- $15,750
- Closing costs
- $1,890
- Reserves months
- —
- Total cash needed
- —
Loan-product check · same deal, 3 products live
Conventional
25% down · 7.5% · 30yr
- Down + closing
- —
- Monthly P&I
- —
- Monthly cashflow
- —
- DSCR
- —
- Eligible?
- —
Personal DTI + credit; lowest rate.
DSCR
20% down · 8.5% · 30yr
- Down + closing
- —
- Monthly P&I
- —
- Monthly cashflow
- —
- DSCR
- —
- Eligible?
- —
No personal income docs; deal must DSCR.
Hard money
10% down · 12.0% · 12mo
- Down + closing
- —
- Monthly P&I
- —
- Monthly cashflow
- —
- DSCR
- —
- Eligible?
- —
Short-term bridge; refi at stabilization.
Rent comps 2 comps
| Address | Beds | Baths | Sqft | Rent | $/sqft | DOM | Units | Dist |
|---|---|---|---|---|---|---|---|---|
| 7669 Willard Ct Theodore, AL | 3.0 | 2.0 | 1475 | $1,700 | $1.15 | 14d | 1 | 0.64mi |
| 5831 Belle Terrace Dr Theodore, AL | 3.0 | 1.5 | 1485 | $1,550 | $1.04 | 44d | 1 | 1.09mi |
Listing history 23 events
-
2026-06-18days on market $63,000 Active 69 DOM
-
2026-06-17days on market $63,000 Active 68 DOM
-
2026-06-16days on market $63,000 Active 67 DOM
-
2026-06-15days on market $63,000 Active 66 DOM
-
2026-06-14days on market $63,000 Active 64 DOM
-
2026-06-13days on market $63,000 Active 63 DOM
-
2026-06-10days on market $63,000 Active 61 DOM
-
2026-06-09days on market $63,000 Active 60 DOM
-
2026-06-08days on market $63,000 Active 59 DOM
-
2026-06-07days on market $63,000 Active 58 DOM
-
2026-06-05days on market $63,000 Active 55 DOM
-
2026-06-03pricedays on market $63,000 Active 54 DOM
-
2026-06-02days on market $68,000 Active 53 DOM
-
2026-06-01days on market $68,000 Active 52 DOM
-
2026-05-31days on market $68,000 Active 51 DOM
-
2026-05-30days on market $68,000 Active 50 DOM
-
2026-04-25price $69,999 529-char remark
Show marketing remark (588 chars)
* Cash only property. * 3 bedrooms, 2.5 baths, and over 1,600 square feet all for $73,000. Two-story layout with a family room open to the kitchen. Primary bedroom with private bath on the main level, along with a half bath off the hallway and a separate formal living room at the front. Upstairs features two bedrooms connected by a Jack and Jill bathroom, each with private access. Large rear deck. Per seller, hot water is 2 years old. Schedule a showing with your favorite realtor today! * More photos available upon request * . Buyer to verify all information during due diligence.
-
2026-04-25price $69,999 588-char remark
Show marketing remark (588 chars)
* Cash only property. * 3 bedrooms, 2.5 baths, and over 1,600 square feet all for $73,000. Two-story layout with a family room open to the kitchen. Primary bedroom with private bath on the main level, along with a half bath off the hallway and a separate formal living room at the front. Upstairs features two bedrooms connected by a Jack and Jill bathroom, each with private access. Large rear deck. Per seller, hot water is 2 years old. Schedule a showing with your favorite realtor today! * More photos available upon request * . Buyer to verify all information during due diligence.
-
2026-04-10$73,000 Active 529-char remark
Show marketing remark (588 chars)
* Cash only property. * 3 bedrooms, 2.5 baths, and over 1,600 square feet all for $73,000. Two-story layout with a family room open to the kitchen. Primary bedroom with private bath on the main level, along with a half bath off the hallway and a separate formal living room at the front. Upstairs features two bedrooms connected by a Jack and Jill bathroom, each with private access. Large rear deck. Per seller, hot water is 2 years old. Schedule a showing with your favorite realtor today! * More photos available upon request * . Buyer to verify all information during due diligence.
-
2026-04-10$73,000 Active 588-char remark
Show marketing remark (588 chars)
* Cash only property. * 3 bedrooms, 2.5 baths, and over 1,600 square feet all for $73,000. Two-story layout with a family room open to the kitchen. Primary bedroom with private bath on the main level, along with a half bath off the hallway and a separate formal living room at the front. Upstairs features two bedrooms connected by a Jack and Jill bathroom, each with private access. Large rear deck. Per seller, hot water is 2 years old. Schedule a showing with your favorite realtor today! * More photos available upon request * . Buyer to verify all information during due diligence.
-
2025-10-08$99,000 Active
-
2022-05-11soldstatus $69,400
-
2022-05-06soldstatus $69,400
ⓘ Source: listings_history table (triggers on properties + properties_extension) + one-shot
backfill from property_details.listing_events for pre-trigger history.
Tax reassessment forecast AL · Resets to sale price
- Current annual tax
- $485 · $40/mo
- Projected year-2 tax
- $485 · $40/mo
- Expected delta
- $0/yr ($0/mo · 0.0%)
ⓘ Screening estimate from a state-policy table — verify with the county assessor before closing.
Climate risk First Street
- Flood 1/10 Low FEMA zone X (unshaded) · 0% chance over 30 yrs
- Wildfire 5/10 Major
- Heat 10/10 Extreme 7 d/yr ≥105°F today · 22 d/yr by 30 yrs out
- Wind 9/10 Extreme 99% chance of damaging wind over 30 yrs
- Air quality 2/10 Low 1 unhealthy d/yr today · 1 by 30 yrs out
Nearby sold comps map
Loading sold comps map…
Walkable amenities ~0.75 mi
Loading nearby amenities…
Taxation est. · year 1
- Rental income
- $21,962
- − Mortgage interest
- −$3,529
- − Property taxes
- −$485
- − Insurance
- −$315
- − Repairs & maintenance
- −$1,757
- − Management
- −$1,757
- − Depreciation
- −$1,833
- Taxable income
- $12,286
- Est. tax owed @ 24.0%
- −$2,949
- After-tax cash flow
- $9,636/yr
For passive investors: Depreciation is non-cash, so a rental often shows a tax loss while cash-flowing — sheltering income. Rental losses are passive: they offset passive income freely, and up to $25,000/yr can offset ordinary (W-2) income if you actively participate and your MAGI is under $100k (phasing out to $0 by $150k); unused losses carry forward. On sale, claimed depreciation is recaptured at up to 25%, and gains may owe capital-gains tax (a 1031 exchange can defer both). Figures are a year-1 estimate at your 24.0% rate — not tax advice; consult a CPA.
Schools (NCES district)
- District
- Mobile County
- NCES district ID
- 0102370
- Math proficiency
- 15% ▼ -28.00%
- Reading proficiency
- 39% ▬ 0.00%
- Median HH income
- $42,455
- Composite
- 22.9/100
- National rank
- #8002
- State rank
- #81 of 129 in AL
Livability — Mobile
- Score
- 75/100
- State rank
- #20
- US rank
- #4262
Category grades
Schools grade is shown separately in the Schools card above.
Census & demographics
- Census place
- Mobile, AL
- County
- Mobile County · 246,577 people
- City population
- 205,729
- Metro
- Mobile, AL
- Population (ZIP)
- 23,705
- Household income
- $64,763
- Rent vs Own
- Severe rent burden
- 431.0
Population outlook (Mobile County) Hauer SSP2
- Today (2025)
- 415,303 people
- By 2030
- 411,755 · -0.9%
- By 2040
- 399,670 · -3.8%
- By 2050
- 382,616 · -7.9%
- By 2075
- 337,353 · -18.8%
- By 2100
- 283,391 · -31.8%
Race, ethnicity, and origin ACS 2023
- Neighborhood character
- Predominantly White (73%)
- Race & ethnicity
- White 73% Black 18% Two or more races 4% Hispanic / Latino 3% Asian 2%
- Common ancestry
- Slovak 3% Serbian 2% Lithuanian 2%
- Foreign-born
- 3% · Canada, Vietnam
- Languages at home
- 95% English-only · Spanish 3% Vietnamese 1%
Political lean MEDSL · Mobile
- 2024 margin
- R (+16.4) · D 41.3% · R 57.7%
- 2008→2024 swing
- -7.7pp toward R · 2008: -8.7pp · 2024: -16.4pp
- All cycles
- 2024: R+16.4 2020: R+11.9 2016: R+13.9 2012: R+9.3 2008: R+8.7
Not yet ingested
- Civics
- —
Market trends
- HPI YoY
- ▼ -49.61%
- Current HPI
- 209.7621
- Rent YoY
- —
- Metro
- Mobile, AL
- State GDP YoY
- ▲ 2.94%
- F500 in state
- 4
Industry mix (Fortune 500 HQ in AL)
| Industry | F500 HQs | Revenue |
|---|---|---|
| Financial Services | 1 | $8B |
|
||
| Healthcare | 1 | $5B |
|
||
Price history
+0.9% since first listed7 events — show timeline
- 2026-04-25 Price Changed $69,999 GCMLS AL
- 2026-04-25 Price Changed $69,999 BCAR
- 2026-04-10 Listed $73,000 GCMLS AL
- 2026-04-10 Listed $73,000 BCAR
- 2025-10-08 Listed $99,000 BCAR
- 2022-05-11 Sold (Public Records) $69,400 Public Records
- 2022-05-06 Sold (MLS) $69,400 GCMLS AL
Property tax history
+2.7%/yrLatest (2025): $485 · +7.9% YoY. Source: county tax records.
Cash-flow waterfall
monthlySold comps — $/sqft
last 12 mo · ≤1 miLoading sold comps…