 Multi-family
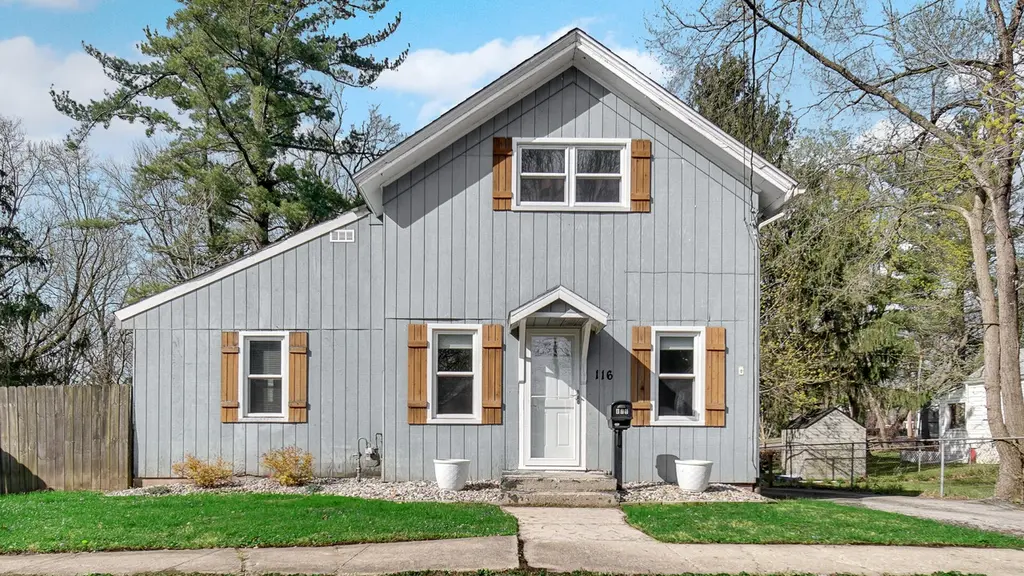
116 Carter St · La Porte, IN
Flood risk 1/10 · Minimal
- FEMA flood zone
- X (unshaded)
- Chance of flooding over 30 yrs
- 0.0%
- Est. flood insurance / yr
- $473 – $860
Fire risk 1/10 · Minimal
- Est. fire insurance / yr
- $717 – $1,331
Heat risk 2/10 · Minimal
- Hot days now (above 99°F)
- 7 days/yr
- Hot days in 30 yrs
- 15 days/yr
Wind risk 2/10 · Minimal
- Chance of severe wind over 30 yrs
- —
Air-quality risk 2/10 · Minimal
- Unhealthy air days now
- 2 days/yr
- Unhealthy air days in 30 yrs
- 2 days/yr
Risk factors via First Street. Map © Google.
Why this score? — see what drove the C+ grade
The composite is a weighted blend of 9 inputs, each scored 0–100. Each bar is that input's sub-score; the figure is the points it added to the 100-point composite (weight × sub-score).
- Cash flow +30.0/30.0
- DSCR +10.0/10.0
- 1% rule +8.0/10.0
- Livability +3.7/5.0
- Schools +3.5/10.0
- Rent growth +2.5/5.0
- Condition / age +2.5/5.0
- ARV discount +1.9/15.0
- Appreciation +0.0/10.0
$169,900
🖨 Deal sheet (PDF) 📄 Offer letter ✓ Due diligence
Multi-family units
County records classify this as Multi-Family (2-4 Unit). Listing-text estimate: 1 unit. estimate disagrees with records
Listing remarks
Neat and Clean and ready to sell !! This unique home has been very well cared for with 2 nice size bedrooms on the main level and a master type suite on the upper level. 2 full baths and a laundry on the main level , The kitchen offers good cabinet and counter top space with new appliances and the dining room is the perfect place to gather for sharing our meal together. The lot is 55x150 and great for children to play, gardeners to plant spacious plots of veggies & flowers and folks just to picnic and relax in your own back yard. Easy access to schools, shopping, lakes and downtown, library within walking distance. All of this with a price that is amazingly reasonable !! Come see bef
Key facts
- Spacious plots
- Unique home
- New appliances
Tags
Property features AI
Finance
- Other: Currently tenant-occupied
Exterior
- Parking: Garage with garage door opener (garage faces rear); Off-street parking; Asphalt and other parking surfaces; 1 garage space
- Security: Smoke detectors; Carbon monoxide detectors
- Utilities: Public water; Public sewer; Natural gas connected; Electricity connected with 100 amp service; Underground utilities
- Home design: One-and-one-half story home; Built in 1927
- Construction: Wood siding; Shingle roof; Full basement (unfinished)
- Exterior features: Private fenced backyard; Back yard fencing; Covered front porch, porch and deck; Storage; Rain gutters; City view
Interior
- Kitchen: Gas range; Dishwasher; Refrigerator; Gas water heater
- Bedrooms: Primary bedroom; Bedroom 2; Bedroom 3
- Flooring: Hardwood; Carpet
- Bathrooms: 2 full bathrooms
- Heating & cooling: Forced air heating (natural gas); Central air conditioning
- Interior features: Ceiling fans; Open floor plan; Laminate countertops; Full unfinished walk-out basement with additional storage; Insulated windows and storm windows
- Laundry & utility: Main-level laundry room; Washer; Dryer
Neighborhood map
What this means for you Summary
Snapshot
- This is a 3-bed/2.0-bath multifamily listed at $170k.
Deal economics
- At list price, monthly cash flow is $705 ($8k/yr) — positive.
- The deal already cash-flows at list — no discount required.
- Meets the 1% rule at list price ($2k rent vs $170k).
- Cap rate 11.3% vs local median 3.5% in La Porte — top-decile yield for the area; either an underpriced asset or a hidden risk that comps aren't pricing in. Stress-test before assuming the spread holds.
Location & tenants
- Location reads 74/100 on livability (#81 in IN, #4,852 nationally) — a middle-class / working-renter tenant base. Strengths: amenities A+, cost of living A+, housing A+; Watch: schools C-, commute F, employment F.
- Laporte Community School Corporation (urban): math 37% / reading 44% proficiency, ranked #139 of 301 in IN (top 46%) — families likely to look elsewhere, expect single-tenant / working-renter base with shorter leases.
- Market conditions: 261 active listings in the ZIP; 3 comparable units currently listed for rent nearby; rentals lingering (median 45d on market — plan ~5-8 weeks vacancy on turnover, expect pricing pressure); 100% of comp listings sitting > 30 days — soft ceiling on asking rent; 216 units permitted in LaPorte County in 2024 (75 in 5+ unit buildings).
- This rent runs 36% of the median local income ($74k/yr) — at the standard rent-burdened threshold; future hikes will face affordability resistance.
Forward outlook
- Local home prices are declining (-3.0%/yr); year-one equity from $1k of loan paydown is wiped out by about $5k of value loss. Plan a longer hold.
- LaPorte County population projected to shrink 7% by 2050 — rents likely to lag national; underwrite the cash flow, not the appreciation.
- At projected returns (-3.0% appreciation + 3.0% rent growth), your $48k cash investment doubles in ~7 years — after that, you're playing with house money.
Negotiation context
- Only 4 days on market — expect competitive offers; lowballing is unlikely to land.
- 3 sale attempts since 19y ago with the ask held roughly flat each time — persistent listings suggest the price (not the market) is what's stuck; bring a comps-based counter.
Risks & watch-outs
- Watch-outs: built in 1927 — expect roof / HVAC / electrical / plumbing capex.
Questions for the listing agent
- Built in 1927 — when were the roof, HVAC, electrical panel, plumbing, and water heater last replaced?
- Is there a deadline driving the sale (1031 exchange, divorce, estate, relocation)? That informs how much negotiation room exists.
- What's the average days-on-market for RENTAL listings here right now (not sales)? A rising rental-DOM trend means longer vacancies and softer asking-rent achievability than the comps imply.
- What's the recent tenant-quality profile in this submarket — average credit score on applications, eviction rate, late-payment / NSF rate, and stable-employment percentage? A property-management company in the area should have these aggregated.
- How much new apartment / multifamily construction is in the pipeline within 1–3 miles? Heavy new supply (>2% of stock underway) typically softens rents 12–24 months out; light construction supports rent growth.
Investment metrics
- 1% rule
- 1.30% ✓
- Cap rate
- 11.27%
- Cash-on-cash
- 17.78%
- DSCR
- 1.79
- GRM
- 6.4
CMA / ARV
- ARV (on-the-fly)
- $151,126
- Comps found
- 2
Show comp detail 2 sales within ~0.75 mi
| Address | Dist | Beds/Ba | Sqft | Sold | Price | $/sf | Match |
|---|---|---|---|---|---|---|---|
| 1342-1344 Kingsporte Ln | 0.67mi | 4/2.0 (+1) | 1,392 (-11%) | 5mo | $134,900 | $97 | 42 |
| 1346 Federal Ave #1318 | 0.62mi | 4/2.0 (+1) | 1,392 (-11%) | 9mo | $52,000 | $37 | 41 |
Match score weights: distance 35% · size 25% · config 20% · recency 20%. Top-matched comps best support the ARV.
Projected returns pro-forma
-3.0% appreciation · 3.0% rent growth · sell at horizon
- IRR
- 9.3%
- Equity multiple
- 1.36×
- Total profit
- $17,325
- Equity at exit
- $25,333
- IRR
- 18.4%
- Equity multiple
- 2.53×
- Total profit
- $72,717
- Equity at exit
- $14,690
Cash invested: $47,572 (down + closing). Projections, not guarantees.
Landlord ↔ Tenant lean methodology
- Overall (STATE)
- 90 Strongly Landlord-Friendly
- State Indiana
- 90 Strongly Landlord-Friendly · R+11
- County
- — inherits STATE
- City
- — inherits STATE
ZIP-level market 46350
- Active inventory
- 261
- Price-to-rent
- 12.8×
Monthly cashflow live
- Estimated rent
- $2,215 medium interval (Pro) →
- Mortgage (P&I)
- −$891
- Tax from tax record
- −$83 /mo · $997/yr
- Insurance
- −$71
- HOA
- −$0
- Vacancy / Maint / Mgmt
- −$465
- Net cashflow
- $705
Break-even live
Sensitivity live
| Price | -10% $801 | -5% $753 | +0% $705 | +5% $657 | +10% $609 |
|---|---|---|---|---|---|
| Rent | -10% $530 | -5% $618 | +0% $705 | +5% $792 | +10% $880 |
| Rate | -1.0pp $791 | -0.5pp $748 | base $705 | +0.5pp $661 | +1.0pp $616 |
2-unit breakdown (identical units grouped — click to expand)
| Units | Beds | Baths | Est. rent |
|---|---|---|---|
| 2× units | 2 | 1 | $2,214 |
| #1 | 2 | 1 | $1,107 |
| #2 | 2 | 1 | $1,107 |
| Total (2 units) | $2,215 | ||
UW: 25.0% down · 7.5% · 30yr · 1.5% tax · 5.0% vac · 8.0% maint · 8.0% mgmt
Financing live
Cash to close
- Down payment
- $42,475
- Closing costs
- $5,097
- Reserves months
- —
- Total cash needed
- —
Loan-product check · same deal, 3 products live
Conventional
25% down · 7.5% · 30yr
- Down + closing
- —
- Monthly P&I
- —
- Monthly cashflow
- —
- DSCR
- —
- Eligible?
- —
Personal DTI + credit; lowest rate.
DSCR
20% down · 8.5% · 30yr
- Down + closing
- —
- Monthly P&I
- —
- Monthly cashflow
- —
- DSCR
- —
- Eligible?
- —
No personal income docs; deal must DSCR.
Hard money
10% down · 12.0% · 12mo
- Down + closing
- —
- Monthly P&I
- —
- Monthly cashflow
- —
- DSCR
- —
- Eligible?
- —
Short-term bridge; refi at stabilization.
Rent comps 3 comps
| Address | Beds | Baths | Sqft | Rent | $/sqft | DOM | Units | Dist |
|---|---|---|---|---|---|---|---|---|
| 400 Hiawatha Ave La Porte, IN | 1.0–2.0 | 1.0–1.5 | 909 | $1,204 | $1.32 | 45d | 2 | 0.15mi |
| 1105 Woodward St La Porte, IN | 3.0 | 1.0 | 1142 | $1,495 | $1.31 | 45d | 1 | 0.49mi |
| 207 New York St La Porte, IN | 2.0 | 1.0 | 1600 | $3,200 | $2.00 | 45d | 1 | 1.16mi |
Listing history 6 events
-
2026-05-08status Pending
-
2026-05-06status Active
-
2026-04-17status Pending
-
2026-04-13$169,900 Active
-
2008-12-16historical
-
2007-09-27$92,500
ⓘ Source: listings_history table (triggers on properties + properties_extension) + one-shot
backfill from property_details.listing_events for pre-trigger history.
Tax reassessment forecast IN · Partial reset (capped growth)
- Current annual tax
- $997 · $83/mo
- Projected year-2 tax
- $1,221 · $102/mo
- Expected delta
- +$224/yr (+$19/mo · 22.4%)
ⓘ Screening estimate from a state-policy table — verify with the county assessor before closing.
Climate risk First Street
- Flood 1/10 Low FEMA zone X (unshaded) · 0% chance over 30 yrs
- Wildfire 1/10 Low
- Heat 2/10 Low 7 d/yr ≥99°F today · 15 d/yr by 30 yrs out
- Wind 2/10 Low
- Air quality 2/10 Low 2 unhealthy d/yr today · 2 by 30 yrs out
Nearby sold comps map
Loading sold comps map…
Walkable amenities ~0.75 mi
Loading nearby amenities…
Taxation est. · year 1
- Rental income
- $26,580
- − Mortgage interest
- −$9,517
- − Property taxes
- −$997
- − Insurance
- −$850
- − Repairs & maintenance
- −$2,126
- − Management
- −$2,126
- − Depreciation
- −$4,943
- Taxable income
- $6,021
- Est. tax owed @ 24.0%
- −$1,445
- After-tax cash flow
- $7,015/yr
For passive investors: Depreciation is non-cash, so a rental often shows a tax loss while cash-flowing — sheltering income. Rental losses are passive: they offset passive income freely, and up to $25,000/yr can offset ordinary (W-2) income if you actively participate and your MAGI is under $100k (phasing out to $0 by $150k); unused losses carry forward. On sale, claimed depreciation is recaptured at up to 25%, and gains may owe capital-gains tax (a 1031 exchange can defer both). Figures are a year-1 estimate at your 24.0% rate — not tax advice; consult a CPA.
Schools (NCES district)
- District
- Laporte Community School Corporation
- NCES district ID
- 1805580
- Math proficiency
- 37% ▼ -13.00%
- Reading proficiency
- 44% ▼ -11.00%
- Median HH income
- $46,761
- Composite
- 34.58/100
- National rank
- #5162
- State rank
- #139 of 301 in IN
Livability — La Porte
- Score
- 74/100
- State rank
- #81
- US rank
- #4852
Category grades
Schools grade is shown separately in the Schools card above.
Census & demographics
- Census place
- La Porte, IN
- County
- La Porte County · 88,580 people
- City population
- 44,763
- Metro
- Michigan City-La Porte, IN
- Population (ZIP)
- 44,763
- Household income
- $74,307
- Rent vs Own
- Severe rent burden
- 835.0
Population outlook (LaPorte County) Hauer SSP2
- Today (2025)
- 109,757 people
- By 2030
- 108,288 · -1.3%
- By 2040
- 105,070 · -4.3%
- By 2050
- 102,330 · -6.8%
- By 2075
- 97,009 · -11.6%
- By 2100
- 86,459 · -21.2%
Race, ethnicity, and origin ACS 2023
- Neighborhood character
- Predominantly White (82%)
- Race & ethnicity
- White 82% Two or more races 8% Hispanic / Latino 8% Black 3%
- Hispanic origin (detail)
- Mexican 6%
- Common ancestry
- Romanian 11% Iranian 3% Italian 2%
- Foreign-born
- 4% · Canada
- Languages at home
- 93% English-only · Spanish 4% Russian/Polish/Slavic 1% German/W. Germanic 1%
Political lean MEDSL · LaPorte
- 2024 margin
- R (+14.1) · D 42.1% · R 56.2% · Other 1.7%
- 2008→2024 swing
- -19.1pp toward R · 2008: 5.0pp · 2024: -14.1pp
- All cycles
- 2024: R+14.1 2020: R+7.2 2016: R+6.4 2012: D+12.6 2008: D+5.0
Not yet ingested
- Civics
- —
Market trends
- HPI YoY
- ▼ -142.94%
- Current HPI
- 209.2564
- Rent YoY
- —
- Metro
- Michigan City-La Porte, IN
- State GDP YoY
- ▲ 2.90%
- F500 in state
- 18
Industry mix (Fortune 500 HQ in IN)
| Industry | F500 HQs | Revenue |
|---|---|---|
| Industrial Machinery | 2 | $37B |
|
||
| Healthcare | 1 | $177B |
|
||
| Pharmaceuticals | 1 | $45B |
|
||
| Metals / Steel | 1 | $18B |
|
||
| Agriculture | 1 | $17B |
|
||
| Packaging | 1 | $12B |
|
||
Price history
+83.7% since first listed6 events — show timeline
- 2026-05-08 Pending — NIRA MLS as Distributed by MLS Grid
- 2026-05-06 Relisted — NIRA MLS as Distributed by MLS Grid
- 2026-04-17 Pending — NIRA MLS as Distributed by MLS Grid
- 2026-04-13 Listed $169,900 NIRA MLS as Distributed by MLS Grid
- 2008-12-16 Listing Removed — NIRA MLS as Distributed by MLS Grid
- 2007-09-27 Listed $92,500 NIRA MLS as Distributed by MLS Grid
Property tax history
+5.1%/yrLatest (2024): $997 · +0.0% YoY. Source: county tax records.
Cash-flow waterfall
monthlySold comps — $/sqft
last 12 mo · ≤1 miLoading sold comps…