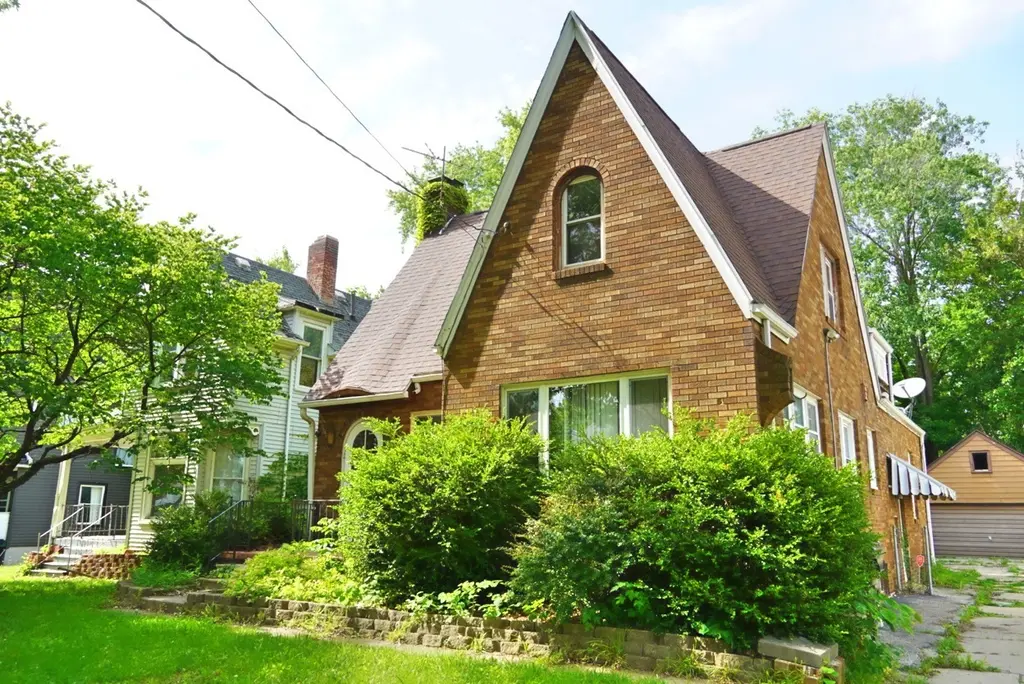
113 E Arcadia Ave · Peoria, IL
Flood risk 1/10 · Minimal
- FEMA flood zone
- X
- Chance of flooding over 30 yrs
- 0.0%
- Est. flood insurance / yr
- $473 – $860
Fire risk 1/10 · Minimal
- Est. fire insurance / yr
- $804 – $1,492
Heat risk 3/10 · Minor
- Hot days now (above 105°F)
- 7 days/yr
- Hot days in 30 yrs
- 18 days/yr
Wind risk 2/10 · Minimal
- Chance of severe wind over 30 yrs
- 1.0%
Air-quality risk 3/10 · Minor
- Unhealthy air days now
- 1 days/yr
- Unhealthy air days in 30 yrs
- 3 days/yr
Risk factors via First Street. Map © Google.
Why this score? — see what drove the C- grade
The composite is a weighted blend of 9 inputs, each scored 0–100. Each bar is that input's sub-score; the figure is the points it added to the 100-point composite (weight × sub-score).
- Cash flow +21.7/30.0
- DSCR +6.9/10.0
- ARV discount +6.3/15.0
- 1% rule +5.7/10.0
- Livability +3.7/5.0
- Rent growth +3.4/5.0
- Condition / age +2.5/5.0
- Schools +1.1/10.0
- Appreciation +0.0/10.0
$105,000
🖨 Deal sheet 📄 Offer letter ✓ Due diligence
Listing remarks
This exquisite home is a pure classic example of Tudor Revival architecture, a style that was immensely popular in American suburbs during the 1920s and 1930s. Has the beautiful brick masonry which is waiting to be showcased! Custom arch doorways which gives a beautiful decorative element to the home! Unlike other custom built homes, this home offers an asymmetrical layout. This residence features 3 spacious bedrooms, 1 bathroom, a basement, and a detached garage. Sold as is. Grab while you can!
Key facts
- Asymmetrical layout
- Brick masonry
- Custom arch doorways
Tags
Property features AI
Finance
- HOA & community: No master association fee required
Exterior
- Parking: Detached garage with 2 garage spaces (2 total parking spaces)
- Utilities: Public water; Public sewer; Cable available
- Home design: Detached single-family home; 1.5-story design; Fee simple ownership; Built more than 90 years ago; Not rebuilt or rehabilitated
- Construction: Brick construction
- Exterior features: Porch; Fenced yard; Level lot (approx. 50 x 135)
Interior
- Kitchen: Kitchen with eating area / table space
- Bedrooms: Three bedrooms (two main level, primary bedroom on second level)
- Flooring: Hardwood in several rooms (including dining room and primary bedroom); Tile in kitchen; Carpet in some bedrooms and living room
- Bathrooms: One full bathroom
- Heating & cooling: Steam heat provided by natural gas
- Interior features: Six total rooms; Separate dining room; Unfinished full basement
- Laundry & utility: Laundry room; Gas water heater
Neighborhood map
What this means for you Summary
Snapshot
- This is a 3-bed/1.0-bath single-family listed at $105k.
Deal economics
- At list price, monthly cash flow is $162 ($2k/yr) — positive.
- The deal already cash-flows at list — no discount required.
- Meets the 1% rule at list price ($1k rent vs $105k).
- Recommended offer: $103k (1.5% below list) — sets the bar for market timing.
- Cap rate 8.1% vs local median 5.6% in Peoria — top-decile yield for the area; either an underpriced asset or a hidden risk that comps aren't pricing in. Stress-test before assuming the spread holds.
Location & tenants
- Location reads 73/100 on livability (#270 in IL) — a middle-class / working-renter tenant base. Strengths: commute A+, cost of living A+, housing A+; Watch: employment D+, schools F, crime F.
- Peoria SD 150 (urban): math 11% / reading 14% proficiency, ranked #554 of 620 in IL (top 89%) — low school quality limits family demand, transient renter base, plan for 1-2y turnover; 70% free/reduced lunch — lower-income household profile, screen leases tightly.
- Market conditions: Rents rising (+3.5%/yr); 104 active listings in the ZIP; 5 comparable units currently listed for rent nearby; rentals leasing fast (median 13d on market — plan ~1-2 weeks tenant-placement turnaround); lower-income renter base — watch delinquency; 73 units permitted in Peoria County in 2024 (0 in 5+ unit buildings).
- This rent runs 33% of the median local income ($42k/yr) — at the standard rent-burdened threshold; future hikes will face affordability resistance.
Forward outlook
- Local home prices are declining (-3.0%/yr); year-one equity from $726 of loan paydown is wiped out by about $3k of value loss. Plan a longer hold.
- Peoria County population projected at -11% by 2050 — secular population decline; favor cash flow + early exit over multi-decade hold.
Negotiation context
- It's been on market 20 days — a 2% lower offer ($103k) is reasonable based on typical stale-listing flexibility.
- 3 sale attempts since 25y ago; this cycle's ask has dropped $10k (9%) from the opening price — seller is motivated, your offer sets the floor, not the list.
- Current owner paid $40k; list at $105k implies a 162% gain — meaningful room to come down on a strong offer.
Risks & watch-outs
- Watch-outs: built in 1935 — expect roof / HVAC / electrical / plumbing capex.
Questions for the listing agent
- Built in 1935 — when were the roof, HVAC, electrical panel, plumbing, and water heater last replaced?
- Is there a deadline driving the sale (1031 exchange, divorce, estate, relocation)? That informs how much negotiation room exists.
- Schools are F-rated, which usually means shorter tenancies and higher turnover. Who's the typical renter profile here, and what's been the actual vacancy rate?
- Crime grade is F in this area — have there been break-ins, vandalism, or insurance claims at this property in the last 3 years? What carrier currently insures it and at what premium?
- What's the average days-on-market for RENTAL listings here right now (not sales)? A rising rental-DOM trend means longer vacancies and softer asking-rent achievability than the comps imply.
- What's the recent tenant-quality profile in this submarket — average credit score on applications, eviction rate, late-payment / NSF rate, and stable-employment percentage? A property-management company in the area should have these aggregated.
- How much new for-sale + rental construction is in the pipeline within 1–3 miles? Heavy new supply typically softens prices + rents 12–24 months out; constrained supply supports both.
Investment metrics
- 1% rule
- 1.07% ✓
- Cap rate
- 8.15%
- Cash-on-cash
- 6.63%
- DSCR
- 1.29
- GRM
- 7.8
CMA / ARV
- ARV (on-the-fly)
- $102,350
- Comps found
- 12
Show comp detail 12 sales within ~0.75 mi
| Address | Dist | Beds/Ba | Sqft | Sold | Price | $/sf | Match |
|---|---|---|---|---|---|---|---|
| 2407 N Central Ave | 0.67mi | 3/1.0 | 2,212 (-1%) | 6mo | $53,000 | $24 | 63 |
| 305 W Virginia Ave | 0.35mi | 4/1.0 (+1) | 2,443 (+10%) | 1mo | $33,500 | $14 | 62 |
| 502 W Melbourne Ave | 0.70mi | 3/1.5 | 2,132 (-4%) | 6mo | $185,000 | $87 | 53 |
| 408 W Forrest Hill Ave | 0.72mi | 3/2.5 | 2,283 (+3%) | 4mo | $230,000 | $101 | 52 |
| 201 W Hanssler Pl | 0.38mi | 3/1.5 | 1,900 (-15%) | 4mo | $159,500 | $84 | 52 |
| 714 W Meadows Pl | 0.65mi | 3/2.0 | 2,416 (+9%) | 0mo | $100,000 | $41 | 51 |
| 2716 N Bootz Ave | 0.53mi | 3/2.0 | 1,990 (-11%) | 4mo | $91,000 | $46 | 50 |
| 2304 N Ellis Ave | 0.49mi | 3/1.0 | 1,907 (-14%) | 4mo | $76,000 | $40 | 50 |
| 803 W Meadows Pl | 0.68mi | 4/1.5 (+1) | 1,924 (-14%) | 1mo | $165,000 | $86 | 38 |
| 2403 N Central Ave | 0.66mi | 4/3.0 (+1) | 2,512 (+13%) | 4mo | $69,000 | $27 | 32 |
| 807 W Mcclure Ave | 0.68mi | 4/2.0 (+1) | 1,892 (-15%) | 7mo | $80,500 | $43 | 28 |
| 3109 N Bigelow St | 0.71mi | 2/2.5 (-1) | 1,902 (-14%) | 4mo | $190,000 | $100 | 28 |
Match score weights: distance 35% · size 25% · config 20% · recency 20%. Top-matched comps best support the ARV.
Projected returns pro-forma
-3.0% appreciation · 3.49% rent growth · sell at horizon
- IRR
- -5.5%
- Equity multiple
- 0.79×
- Total profit
- $-6,097
- Equity at exit
- $15,656
- IRR
- 4.7%
- Equity multiple
- 1.35×
- Total profit
- $10,399
- Equity at exit
- $9,078
Cash invested: $29,400 (down + closing). Projections, not guarantees.
Landlord ↔ Tenant lean methodology
- Overall (STATE)
- 43 Moderately Tenant-Leaning
- State Illinois
- 43 Moderately Tenant-Leaning · D+7
- County
- — inherits STATE
- City
- — inherits STATE
ZIP-level market 61603
- Home prices YoY
- -31.8%
- Rents YoY
- 3.5%
- Active inventory
- 104
- Price-to-rent
- 7.8×
Monthly cashflow live
- Estimated rent
- $1,129 high interval (Pro) →
- Mortgage (P&I)
- −$551
- Tax from tax record
- −$135 /mo · $1,618/yr
- Insurance
- −$44
- HOA
- −$0
- Vacancy / Maint / Mgmt
- −$237
- Net cashflow
- $162
Break-even live
UW: 25.0% down · 7.5% · 30yr · 1.5% tax · 5.0% vac · 8.0% maint · 8.0% mgmt
Financing live
Cash to close
- Down payment
- $26,250
- Closing costs
- $3,150
- Reserves months
- —
- Total cash needed
- —
Loan-product check · same deal, 3 products live
Conventional
25% down · 7.5% · 30yr
- Down + closing
- —
- Monthly P&I
- —
- Monthly cashflow
- —
- DSCR
- —
- Eligible?
- —
Personal DTI + credit; lowest rate.
DSCR
20% down · 8.5% · 30yr
- Down + closing
- —
- Monthly P&I
- —
- Monthly cashflow
- —
- DSCR
- —
- Eligible?
- —
No personal income docs; deal must DSCR.
Hard money
10% down · 12.0% · 12mo
- Down + closing
- —
- Monthly P&I
- —
- Monthly cashflow
- —
- DSCR
- —
- Eligible?
- —
Short-term bridge; refi at stabilization.
Rent comps 5 comps
| Address | Beds | Baths | Sqft | Rent | $/sqft | DOM | Units | Dist |
|---|---|---|---|---|---|---|---|---|
| 308 E Archer Ave Peoria, IL | 3.0 | 1.0 | 1444 | $950 | $0.66 | 13d | 1 | 0.12mi |
| 1806 N Peoria Ave Peoria, IL | 4.0 | 1.5 | 1668 | $894 | $0.54 | 13d | 1 | 0.50mi |
| 913 W McClure Ave Peoria, IL | 3.0 | 1.0 | 1400 | $1,200 | $0.86 | 20d | 1 | 0.77mi |
| 501 W Columbia Ter Unit 3 Peoria, IL | 3.0 | 1.0 | 1500 | $1,400 | $0.93 | 43d | 1 | 0.96mi |
| 1413 W Gilbert Ave Peoria, IL | 2.0 | 2.0 | 1428 | $1,500 | $1.05 | 13d | 1 | 1.24mi |
Listing history 17 events
-
2026-06-19days on market $105,000 Active 20 DOM
-
2026-06-18days on market $105,000 Active 19 DOM
-
2026-06-17days on market $105,000 Active 18 DOM
-
2026-06-16days on market $105,000 Active 17 DOM
-
2026-06-15price $105,000 Active 16 DOM
-
2026-06-15days on market $114,900 Active 16 DOM
-
2026-06-14days on market $114,900 Active 14 DOM
-
2026-06-13days on market $114,900 Active 13 DOM
-
2026-06-10days on market $114,900 Active 11 DOM
-
2026-06-09days on market $114,900 Active 10 DOM
-
2026-06-08days on market $114,900 Active 9 DOM
-
2026-06-07days on market $114,900 Active 8 DOM
-
2026-06-03days on market $114,900 Active 4 DOM
-
2026-06-02days on market $114,900 Active 3 DOM
-
2026-06-01days on market $114,900 Active 2 DOM
-
2026-05-31remarks 500-char remark
-
2026-05-31$114,900 Active 1 DOM
ⓘ Source: listings_history table (triggers on properties + properties_extension) + one-shot
backfill from property_details.listing_events for pre-trigger history.
Tax reassessment forecast IL · Partial reset (capped growth)
- Current annual tax
- $1,618 · $135/mo
- Projected year-2 tax
- $2,001 · $167/mo
- Expected delta
- +$383/yr (+$32/mo · 23.6%)
ⓘ Screening estimate from a state-policy table — verify with the county assessor before closing.
Climate risk First Street
- Flood 1/10 Low FEMA zone X · 0% chance over 30 yrs
- Wildfire 1/10 Low
- Heat 3/10 Moderate 7 d/yr ≥105°F today · 18 d/yr by 30 yrs out
- Wind 2/10 Low 100% chance of damaging wind over 30 yrs
- Air quality 3/10 Moderate 1 unhealthy d/yr today · 3 by 30 yrs out
Nearby sold comps map
Loading sold comps map…
Walkable amenities ~0.75 mi
Loading nearby amenities…
Taxation est. · year 1
- Rental income
- $13,543
- − Mortgage interest
- −$5,882
- − Property taxes
- −$1,618
- − Insurance
- −$525
- − Repairs & maintenance
- −$1,083
- − Management
- −$1,083
- − Depreciation
- −$3,055
- Taxable income
- $297
- Est. tax owed @ 24.0%
- −$71
- After-tax cash flow
- $1,877/yr
For passive investors: Depreciation is non-cash, so a rental often shows a tax loss while cash-flowing — sheltering income. Rental losses are passive: they offset passive income freely, and up to $25,000/yr can offset ordinary (W-2) income if you actively participate and your MAGI is under $100k (phasing out to $0 by $150k); unused losses carry forward. On sale, claimed depreciation is recaptured at up to 25%, and gains may owe capital-gains tax (a 1031 exchange can defer both). Figures are a year-1 estimate at your 24.0% rate — not tax advice; consult a CPA.
Schools (NCES district)
- District
- Peoria SD 150
- NCES district ID
- 1731230
- Math proficiency
- 11% ▼ -5.00%
- Reading proficiency
- 14% ▼ -4.00%
- Median HH income
- $41,951
- Composite
- 10.92/100
- National rank
- #9751
- State rank
- #554 of 620 in IL
Livability — Peoria
- Score
- 73/100
- State rank
- #270
- US rank
- #5096
Category grades
Schools grade is shown separately in the Schools card above.
Census & demographics
- Census place
- Peoria, IL
- County
- Peoria County · 120,495 people
- City population
- 114,670
- Metro
- Peoria, IL
- Population (ZIP)
- 15,356
- Household income
- $41,618
- Rent vs Own
- Severe rent burden
- 849.0
Population outlook (Peoria County) Hauer SSP2
- Today (2025)
- 183,007 people
- By 2030
- 179,643 · -1.8%
- By 2040
- 171,782 · -6.1%
- By 2050
- 163,508 · -10.7%
- By 2075
- 140,178 · -23.4%
- By 2100
- 114,493 · -37.4%
Race, ethnicity, and origin ACS 2023
- Neighborhood character
- Diverse neighborhood (Simpson 0.68)
- Race & ethnicity
- Black 43% White 36% Two or more races 12% Hispanic / Latino 10% Asian 1%
- Hispanic origin (detail)
- Mexican 7%
- Common ancestry
- Italian 2% Slovak 1% Lithuanian 1%
- Foreign-born
- 7% · Canada
- Languages at home
- 91% English-only · Spanish 6% Tagalog/Filipino 1%
Political lean MEDSL · Peoria
- 2024 margin
- Toss-up / Even · D 51.5% · R 46.9% · Other 1.6%
- 2008→2024 swing
- -9.2pp toward R · 2008: 13.9pp · 2024: 4.7pp
- All cycles
- 2024: D+4.7 2020: D+6.3 2016: D+2.8 2012: D+4.4 2008: D+13.9
Not yet ingested
- Civics
- —
Market trends
- HPI YoY
- ▼ -65.98%
- Current HPI
- 141.5343
- Rent YoY
- ▲ 3.49%
- Metro
- Peoria, IL
- State GDP YoY
- ▲ 1.59%
- F500 in state
- 60
Industry mix (Fortune 500 HQ in IL)
| Industry | F500 HQs | Revenue |
|---|---|---|
| Insurance | 4 | $201B |
|
||
| Consumer Goods | 4 | $87B |
|
||
| Industrial Machinery | 3 | $64B |
|
||
| Healthcare | 2 | $55B |
|
||
| Retail / Pharmacy | 1 | $148B |
|
||
| Agriculture / Food | 1 | $86B |
|
||
Price history
+152.5% since first listed9 events — show timeline
- 2026-05-31 Listed $114,900 MRED as Distributed by MLS Grid
- 2021-08-06 Listing Removed — RMLSA as Distributed by MLS Grid
- 2021-08-06 Listing Removed — RMLSA as Distributed by MLS Grid
- 2009-05-14 Sold (Public Records) $40,000 Public Records
- 2009-05-12 Sold (MLS) $40,000 RMLSA as Distributed by MLS Grid
- 2009-03-04 Listed $44,900 RMLSA as Distributed by MLS Grid
- 2001-10-26 Sold (MLS) $62,500 RMLSA as Distributed by MLS Grid
- 2001-10-02 Listed $64,900 RMLSA as Distributed by MLS Grid
- 1999-04-16 Sold (Public Records) $45,500 Public Records
Property tax history
-0.7%/yrLatest (2024): $1,618 · +4.8% YoY. Source: county tax records.
Cash-flow waterfall
monthlySold comps — $/sqft
last 12 mo · ≤1 miLoading sold comps…