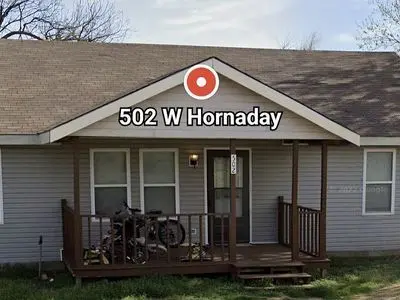
502 W Hornaday · Fletcher, OK
Flood risk No data
- FEMA flood zone
- —
- Chance of flooding over 30 yrs
- —
- Est. flood insurance / yr
- —
Fire risk No data
- Est. fire insurance / yr
- —
Heat risk No data
- Hot days now (above threshold)
- —
- Hot days in 30 yrs
- —
Wind risk No data
- Chance of severe wind over 30 yrs
- —
Air-quality risk No data
- Unhealthy air days now
- —
- Unhealthy air days in 30 yrs
- —
Risk factors via First Street. Map © Google.
Why this score? — see what drove the F grade
The composite is a weighted blend of 9 inputs, each scored 0–100. Each bar is that input's sub-score; the figure is the points it added to the 100-point composite (weight × sub-score).
- Cash flow +9.7/30.0
- Appreciation +7.8/10.0
- Livability +3.2/5.0
- DSCR +2.7/10.0
- Rent growth +2.5/5.0
- Condition / age +2.5/5.0
- 1% rule +1.7/10.0
- Schools +1.6/10.0
- ARV discount +0.0/15.0
$170,000
🖨 Deal sheet 📄 Offer letter ✓ Due diligence
Listing remarks MLS
Lots of potential with this 3 bedroom, 2 bath property in Fletcher. Partially remodeled. Outside in good shape with nearly new roof and vinyl siding. 2 sheds and storm cellar. Thermopane/double pane windows throughout. Sold As Is.
Key facts
- Plenty of storage
- Laundry room
- Large living room
Tags
Neighborhood map
What this means for you Summary
Snapshot
- This is a 3-bed/1.0-bath single-family listed at $170k.
Deal economics
- At list price, monthly cash flow is $-111 ($-1k/yr) — negative.
- To cash-flow at today's rent, offer at most $150k (11.6% below list).
- To meet the 1% rule (rent ≥ 1% of price), the offer needs to be $114k (33.1% below list).
- Recommended offer: $114k (33.1% below list) — sets the bar for 1% rule.
Location & tenants
- Location reads 65/100 on livability (#133 in OK) — a middle-class / working-renter tenant base. Strengths: crime A+, cost of living A+, housing A+; Watch: schools D, amenities F, commute F.
- Fletcher (rural): math 12% / reading 23% proficiency, ranked #189 of 270 in OK (top 70%) — low school quality limits family demand, transient renter base, plan for 1-2y turnover.
- Market conditions: 29 active listings in the ZIP; 133 units permitted in Comanche County in 2024 (0 in 5+ unit buildings).
Forward outlook
- In year one you build about $11k of equity ($1k loan paydown + $10k appreciation (5.7% local appreciation)).
- Comanche County population projected to shrink 3% by 2050 — rents likely to lag national; underwrite the cash flow, not the appreciation.
- By year 4, paydown + projected appreciation supports a ~$37k cash-out refi (75% LTV) — recoverable capital for the next deal without selling this one.
Negotiation context
- Only 1 days on market — expect competitive offers; lowballing is unlikely to land.
- 2 sale attempts since 7y ago with the ask held roughly flat each time — persistent listings suggest the price (not the market) is what's stuck; bring a comps-based counter.
- Current owner paid $53k; list at $170k implies a 221% gain — meaningful room to come down on a strong offer.
Questions for the listing agent
- What do current leases actually rent for vs. the listed asking? Can we see a recent rent roll and the last 12 months of T-12 income?
- Is there a deadline driving the sale (1031 exchange, divorce, estate, relocation)? That informs how much negotiation room exists.
- Schools are D-rated, which usually means shorter tenancies and higher turnover. Who's the typical renter profile here, and what's been the actual vacancy rate?
- The area grade is low — what's the realistic commute time and amenity access for the typical tenant pool here? Any planned neighborhood developments (good or bad) we should know about?
- What's the average days-on-market for RENTAL listings here right now (not sales)? A rising rental-DOM trend means longer vacancies and softer asking-rent achievability than the comps imply.
- What's the recent tenant-quality profile in this submarket — average credit score on applications, eviction rate, late-payment / NSF rate, and stable-employment percentage? A property-management company in the area should have these aggregated.
- How much new for-sale + rental construction is in the pipeline within 1–3 miles? Heavy new supply typically softens prices + rents 12–24 months out; constrained supply supports both.
Investment metrics
- 1% rule
- 0.67% ✗
- Cap rate
- 5.51%
- Cash-on-cash
- -2.81%
- DSCR
- 0.87
- GRM
- 12.5
CMA / ARV
- ARV (on-the-fly)
- $135,978
- Comps found
- 3
Show comp detail 3 sales within ~0.75 mi
| Address | Dist | Beds/Ba | Sqft | Sold | Price | $/sf | Match |
|---|---|---|---|---|---|---|---|
| 303 South Dr | 0.27mi | 2/2.0 (-1) | 1,100 (+6%) | 2mo | $37,888 | $34 | 67 |
| 103 E Cole Ave | 0.38mi | 3/2.0 | 1,000 (-4%) | 11mo | $135,000 | $135 | 63 |
| 414 N East Dr | 0.51mi | 3/1.0 | 900 (-13%) | 8mo | $118,000 | $131 | 48 |
Match score weights: distance 35% · size 25% · config 20% · recency 20%. Top-matched comps best support the ARV.
Projected returns pro-forma
5.65% appreciation · 3.0% rent growth · sell at horizon
- IRR
- 12.2%
- Equity multiple
- 1.81×
- Total profit
- $38,406
- Equity at exit
- $103,153
- IRR
- 13.0%
- Equity multiple
- 3.51×
- Total profit
- $119,356
- Equity at exit
- $183,937
Cash invested: $47,600 (down + closing). Projections, not guarantees.
Landlord ↔ Tenant lean methodology
- Overall (STATE)
- 83 Strongly Landlord-Friendly
- State Oklahoma
- 83 Strongly Landlord-Friendly · R+20
- County
- — inherits STATE
- City
- — inherits STATE
ZIP-level market 73541
- Home prices YoY
- 2.2%
- Active inventory
- 29
- Price-to-rent
- 12.5×
Monthly cashflow live
- Estimated rent
- $1,137 medium interval (Pro) →
- Mortgage (P&I)
- −$891
- Tax from tax record
- −$47 /mo · $568/yr
- Insurance
- −$71
- HOA
- −$0
- Vacancy / Maint / Mgmt
- −$239
- Net cashflow
- $-111
Break-even live
UW: 25.0% down · 7.5% · 30yr · 1.5% tax · 5.0% vac · 8.0% maint · 8.0% mgmt
Financing live
Cash to close
- Down payment
- $42,500
- Closing costs
- $5,100
- Reserves months
- —
- Total cash needed
- —
Loan-product check · same deal, 3 products live
Conventional
25% down · 7.5% · 30yr
- Down + closing
- —
- Monthly P&I
- —
- Monthly cashflow
- —
- DSCR
- —
- Eligible?
- —
Personal DTI + credit; lowest rate.
DSCR
20% down · 8.5% · 30yr
- Down + closing
- —
- Monthly P&I
- —
- Monthly cashflow
- —
- DSCR
- —
- Eligible?
- —
No personal income docs; deal must DSCR.
Hard money
10% down · 12.0% · 12mo
- Down + closing
- —
- Monthly P&I
- —
- Monthly cashflow
- —
- DSCR
- —
- Eligible?
- —
Short-term bridge; refi at stabilization.
Listing history 5 events
-
2026-05-26$170,000 Active
-
2020-02-10soldstatus $53,000
-
2020-02-07soldstatus $53,000 230-char remark
Show marketing remark (230 chars)
Lots of potential with this 3 bedroom, 2 bath property in Fletcher. Partially remodeled. Outside in good shape with nearly new roof and vinyl siding. 2 sheds and storm cellar. Thermopane/double pane windows throughout. Sold As Is.
-
2019-11-27$55,000 230-char remark
Show marketing remark (230 chars)
Lots of potential with this 3 bedroom, 2 bath property in Fletcher. Partially remodeled. Outside in good shape with nearly new roof and vinyl siding. 2 sheds and storm cellar. Thermopane/double pane windows throughout. Sold As Is.
-
2002-12-09soldstatus $32,000
ⓘ Source: listings_history table (triggers on properties + properties_extension) + one-shot
backfill from property_details.listing_events for pre-trigger history.
Tax reassessment forecast OK · Resets to sale price
- Current annual tax
- $568 · $47/mo
- Projected year-2 tax
- $1,530 · $127/mo
- Expected delta
- +$962/yr (+$80/mo · 169.4%)
ⓘ Screening estimate from a state-policy table — verify with the county assessor before closing.
Nearby sold comps map
Loading sold comps map…
Walkable amenities ~0.75 mi
Loading nearby amenities…
Taxation est. · year 1
- Rental income
- $13,643
- − Mortgage interest
- −$9,523
- − Property taxes
- −$568
- − Insurance
- −$850
- − Repairs & maintenance
- −$1,091
- − Management
- −$1,091
- − Depreciation
- −$4,945
- Taxable loss
- −$4,426
- Est. tax savings @ 24.0%
- +$1,062
- After-tax cash flow
- $-276/yr
For passive investors: Depreciation is non-cash, so a rental often shows a tax loss while cash-flowing — sheltering income. Rental losses are passive: they offset passive income freely, and up to $25,000/yr can offset ordinary (W-2) income if you actively participate and your MAGI is under $100k (phasing out to $0 by $150k); unused losses carry forward. On sale, claimed depreciation is recaptured at up to 25%, and gains may owe capital-gains tax (a 1031 exchange can defer both). Figures are a year-1 estimate at your 24.0% rate — not tax advice; consult a CPA.
Schools (NCES district)
- District
- Fletcher
- NCES district ID
- 4011700
- Math proficiency
- 12% ▼ -11.00%
- Reading proficiency
- 23% ▼ -10.00%
- Median HH income
- $50,233
- Composite
- 15.82/100
- National rank
- #9264
- State rank
- #189 of 270 in OK
Livability — Fletcher
- Score
- 65/100
- State rank
- #133
- US rank
- #12742
Category grades
Schools grade is shown separately in the Schools card above.
Census & demographics
- Census place
- Fletcher, OK
- Population (ZIP)
- 3,624
Population outlook (Comanche County) Hauer SSP2
- Today (2025)
- 124,518 people
- By 2030
- 124,231 · -0.2%
- By 2040
- 122,193 · -1.9%
- By 2050
- 120,368 · -3.3%
- By 2075
- 120,492 · -3.2%
- By 2100
- 123,113 · -1.1%
Race, ethnicity, and origin ACS 2023
- Neighborhood character
- Predominantly White (80%)
- Race & ethnicity
- White 80% Two or more races 12% Native American 4% Hispanic / Latino 3% Black 2%
- Common ancestry
- Italian 3% Lithuanian 2% Slovak 1%
- Foreign-born
- 2%
- Languages at home
- 97% English-only · Spanish 1%
Political lean MEDSL · Comanche
- 2024 margin
- Strong R (+23.3) · D 37.4% · R 60.7% · Other 1.9%
- 2008→2024 swing
- -5.8pp toward R · 2008: -17.5pp · 2024: -23.3pp
- All cycles
- 2024: R+23.3 2020: R+20.1 2016: R+23.7 2012: R+17.0 2008: R+17.5
Not yet ingested
- Civics
- —
Market trends
- HPI YoY
- ▲ 5.65%
- Current HPI
- 256.7598
- Rent YoY
- —
- Metro
- —
- State GDP YoY
- ▲ 1.55%
- F500 in state
- 6
Industry mix (Fortune 500 HQ in OK)
| Industry | F500 HQs | Revenue |
|---|---|---|
| Energy | 3 | $48B |
|
||
Price history
+431.2% since first listed5 events — show timeline
- 2026-05-26 Listed $170,000 FSBO.com
- 2020-02-10 Sold (Public Records) $53,000 Public Records
- 2020-02-07 Sold (MLS) $53,000 LBRMLS
- 2019-11-27 Listed $55,000 LBRMLS
- 2002-12-09 Sold (Public Records) $32,000 Public Records
Property tax history
+8.4%/yrLatest (2025): $568 · +3.8% YoY. Source: county tax records.
Cash-flow waterfall
monthlySold comps — $/sqft
last 12 mo · ≤1 miLoading sold comps…