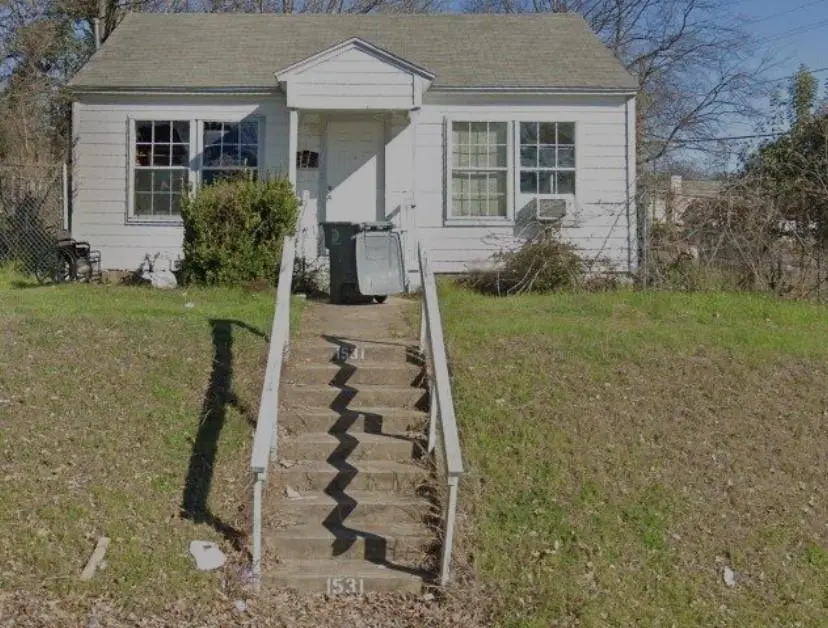
1531 Padgitt Ave · Dallas, TX
Flood risk 1/10 · Minimal
- FEMA flood zone
- X (unshaded)
- Chance of flooding over 30 yrs
- 0.0%
- Est. flood insurance / yr
- $507 – $1,088
Fire risk 1/10 · Minimal
- Est. fire insurance / yr
- $1,222 – $2,270
Heat risk 7/10 · Major
- Hot days now (above 109°F)
- 7 days/yr
- Hot days in 30 yrs
- 23 days/yr
Wind risk 6/10 · Moderate
- Chance of severe wind over 30 yrs
- 27.0%
Air-quality risk 2/10 · Minimal
- Unhealthy air days now
- 1 days/yr
- Unhealthy air days in 30 yrs
- 2 days/yr
Risk factors via First Street. Map © Google.
Why this score? — see what drove the D grade
The composite is a weighted blend of 9 inputs, each scored 0–100. Each bar is that input's sub-score; the figure is the points it added to the 100-point composite (weight × sub-score).
- Cash flow +12.5/30.0
- Appreciation +10.0/10.0
- 1% rule +4.8/10.0
- Livability +4.0/5.0
- DSCR +3.7/10.0
- Schools +2.8/10.0
- Condition / age +2.5/5.0
- Rent growth +1.8/5.0
- ARV discount +1.0/15.0
$160,000
🖨 Deal sheet (PDF) 📄 Offer letter ✓ Due diligence
Listing remarks
Investor’s Dream Opportunity! Price is for both 1931 & 1935 This property comes with the lot next door 1935 Padgitt Ave offering endless potential for expansion, new construction, additional parking, or added investment value. Perfect opportunity for investors, builders, or buyers looking to maximize possibilities. Don’t miss your chance to secure two parcels in one deal!
Key facts
- Two parcels
- New construction
- Additional parking
Tags
Property features AI
Finance
- Other: Lot size approximately 0.177 acres
- Financial info: No second mortgage indicated; Listing is for sale
- HOA & community: No association
Exterior
- Parking: No covered or carport spaces listed
- Utilities: City water; City sewer; Not located in a municipal utility district
- Home design: Single family residence; Residential property; Built in 1938; One story
- Construction: Year built 1938
- Exterior features: Additional parking; Lot in Cedar Cliff subdivision
Interior
- Kitchen: No appliances included
- Bedrooms: Primary bedroom 13 x 13 (level 1); Total of 2 bedrooms
- Bathrooms: 1 full bathroom
- Interior features: One level layout; Other interior features
- Laundry & utility: No laundry appliances listed
Neighborhood map
What this means for you Summary
Snapshot
- This is a 2-bed/1.0-bath single-family listed at $160k.
Deal economics
- At list price, monthly cash flow is $-23 ($-271/yr) — negative.
- To cash-flow at today's rent, offer at most $156k (2.5% below list).
- To meet the 1% rule (rent ≥ 1% of price), the offer needs to be $157k (1.7% below list).
- Recommended offer: $155k (3.0% below list) — sets the bar for market timing.
- Cap rate 6.1% vs local median 2.3% in Dallas — top-decile yield for the area; either an underpriced asset or a hidden risk that comps aren't pricing in. Stress-test before assuming the spread holds.
Location & tenants
- Location reads 81/100 on livability (#24 in TX, #1,380 nationally) — a professional / high-income tenant draw. Strengths: amenities A+, commute A+, housing A+; Watch: crime F.
- Dallas ISD (urban): math 31% / reading 36% proficiency, ranked #559 of 826 in TX (top 68%) — families likely to look elsewhere, expect single-tenant / working-renter base with shorter leases; 83% free/reduced lunch — lower-income household profile, screen leases tightly.
- Zoned schools: Cedar Crest El (math 52% / reading 37%, grade F, #1,155 of 4,322 statewide, top 29%, 321 students, 100% FRL); John Lewis Social Justice Academy At O W Holmes (math 22% / reading 22%, grade F, #1,360 of 1,662 statewide, top 83%, 581 students, 100% FRL); Franklin D Roosevelt H S of Innovation (math 12% / reading 22%, grade F, #1,491 of 1,632 statewide, top 92%, 748 students, 96% FRL) — zoned schools average 99% FRL vs 83% district-wide (15 pts higher); higher-poverty schools than district average — tighter screening recommended.
- Market conditions: Rents soft (-2.7%/yr); 147 active listings in the ZIP; 40 comparable units currently listed for rent nearby; rentals at typical pace (median 26d on market — plan ~3-4 weeks tenant-placement turnaround); 12,577 units permitted in Dallas County in 2024 (6,829 in 5+ unit buildings).
Forward outlook
- In year one you build about $17k of equity ($1k loan paydown + $16k appreciation (10.0% local appreciation)).
- Dallas County population projected at +35% by 2050 — long-run rental-demand tailwind backs the buy-and-hold thesis.
- At projected returns (10.0% appreciation + 0.0% rent growth), your $45k cash investment doubles in ~3 years — after that, you're playing with house money.
- By year 3, paydown + projected appreciation supports a ~$43k cash-out refi (75% LTV) — recoverable capital for the next deal without selling this one.
Negotiation context
- It's been on market 33 days — a 3% lower offer ($155k) is reasonable based on typical stale-listing flexibility.
- 2 sale attempts; this cycle's ask has dropped $20k (11%) from the opening price — seller is motivated, your offer sets the floor, not the list.
Risks & watch-outs
- Watch-outs: property tax is 2.7% of price; built in 1938 — expect roof / HVAC / electrical / plumbing capex.
- Climate carrying-cost: major wind risk, 27% chance of damaging wind over 30y; extreme-heat days projected 7→23/yr by 2055 (HVAC capex compounding) — expect insurance premiums to compound above CPI over the hold.
Questions for the listing agent
- What do current leases actually rent for vs. the listed asking? Can we see a recent rent roll and the last 12 months of T-12 income?
- It's been on market 33 days. Have you received any prior offers? Is the seller open to a 3% concession, seller financing, or rate buy-down credit?
- Built in 1938 — when were the roof, HVAC, electrical panel, plumbing, and water heater last replaced?
- Property tax is high relative to price — has the assessment been appealed recently, and will the sale trigger a re-assessment?
- Is there a deadline driving the sale (1031 exchange, divorce, estate, relocation)? That informs how much negotiation room exists.
- Crime grade is F in this area — have there been break-ins, vandalism, or insurance claims at this property in the last 3 years? What carrier currently insures it and at what premium?
- The area grade is low — what's the realistic commute time and amenity access for the typical tenant pool here? Any planned neighborhood developments (good or bad) we should know about?
- What's the average days-on-market for RENTAL listings here right now (not sales)? A rising rental-DOM trend means longer vacancies and softer asking-rent achievability than the comps imply.
- What's the recent tenant-quality profile in this submarket — average credit score on applications, eviction rate, late-payment / NSF rate, and stable-employment percentage? A property-management company in the area should have these aggregated.
- How much new for-sale + rental construction is in the pipeline within 1–3 miles? Heavy new supply typically softens prices + rents 12–24 months out; constrained supply supports both.
Investment metrics
- 1% rule
- 0.98% ✗
- Cap rate
- 6.12%
- Cash-on-cash
- -0.60%
- DSCR
- 0.97
- GRM
- 8.5
CMA / ARV
- ARV (median comp)
- $139,867
- List price
- $160,000
- Delta
- 14.39%
- Verdict
- OVERPRICED
- Comps
- 20 within 1.0 mi
Show comp detail 12 sales within ~0.75 mi
| Address | Dist | Beds/Ba | Sqft | Sold | Price | $/sf | Match |
|---|---|---|---|---|---|---|---|
| 1622 Avenue B | 0.25mi | 2/1.0 | 825 (-1%) | 11mo | $120,000 | $145 | 78 |
| 319 Avenue H | 0.47mi | 2/1.0 | 837 (+1%) | 4mo | $144,900 | $173 | 73 |
| 1515 Morrell Ave | 0.14mi | 2/1.0 | 840 (+1%) | 22mo | $79,900 | $95 | 73 |
| 814 Lambert St | 0.26mi | 2/1.0 | 728 (-12%) | 9mo | $140,000 | $192 | 60 |
| 1306 E Waco Ave | 0.56mi | 2/1.0 | 896 (+8%) | 3mo | $99,000 | $110 | 59 |
| 818 Lambert St | 0.26mi | 2/1.0 | 732 (-12%) | 11mo | $109,900 | $150 | 59 |
| 827 Bonnie View Rd | 0.33mi | 3/2.0 (+1) | 860 (+3%) | 14mo | $184,000 | $214 | 58 |
| 1215 Morrell Ave | 0.46mi | 2/1.0 | 900 (+8%) | 10mo | $224,900 | $250 | 57 |
| 1003 Bonnie View Rd | 0.38mi | 2/1.0 | 884 (+6%) | 18mo | $204,500 | $231 | 57 |
| 2022 Dudley Ave | 0.49mi | 2/1.0 | 851 (+2%) | 23mo | $104,000 | $122 | 54 |
| 1825 Dudley Ave | 0.53mi | 3/1.0 (+1) | 939 (+13%) | 8mo | $160,000 | $170 | 43 |
| 519 Avenue I | 0.48mi | 2/1.0 | 952 (+14%) | 16mo | $119,900 | $126 | 41 |
Match score weights: distance 35% · size 25% · config 20% · recency 20%. Top-matched comps best support the ARV.
Projected returns pro-forma
10.0% appreciation · 0.0% rent growth · sell at horizon
- IRR
- 22.8%
- Equity multiple
- 2.81×
- Total profit
- $81,215
- Equity at exit
- $144,141
- IRR
- 19.6%
- Equity multiple
- 6.18×
- Total profit
- $232,281
- Equity at exit
- $310,845
Cash invested: $44,800 (down + closing). Projections, not guarantees.
Landlord ↔ Tenant lean methodology
- Overall (STATE)
- 87 Strongly Landlord-Friendly
- State Texas
- 87 Strongly Landlord-Friendly · R+5
- County
- — inherits STATE
- City
- — inherits STATE
ZIP-level market 75203
- Home prices YoY
- 31.8%
- Rents YoY
- -2.7%
- Active inventory
- 147
- Price-to-rent
- 8.5×
Monthly cashflow live
- Estimated rent
- $1,573 high interval (Pro) →
- Mortgage (P&I)
- −$839
- Tax from tax record
- −$360 /mo · $4,316/yr
- Insurance
- −$67
- HOA
- −$0
- Vacancy / Maint / Mgmt
- −$330
- Net cashflow
- $-23
Break-even live
Sensitivity live
| Price | -10% $68 | -5% $23 | +0% $-23 | +5% $-68 | +10% $-113 |
|---|---|---|---|---|---|
| Rent | -10% $-147 | -5% $-85 | +0% $-23 | +5% $40 | +10% $102 |
| Rate | -1.0pp $58 | -0.5pp $18 | base $-23 | +0.5pp $-64 | +1.0pp $-106 |
UW: 25.0% down · 7.5% · 30yr · 1.5% tax · 5.0% vac · 8.0% maint · 8.0% mgmt
Financing live
Cash to close
- Down payment
- $40,000
- Closing costs
- $4,800
- Reserves months
- —
- Total cash needed
- —
Loan-product check · same deal, 3 products live
Conventional
25% down · 7.5% · 30yr
- Down + closing
- —
- Monthly P&I
- —
- Monthly cashflow
- —
- DSCR
- —
- Eligible?
- —
Personal DTI + credit; lowest rate.
DSCR
20% down · 8.5% · 30yr
- Down + closing
- —
- Monthly P&I
- —
- Monthly cashflow
- —
- DSCR
- —
- Eligible?
- —
No personal income docs; deal must DSCR.
Hard money
10% down · 12.0% · 12mo
- Down + closing
- —
- Monthly P&I
- —
- Monthly cashflow
- —
- DSCR
- —
- Eligible?
- —
Short-term bridge; refi at stabilization.
Rent comps 40 comps
| Address | Beds | Baths | Sqft | Rent | $/sqft | DOM | Units | Dist |
|---|---|---|---|---|---|---|---|---|
| 607 Woodbine Ave Dallas, TX | 2.0 | 1.0 | 782 | $1,350 | $1.73 | 9d | 1 | 0.15mi |
| 948 S Corinth Street Rd #1 Dallas, TX | 2.0 | 2.0 | 1013 | $1,650 | $1.63 | 26d | 1 | 0.16mi |
| 948 S Corinth Street Rd #5 Dallas, TX | 2.0 | 2.0 | 920 | $1,550 | $1.68 | 45d | 1 | 0.16mi |
| 948 S Corinth Street Rd #1 Dallas, TX | 2.0 | 2.0 | 1013 | $1,650 | $1.63 | 45d | 1 | 0.16mi |
| 1710 Morrell Ave Dallas, TX | 2.0 | 1.0–2.0 | 654 | $2,069 | $3.16 | 1d | 39 | 0.17mi |
| 948 S Corinth Street Rd Unit 6 Dallas, TX | 2.0 | 2.0 | 1013 | $1,625 | $1.60 | 15d | 1 | 0.26mi |
| 6 S Corinth Street Rd Dallas, TX | 1.0 | 1.0 | 800 | $1,050 | $1.31 | 26d | 1 | 0.32mi |
| 260 S Corinth Street Rd Unit 238 Dallas, TX | 1.0 | 1.0 | 600 | $900 | $1.50 | 45d | 1 | 0.35mi |
| 2002 Dudley Ave Dallas, TX | 2.0 | 1.0 | 750 | $1,375 | $1.83 | 9d | 1 | 0.48mi |
| 2206 Rockefeller Blvd Dallas, TX | 2.0 | 1.0 | 680 | $1,450 | $2.13 | 45d | 1 | 0.50mi |
| 801 Avenue I Unit 1-107 Dallas, TX | 1.0 | 1.0 | 872 | $1,749 | $2.01 | 26d | 1 | 0.51mi |
| 2254 Areba St Dallas, TX | 2.0 | 1.0 | 1120 | $1,650 | $1.47 | 1d | 1 | 0.51mi |
| 2254 Areba St Unit A Dallas, TX | 2.0 | 1.0 | 1120 | $1,450 | $1.29 | 45d | 1 | 0.51mi |
| 2250 Areba St Unit A Dallas, TX | 2.0 | 1.0 | 779 | $1,850 | $2.37 | 45d | 1 | 0.51mi |
| 2218 Rockefeller Blvd Dallas, TX | 3.0 | 1.0 | 1028 | $1,750 | $1.70 | 1d | 1 | 0.52mi |
| 1028 Claude St Dallas, TX | 2.0 | 1.0 | 988 | $1,800 | $1.82 | 26d | 1 | 0.53mi |
| 1018 E Waco Ave Dallas, TX | 3.0 | 1.0 | 1112 | $1,395 | $1.25 | 46d | 1 | 0.68mi |
| 850 S Ewing Ave Dallas, TX | 1.0–2.0 | 1.0–2.5 | 1086 | $2,450 | $2.25 | 5d | 2 | 0.75mi |
| 405 S Ewing Ave Unit 406 Dallas, TX | 2.0 | 2.0 | 1102 | $2,550 | $2.31 | 45d | 1 | 0.85mi |
| 405 S Ewing Ave Unit 308 Dallas, TX | 1.0 | 1.0 | 660 | $1,319 | $2.00 | 45d | 1 | 0.85mi |
| 405 S Ewing Ave Unit 416 Dallas, TX | 1.0 | 1.0 | 760 | $1,930 | $2.54 | 45d | 1 | 0.85mi |
| 1427 Diceman Ave Dallas, TX | 3.0 | 2.0 | 890 | $1,600 | $1.80 | 26d | 1 | 0.87mi |
| 401 N Moore St Dallas, TX | 1.0 | 1.5 | 972 | $1,700 | $1.75 | 9d | 1 | 0.87mi |
| 1532 Whitaker Ave Dallas, TX | 1.0 | 1.0 | 656 | $1,200 | $1.83 | 45d | 1 | 1.01mi |
| 1310 Michigan Ave Dallas, TX | 3.0 | 2.0 | 972 | $1,900 | $1.95 | 26d | 1 | 1.17mi |
| 405 N Ewing Ave Dallas, TX | 3.0 | 1.0–2.0 | 941 | $2,392 | $2.54 | 3d | 48 | 1.18mi |
| 308 S Storey St Dallas, TX | 1.0 | 1.0 | 900 | $1,550 | $1.72 | 9d | 1 | 1.18mi |
| 511 N Ewing Ave Dallas, TX | 1.0 | 1.0 | 777 | $1,845 | $2.37 | 4d | 9 | 1.20mi |
| 523 N Ewing Ave Dallas, TX | 1.0 | 1.0 | 628 | $1,250 | $1.99 | 6d | 1 | 1.25mi |
| 506 N Lancaster Ave Unit 506A Dallas, TX | 1.0 | 1.0 | 798 | $1,400 | $1.75 | 5d | 1 | 1.25mi |
| 404 E 9th St Dallas, TX | 1.0 | 1.0 | 550 | $1,150 | $2.09 | 3d | 2 | 1.26mi |
| 406 Lansing St Dallas, TX | 2.0 | 2.0 | 1014 | $2,145 | $2.12 | 8d | 1 | 1.28mi |
| 409 E 9th St Dallas, TX | 1.0 | 1.0 | 538 | $970 | $1.80 | 45d | 4 | 1.29mi |
| 2906 E Kiest Blvd Dallas, TX | 2.0–3.0 | 1.0–2.0 | 798 | $1,235 | $1.55 | 0d | 6 | 1.29mi |
| 609 N Lancaster Ave Dallas, TX | 1.0–2.0 | 1.0 | 725 | $1,149 | $1.58 | 3d | 2 | 1.34mi |
| 501 N Marsalis Ave Dallas, TX | 1.0 | 1.0 | 455 | $1,024 | $2.25 | 9d | 3 | 1.34mi |
| 308 E 8th St Unit A1-102 Dallas, TX | 1.0 | 1.0 | 600 | $995 | $1.66 | 26d | 1 | 1.34mi |
| 308 E 8th St Dallas, TX | 1.0 | 1.0 | 600 | $995 | $1.66 | 45d | 1 | 1.34mi |
| 321 E 8th St Dallas, TX | 1.0 | 1.0 | 544 | $899 | $1.65 | 1d | 1 | 1.34mi |
| 624 N Lancaster Ave Dallas, TX | 2.0 | 1.0–2.0 | 800 | $2,365 | $2.96 | 9d | 4 | 1.35mi |
Listing history 14 events
-
2026-06-18days on market $160,000 Active 33 DOM
-
2026-06-17days on market $160,000 Active 32 DOM
-
2026-06-16days on market $160,000 Active 31 DOM
-
2026-06-15days on market $160,000 Active 30 DOM
-
2026-06-13days on market $160,000 Active 28 DOM
-
2026-06-07days on market $160,000 Active 24 DOM
-
2026-06-04days on market $160,000 Active 21 DOM
-
2026-06-03days on market $160,000 Active 20 DOM
-
2026-06-02days on market $160,000 Active 19 DOM
-
2026-06-01days on market $160,000 Active 18 DOM
-
2026-05-31days on market $160,000 Active 17 DOM
-
2026-05-14$180,000 Active 391-char remark
-
2024-04-03soldstatus
-
1961-01-10soldstatus
ⓘ Source: listings_history table (triggers on properties + properties_extension) + one-shot
backfill from property_details.listing_events for pre-trigger history.
Tax reassessment forecast TX · Resets to sale price
- Current annual tax
- $4,316 · $360/mo
- Projected year-2 tax
- $4,316 · $360/mo
- Expected delta
- $0/yr ($0/mo · 0.0%)
ⓘ Screening estimate from a state-policy table — verify with the county assessor before closing.
Climate risk First Street
- Flood 1/10 Low FEMA zone X (unshaded) · 0% chance over 30 yrs
- Wildfire 1/10 Low
- Heat 7/10 Severe 7 d/yr ≥109°F today · 23 d/yr by 30 yrs out
- Wind 6/10 Major 27% chance of damaging wind over 30 yrs
- Air quality 2/10 Low 1 unhealthy d/yr today · 2 by 30 yrs out
Nearby sold comps map
Loading sold comps map…
Walkable amenities ~0.75 mi
Loading nearby amenities…
Taxation est. · year 1
- Rental income
- $18,878
- − Mortgage interest
- −$8,962
- − Property taxes
- −$4,316
- − Insurance
- −$800
- − Repairs & maintenance
- −$1,510
- − Management
- −$1,510
- − Depreciation
- −$4,655
- Taxable loss
- −$2,875
- Est. tax savings @ 24.0%
- +$690
- After-tax cash flow
- $419/yr
For passive investors: Depreciation is non-cash, so a rental often shows a tax loss while cash-flowing — sheltering income. Rental losses are passive: they offset passive income freely, and up to $25,000/yr can offset ordinary (W-2) income if you actively participate and your MAGI is under $100k (phasing out to $0 by $150k); unused losses carry forward. On sale, claimed depreciation is recaptured at up to 25%, and gains may owe capital-gains tax (a 1031 exchange can defer both). Figures are a year-1 estimate at your 24.0% rate — not tax advice; consult a CPA.
Schools (NCES district)
- District
- Dallas ISD
- NCES district ID
- 4816230
- Math proficiency
- 31% ▼ -16.00%
- Reading proficiency
- 36% ▼ -4.00%
- Median HH income
- $42,881
- Composite
- 28.41/100
- National rank
- #6763
- State rank
- #559 of 826 in TX
Livability — Dallas
- Score
- 81/100
- State rank
- #24
- US rank
- #1380
Category grades
Schools grade is shown separately in the Schools card above.
Census & demographics
- Census place
- Dallas, TX
- County
- Dallas County · 2,612,404 people
- City population
- 1,168,437
- Metro
- Dallas-Fort Worth-Arlington, TX
- Population (ZIP)
- 15,775
- Household income
- $46,989
- Rent vs Own
- Severe rent burden
- 948.0
Population outlook (Dallas County) Hauer SSP2
- Today (2025)
- 2,979,839 people
- By 2030
- 3,191,823 · +7.1%
- By 2040
- 3,619,611 · +21.5%
- By 2050
- 4,026,915 · +35.1%
- By 2075
- 4,957,073 · +66.4%
- By 2100
- 5,508,725 · +84.9%
Race, ethnicity, and origin ACS 2023
- Neighborhood character
- Diverse neighborhood (Simpson 0.55)
- Race & ethnicity
- Hispanic / Latino 59% Black 31% Two or more races 17% White 7% Native American 2%
- Hispanic origin (detail)
- Mexican 53%
- Common ancestry
- Lithuanian 1% Swiss 1%
- Foreign-born
- 29% · Canada, China, Jamaica
- Languages at home
- 47% English-only · Spanish 51% French/Haitian/Cajun 1%
Political lean MEDSL · Dallas
- 2024 margin
- Strong D (+22.2) · D 60.2% · R 38.0% · Other 1.8%
- 2008→2024 swing
- +6.9pp toward D · 2008: 15.3pp · 2024: 22.2pp
- All cycles
- 2024: D+22.2 2020: D+31.6 2016: D+26.2 2012: D+15.4 2008: D+15.3
Not yet ingested
- Civics
- —
Market trends
- HPI YoY
- ▲ 86.64%
- Current HPI
- 358.9507
- Rent YoY
- ▼ -2.72%
- Metro
- Dallas-Fort Worth-Arlington, TX
- State GDP YoY
- ▲ 3.95%
- F500 in state
- 110
Industry mix (Fortune 500 HQ in TX)
| Industry | F500 HQs | Revenue |
|---|---|---|
| Energy | 16 | $1,198B |
|
||
| Technology | 5 | $198B |
|
||
| Engineering / Construction | 4 | $72B |
|
||
| Energy Services | 3 | $60B |
|
||
| Utilities | 3 | $41B |
|
||
| Healthcare | 2 | $330B |
|
||
Price history
-11.1% since first listed5 events — show timeline
- 2026-06-10 Relisted — NTREIS
- 2026-05-20 Price Changed $160,000 NTREIS
- 2026-05-14 Listed $180,000 NTREIS
- 2024-04-03 Sold (Public Records) — Public Records
- 1961-01-10 Sold (Public Records) — Public Records
Property tax history
+12.6%/yrLatest (2025): $4,316 · +13.6% YoY. Source: county tax records.
Cash-flow waterfall
monthlySold comps — $/sqft
last 12 mo · ≤1 miLoading sold comps…