 🏗️ New Construction
4605 Brady St Unit B · Houston, TX
Flood risk 1/10 · Minimal
- FEMA flood zone
- X (unshaded)
- Chance of flooding over 30 yrs
- 0.0%
- Est. flood insurance / yr
- $507 – $1,088
Fire risk 1/10 · Minimal
- Est. fire insurance / yr
- $1,222 – $2,270
Heat risk 9/10 · Severe
- Hot days now (above 109°F)
- 7 days/yr
- Hot days in 30 yrs
- 25 days/yr
Wind risk 9/10 · Severe
- Chance of severe wind over 30 yrs
- 99.0%
Air-quality risk 2/10 · Minimal
- Unhealthy air days now
- 2 days/yr
- Unhealthy air days in 30 yrs
- 2 days/yr
Risk factors via First Street. Map © Google.
Why this score? — see what drove the F grade
The composite is a weighted blend of 9 inputs, each scored 0–100. Each bar is that input's sub-score; the figure is the points it added to the 100-point composite (weight × sub-score).
- Appreciation +10.0/10.0
- ARV discount +7.5/15.0
- Cash flow +4.2/30.0
- Condition / age +4.0/5.0
- Livability +3.7/5.0
- Schools +2.7/10.0
- Rent growth +1.8/5.0
- 1% rule +0.3/10.0
- DSCR +0.0/10.0
$359,900
🖨 Deal sheet (PDF) 📄 Offer letter ✓ Due diligence
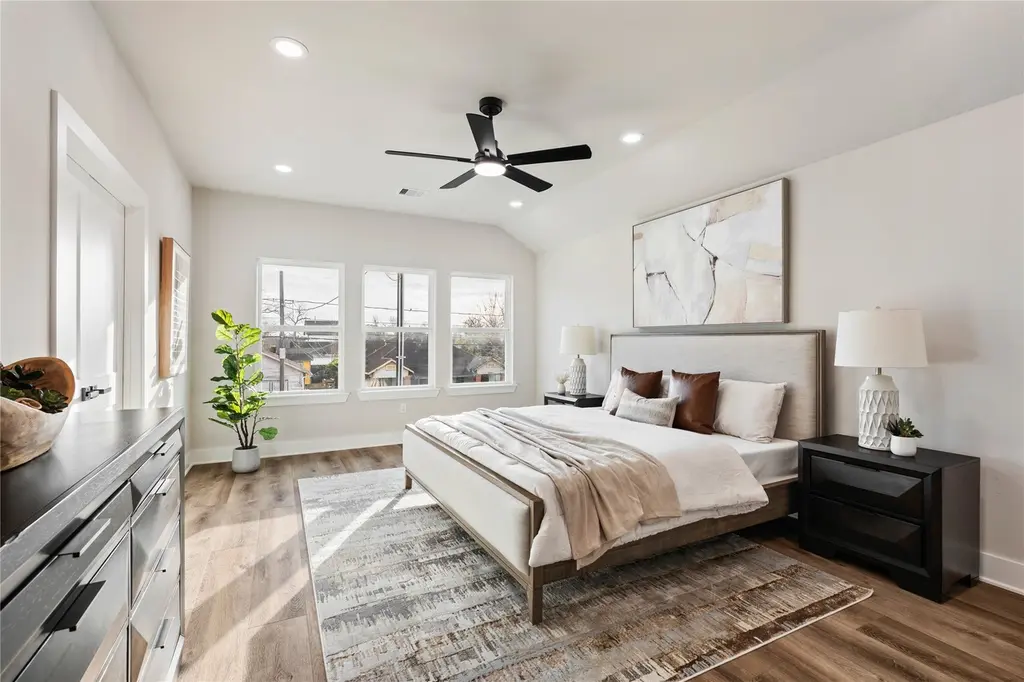
Listing remarks
New construction home located in the heart of East Downtown, just minutes from Downtown Houston, restaurants, bars, and East River 9. This thoughtfully designed residence offers just under 1,800 SF with 3 bedrooms and 2.5 bathrooms. First-floor living features an open-concept kitchen, dining, and living area with direct access to a large backyard and covered patio—ideal for entertaining. Built with function and quality in mind, the home includes laminte flooring throughout (no carpet), 10-foot ceilings on first floor, and abundant natural light fill the home from the abundance of windows. Upstairs you’ll find two secondary bedrooms with an oversized shared bathroom, along with a
Key facts
- Laminate flooring
- Open-concept kitchen
- 10-foot ceilings
Tags
Property features AI
Finance
- Other: Road surface: asphalt; Lot size approximately 3,000 square feet (0.0689 acres)
Exterior
- Parking: Attached garage with 2 spaces
- Security: Smoke detectors
- Utilities: Public water; Public sewer
- Home design: Residential property; New construction (2024); Slab foundation; Composition roof; Built by Brady St Developers
- Construction: Cement siding; Composition roof; Slab foundation; Year built 2024
- Exterior features: Covered patio; Patio and deck; Private yard; Fenced backyard; Property backs to greenbelt/park; Cleared lot
Interior
- Kitchen: Dishwasher; Disposal; Gas oven; Gas range; Microwave; Kitchen island; Quartz countertops; Pantry; Breakfast bar
- Bedrooms: Total rooms: 6
- Flooring: Laminate flooring; Tile flooring
- Bathrooms: 2 full bathrooms; 1 half bathroom
- Heating & cooling: Central heating (gas); Central electric air conditioning; Programmable thermostat
- Interior features: Breakfast bar; Double vanity; High ceilings; Kitchen island; Kitchen/family room combo; Pantry; Quartz countertops; Self-closing cabinet doors and drawers; Soaking tub; Separate shower; Tub shower; Ceiling fans; Combined living and dining area; Programmable thermostat; Low emissivity windows
- Laundry & utility: Washer hookup; Electric dryer hookup; Gas dryer hookup; Tankless water heater
Neighborhood map
What this means for you Summary
Snapshot
- This is a 3-bed/2.5-bath single-family listed at $360k. Condition is rated good.
Deal economics
- At list price, monthly cash flow is $-1k ($-13k/yr) — negative.
- To cash-flow at today's rent, offer at most $237k (34.3% below list).
- To meet the 1% rule (rent ≥ 1% of price), the offer needs to be $207k (42.5% below list).
- Recommended offer: $207k (42.5% below list) — sets the bar for 1% rule.
Location & tenants
- Location reads 74/100 on livability (#184 in TX, #4,771 nationally) — a middle-class / working-renter tenant base. Strengths: amenities A+, cost of living A+, housing A+; Watch: crime F.
- Houston ISD (urban): math 27% / reading 35% proficiency, ranked #593 of 826 in TX (top 72%) — families likely to look elsewhere, expect single-tenant / working-renter base with shorter leases; 71% free/reduced lunch — lower-income household profile, screen leases tightly.
- Zoned schools: Burnet El (math 12% / reading 32%, grade F, #3,333 of 4,322 statewide, top 80%, 407 students, 91% FRL); Navarro Middle (math 8% / reading 13%, grade F, #1,639 of 1,662 statewide, top 99%, 547 students, 98% FRL); Austin H S (math 9% / reading 18%, grade F, #1,530 of 1,632 statewide, top 94%, 1,448 students, 97% FRL) — zoned schools average 96% FRL vs 71% district-wide (24 pts higher); higher-poverty schools than district average — tighter screening recommended.
- Zoned-school proficiency averages 15% at this address vs 31% district-wide (-16 pts) — the specific schools serving this property underperform the Houston ISD average; the district grade overstates school quality for this exact location.
- Market conditions: Rents soft (-2.9%/yr); 161 active listings in the ZIP; 40 comparable units currently listed for rent nearby; rentals leasing fast (median 7d on market — plan ~1-2 weeks tenant-placement turnaround); 29,883 units permitted in Harris County in 2024 (8,621 in 5+ unit buildings).
- At $2,069/mo this rent would consume 50% of the median local household income ($50k/yr) (locally 655% of renters already pay >50% of income on rent) — very limited rent-growth headroom before tenants either downsize or default.
Forward outlook
- In year one you build about $42k of equity ($3k loan paydown + $39k appreciation (10.0% local appreciation)).
- Harris County population projected at +47% by 2050 — long-run rental-demand tailwind backs the buy-and-hold thesis.
- By year 2, paydown + projected appreciation supports a ~$67k cash-out refi (75% LTV) — recoverable capital for the next deal without selling this one.
Negotiation context
- Only 14 days on market — expect competitive offers; lowballing is unlikely to land.
- 6 sale attempts with the ask held roughly flat each time — persistent listings suggest the price (not the market) is what's stuck; bring a comps-based counter.
Risks & watch-outs
- Climate carrying-cost: severe wind risk, 99% chance of damaging wind over 30y; extreme-heat days projected 7→25/yr by 2055 (HVAC capex compounding) — expect insurance premiums to compound above CPI over the hold.
Questions for the listing agent
- What do current leases actually rent for vs. the listed asking? Can we see a recent rent roll and the last 12 months of T-12 income?
- Is there a deadline driving the sale (1031 exchange, divorce, estate, relocation)? That informs how much negotiation room exists.
- Schools are D-rated, which usually means shorter tenancies and higher turnover. Who's the typical renter profile here, and what's been the actual vacancy rate?
- Crime grade is F in this area — have there been break-ins, vandalism, or insurance claims at this property in the last 3 years? What carrier currently insures it and at what premium?
- The area grade is low — what's the realistic commute time and amenity access for the typical tenant pool here? Any planned neighborhood developments (good or bad) we should know about?
- What's the average days-on-market for RENTAL listings here right now (not sales)? A rising rental-DOM trend means longer vacancies and softer asking-rent achievability than the comps imply.
- What's the recent tenant-quality profile in this submarket — average credit score on applications, eviction rate, late-payment / NSF rate, and stable-employment percentage? A property-management company in the area should have these aggregated.
- How much new for-sale + rental construction is in the pipeline within 1–3 miles? Heavy new supply typically softens prices + rents 12–24 months out; constrained supply supports both.
Investment metrics
- 1% rule
- 0.53% ✗
- Cap rate
- 3.03%
- Cash-on-cash
- -11.66%
- DSCR
- 0.48
- GRM
- 15.7
CMA / ARV
- ARV (median comp)
- $390,056
- List price
- $359,900
- Delta
- -7.73%
- Verdict
- FAIR
- Comps
- 20 within 1.0 mi
Show comp detail 12 sales within ~0.75 mi
| Address | Dist | Beds/Ba | Sqft | Sold | Price | $/sf | Match |
|---|---|---|---|---|---|---|---|
| 5005 Brady St | 0.26mi | 4/3.0 (+1) | 1,776 (+3%) | 0mo | $375,000 | $211 | 76 |
| 137 Eastwood St | 0.13mi | 3/3.5 | 1,912 (+11%) | 1mo | $369,900 | $193 | 71 |
| 747 Dumble St | 0.54mi | 3/3.5 | 1,744 (+1%) | 2mo | $369,990 | $212 | 67 |
| 3906 Rusk St | 0.68mi | 3/2.5 | 1,752 (+2%) | 3mo | $425,000 | $243 | 63 |
| 5103 Avenue J | 0.45mi | 3/3.5 | 1,816 (+5%) | 3mo | $399,900 | $220 | 63 |
| 5107 Avenue J | 0.45mi | 3/3.5 | 1,816 (+5%) | 3mo | $369,900 | $204 | 63 |
| 4009 Wilmer St | 0.47mi | 3/2.0 | 1,593 (-8%) | 3mo | $389,000 | $244 | 61 |
| 5011 Walker St | 0.63mi | 2/1.0 (-1) | 1,720 (-0%) | 2mo | $299,000 | $174 | 57 |
| 402 Hunt St | 0.42mi | 3/2.0 | 1,521 (-12%) | 4mo | $337,000 | $222 | 56 |
| 4121 Woodleigh St | 0.71mi | 4/3.0 (+1) | 1,619 (-6%) | 0mo | $569,000 | $351 | 49 |
| 4313 Polk St | 0.74mi | 3/2.0 | 1,575 (-9%) | 0mo | $395,000 | $251 | 49 |
| 4022 Mckinney St | 0.70mi | 3/3.5 | 1,864 (+8%) | 3mo | $299,000 | $160 | 48 |
Match score weights: distance 35% · size 25% · config 20% · recency 20%. Top-matched comps best support the ARV.
Projected returns pro-forma
10.0% appreciation · 0.0% rent growth · sell at horizon
- IRR
- 15.5%
- Equity multiple
- 2.27×
- Total profit
- $138,818
- Equity at exit
- $351,393
- IRR
- 14.7%
- Equity multiple
- 5.13×
- Total profit
- $451,150
- Equity at exit
- $757,792
Cash invested: $109,216 (down + closing). Projections, not guarantees.
Landlord ↔ Tenant lean methodology
- Overall (STATE)
- 87 Strongly Landlord-Friendly
- State Texas
- 87 Strongly Landlord-Friendly · R+5
- County
- — inherits STATE
- City
- — inherits STATE
ZIP-level market 77011
- Home prices YoY
- 30.1%
- Rents YoY
- -2.9%
- Active inventory
- 161
- Price-to-rent
- 14.5×
Monthly cashflow live
- Estimated rent
- $2,069 high interval (Pro) →
- Mortgage (P&I)
- −$2,045
- Tax est. 1.5%
- −$488 /mo · $5,851/yr
- Insurance
- −$163
- HOA
- −$0
- Vacancy / Maint / Mgmt
- −$434
- Net cashflow
- $-1,061
Break-even live
Sensitivity live
| Price | -10% $-792 | -5% $-926 | +0% $-1,061 | +5% $-1,196 | +10% $-1,331 |
|---|---|---|---|---|---|
| Rent | -10% $-1,225 | -5% $-1,143 | +0% $-1,061 | +5% $-979 | +10% $-898 |
| Rate | -1.0pp $-865 | -0.5pp $-962 | base $-1,061 | +0.5pp $-1,162 | +1.0pp $-1,265 |
UW: 25.0% down · 7.5% · 30yr · 1.5% tax · 5.0% vac · 8.0% maint · 8.0% mgmt
Financing live
Cash to close
- Down payment
- $97,514
- Closing costs
- $11,702
- Reserves months
- —
- Total cash needed
- —
Loan-product check · same deal, 3 products live
Conventional
25% down · 7.5% · 30yr
- Down + closing
- —
- Monthly P&I
- —
- Monthly cashflow
- —
- DSCR
- —
- Eligible?
- —
Personal DTI + credit; lowest rate.
DSCR
20% down · 8.5% · 30yr
- Down + closing
- —
- Monthly P&I
- —
- Monthly cashflow
- —
- DSCR
- —
- Eligible?
- —
No personal income docs; deal must DSCR.
Hard money
10% down · 12.0% · 12mo
- Down + closing
- —
- Monthly P&I
- —
- Monthly cashflow
- —
- DSCR
- —
- Eligible?
- —
Short-term bridge; refi at stabilization.
Rent comps 40 comps
| Address | Beds | Baths | Sqft | Rent | $/sqft | DOM | Units | Dist |
|---|---|---|---|---|---|---|---|---|
| 2 Jenkins St Houston, TX | 3.0 | 2.0 | 1242 | $2,250 | $1.81 | 45d | 1 | 0.22mi |
| 132 N Estelle St Unit 1526930P Houston, TX | 2.0 | 1.0 | 1076 | $1,760 | $1.64 | 9d | 1 | 0.32mi |
| 5502 Texas St Unit 1514806P Houston, TX | 3.0 | 2.5 | 1808 | $7,179 | $3.97 | 0d | 1 | 0.61mi |
| 5504 Texas St Unit 1514810P Houston, TX | 3.0 | 2.5 | 1808 | $7,146 | $3.95 | 0d | 1 | 0.62mi |
| 4411 Dallas St Houston, TX | 2.0 | 1.0–2.0 | 734 | $2,000 | $2.72 | 1d | 14 | 0.62mi |
| 4009 Lamar St Unit A Houston, TX | 2.0 | 2.0 | 1368 | $1,699 | $1.24 | 1d | 1 | 0.72mi |
| 4952 Polk St Unit 1531107P Houston, TX | 2.0 | 2.0 | 1980 | $2,327 | $1.18 | 9d | 1 | 0.76mi |
| 4952 Polk St Unit 1531100P Houston, TX | 1.0–2.0 | 1.0–2.0 | 1258 | $2,285 | $1.82 | 0d | 2 | 0.76mi |
| 4001 Dallas St Unit 1029264P Houston, TX | 3.0 | 3.0 | 2174 | $5,220 | $2.40 | 0d | 1 | 0.79mi |
| 5121 Polk St Unit 1 Houston, TX | 2.0 | 1.0 | 1300 | $1,600 | $1.23 | 26d | 1 | 0.82mi |
| 6403 Avenue C Unit 1019625P Houston, TX | 2.0–8.0 | 1.0–4.0 | 1232 | $3,836 | $3.11 | 0d | 2 | 1.07mi |
| 99 N Delano St Houston, TX | 2.0 | 2.0 | 1052 | $1,311 | $1.25 | 26d | 1 | 1.08mi |
| 800 Middle St Houston, TX | 1.0–4.0 | 1.0–2.0 | 1003 | $1,593 | $1.59 | 7d | 1 | 1.09mi |
| 2816 Rusk St Houston, TX | 3.0 | 3.5 | 2107 | $2,800 | $1.33 | 45d | 1 | 1.20mi |
| 2414 East Dr Unit Canal St unit Houston, TX | 3.0 | 3.5 | 2063 | $2,950 | $1.43 | 9d | 1 | 1.28mi |
| 2404 Navigation Blvd Unit 422 Houston, TX | 2.0 | 2.0 | 1309 | $2,296 | $1.75 | 9d | 1 | 1.31mi |
| 2404 Navigation Blvd Unit 2441 Houston, TX | 2.0 | 2.0 | 1309 | $2,280 | $1.74 | 0d | 1 | 1.31mi |
| 2404 Navigation Blvd Unit 2187 Houston, TX | 2.0 | 2.0 | 1309 | $2,321 | $1.77 | 0d | 1 | 1.31mi |
| 2404 Navigation Blvd Unit 424 Houston, TX | 2.0 | 2.0 | 1309 | $2,296 | $1.75 | 7d | 1 | 1.31mi |
| 3131 Leeland St Houston, TX | 3.0 | 3.5 | 1966 | $2,850 | $1.45 | 26d | 1 | 1.33mi |
| 3448 Coyle St Unit 510 Houston, TX | 3.0 | 2.0 | 1151 | $1,215 | $1.06 | 17d | 1 | 1.37mi |
| 3448 Coyle St Unit 3174 Houston, TX | 3.0 | 2.0 | 1151 | $1,199 | $1.04 | 0d | 1 | 1.37mi |
| 2504 Rusk St Unit 1563174P Houston, TX | 2.0 | 2.0 | 1819 | $4,036 | $2.22 | 4d | 1 | 1.38mi |
| 308 Grove St Houston, TX | 3.0 | 3.0 | 1701 | $2,350 | $1.38 | 9d | 1 | 1.39mi |
| 2424 Capitol St Houston, TX | 2.0 | 2.0 | 1210 | $1,634 | $1.35 | 45d | 1 | 1.43mi |
| 2315 Navigation Blvd Houston, TX | 1.0–2.0 | 1.0–2.5 | 943 | $3,500 | $3.71 | 0d | 62 | 1.45mi |
| 2501 McKinney St Houston, TX | 2.0 | 2.0 | 1210 | $1,634 | $1.35 | 1d | 1 | 1.45mi |
| 2501 McKinney St Unit CRT2 Houston, TX | 2.0 | 2.0 | 1210 | $1,634 | $1.35 | 4d | 1 | 1.46mi |
| 3517 McIlhenny St Houston, TX | 3.0 | 3.5 | 2000 | $3,200 | $1.60 | 5d | 1 | 1.47mi |
| 3419 Gillespie St Houston, TX | 3.0 | 3.5 | 2168 | $2,300 | $1.06 | 45d | 1 | 1.47mi |
| 2104 Canal St Unit 2162 Houston, TX | 2.0 | 2.0 | 1052 | $1,244 | $1.18 | 7d | 1 | 1.48mi |
| 2104 Canal St Unit 2165 Houston, TX | 2.0 | 2.0 | 1052 | $1,269 | $1.21 | 0d | 1 | 1.48mi |
| 2104 Canal St Unit 3165 Houston, TX | 3.0 | 2.0 | 1163 | $1,782 | $1.53 | 0d | 1 | 1.48mi |
| 2104 Canal St Unit 2112 Houston, TX | 2.0 | 2.0 | 1052 | $1,228 | $1.17 | 0d | 1 | 1.48mi |
| 2104 Canal St Unit 2141 Houston, TX | 2.0 | 2.0 | 1052 | $1,586 | $1.51 | 14d | 1 | 1.48mi |
| 2104 Canal St Unit 2174 Houston, TX | 2.0 | 2.0 | 1052 | $1,279 | $1.22 | 13d | 1 | 1.48mi |
| 2104 Canal St Unit 2161 Houston, TX | 2.0 | 2.0 | 1052 | $1,268 | $1.21 | 12d | 1 | 1.48mi |
| 2104 Canal St Unit 3174 Houston, TX | 3.0 | 2.0 | 1163 | $1,822 | $1.57 | 12d | 1 | 1.48mi |
| 2104 Canal St Unit 2137 Houston, TX | 3.0 | 2.0 | 1163 | $1,833 | $1.58 | 13d | 1 | 1.48mi |
| 2104 Canal St Apt 422 Houston, TX | 2.0 | 2.0 | 1052 | $1,244 | $1.18 | 9d | 1 | 1.48mi |
Listing history 19 events
-
2026-06-16days on market $359,900 Pending 14 DOM
-
2026-06-15days on market $359,900 Pending 13 DOM
-
2026-06-13statusdays on market $359,900 Pending 11 DOM
-
2026-06-09days on market $359,900 Active 7 DOM
-
2026-06-08days on market $359,900 Active 6 DOM
-
2026-06-07days on market $359,900 Active 5 DOM
-
2026-06-04days on market $359,900 Active 2 DOM
-
2026-06-02days on market $359,900 Active 1 DOM
-
2026-06-01days on market $359,900 Active 26 DOM
-
2026-05-31days on market $359,900 Active 25 DOM
-
2026-05-06$359,900 Active 984-char remark
-
2026-05-06historical
-
2026-04-25historical
-
2026-04-23$369,900 Active
-
2026-03-09$369,900 Active
-
2026-03-09historical
-
2026-02-11$379,900 Active
-
2026-02-11historical
-
2026-01-15$389,900 Active
ⓘ Source: listings_history table (triggers on properties + properties_extension) + one-shot
backfill from property_details.listing_events for pre-trigger history.
Climate risk First Street
- Flood 1/10 Low FEMA zone X (unshaded) · 0% chance over 30 yrs
- Wildfire 1/10 Low
- Heat 9/10 Extreme 7 d/yr ≥109°F today · 25 d/yr by 30 yrs out
- Wind 9/10 Extreme 99% chance of damaging wind over 30 yrs
- Air quality 2/10 Low 2 unhealthy d/yr today · 2 by 30 yrs out
Nearby sold comps map
Loading sold comps map…
Walkable amenities ~0.75 mi
Loading nearby amenities…
Taxation est. · year 1
- Rental income
- $24,827
- − Mortgage interest
- −$21,849
- − Property taxes
- −$5,851
- − Insurance
- −$1,950
- − Repairs & maintenance
- −$1,986
- − Management
- −$1,986
- − Depreciation
- −$11,347
- Taxable loss
- −$20,143
- Est. tax savings @ 24.0%
- +$4,834
- After-tax cash flow
- $-7,899/yr
For passive investors: Depreciation is non-cash, so a rental often shows a tax loss while cash-flowing — sheltering income. Rental losses are passive: they offset passive income freely, and up to $25,000/yr can offset ordinary (W-2) income if you actively participate and your MAGI is under $100k (phasing out to $0 by $150k); unused losses carry forward. On sale, claimed depreciation is recaptured at up to 25%, and gains may owe capital-gains tax (a 1031 exchange can defer both). Figures are a year-1 estimate at your 24.0% rate — not tax advice; consult a CPA.
Condition & rehab AI · 6 photos
This new construction home in East Downtown Houston is in excellent condition with no visible repairs needed. It offers a great opportunity for investors looking to maximize both resale and rental value.
Value-add opportunities
- Both Painting the exterior — Fresh paint can enhance curb appeal and property value
- Both Landscaping improvements — Enhanced landscaping can improve curb appeal and attract potential buyers
- Both Interior touch-ups — Fresh paint and minor touch-ups can refresh the interior and make it more appealing
Renovation cost estimate screening
Value-add ROI direction
- Both Painting the exterior — Fresh paint can enhance curb appeal and property value ↑
- Both Landscaping improvements — Enhanced landscaping can improve curb appeal and attract potential buyers ↑
- Both Interior touch-ups — Fresh paint and minor touch-ups can refresh the interior and make it more appealing ↑
ⓘ Cost ranges are severity-bucket heuristics (US national rule-of-thumb). Get contractor quotes + a written scope before underwriting a rehab budget.
Schools (NCES district)
- District
- Houston ISD
- NCES district ID
- 4823640
- Math proficiency
- 27% ▼ -18.00%
- Reading proficiency
- 35% ▼ -6.00%
- Median HH income
- $46,054
- Composite
- 26.63/100
- National rank
- #7173
- State rank
- #593 of 826 in TX
Livability — Houston
- Score
- 74/100
- State rank
- #184
- US rank
- #4771
Category grades
Schools grade is shown separately in the Schools card above.
Census & demographics
- Census place
- Houston, TX
- County
- Harris County · 4,702,590 people
- City population
- 3,226,434
- Metro
- Houston-The Woodlands-Sugar Land, TX
- Population (ZIP)
- 14,940
- Household income
- $50,133
- Rent vs Own
- Severe rent burden
- 655.0
Population outlook (Harris County) Hauer SSP2
- Today (2025)
- 5,571,493 people
- By 2030
- 6,089,821 · +9.3%
- By 2040
- 7,142,806 · +28.2%
- By 2050
- 8,185,864 · +46.9%
- By 2075
- 10,574,329 · +89.8%
- By 2100
- 12,109,958 · +117.4%
Race, ethnicity, and origin ACS 2023
- Neighborhood character
- Predominantly Hispanic (88%)
- Race & ethnicity
- Hispanic / Latino 88% Two or more races 29% White 7% Black 3%
- Hispanic origin (detail)
- Mexican 81%
- Foreign-born
- 33% · Canada
- Languages at home
- 24% English-only · Spanish 76%
Political lean MEDSL · Harris
- 2024 margin
- Lean D (+5.5) · D 52.0% · R 46.4% · Other 1.6%
- 2008→2024 swing
- +3.9pp toward D · 2008: 1.6pp · 2024: 5.5pp
- All cycles
- 2024: D+5.5 2020: D+13.3 2016: D+12.4 2012: D+0.1 2008: D+1.6
Not yet ingested
- Civics
- —
Market trends
- HPI YoY
- ▲ 68.18%
- Current HPI
- 295.1198
- Rent YoY
- ▼ -2.93%
- Metro
- Houston-The Woodlands-Sugar Land, TX
- State GDP YoY
- ▲ 3.95%
- F500 in state
- 110
Industry mix (Fortune 500 HQ in TX)
| Industry | F500 HQs | Revenue |
|---|---|---|
| Energy | 16 | $1,198B |
|
||
| Technology | 5 | $198B |
|
||
| Engineering / Construction | 4 | $72B |
|
||
| Energy Services | 3 | $60B |
|
||
| Utilities | 3 | $41B |
|
||
| Healthcare | 2 | $330B |
|
||
Price history
-7.7% since first listed13 events — show timeline
- 2026-06-17 Pending — HARMLS
- 2026-06-10 Pending — HARMLS
- 2026-06-02 Listing Removed — HARMLS
- 2026-06-02 Listed $359,900 HARMLS
- 2026-05-06 Listing Removed — HARMLS
- 2026-05-06 Listed $359,900 HARMLS
- 2026-04-25 Listing Removed — HARMLS
- 2026-04-23 Listed $369,900 HARMLS
- 2026-03-09 Listing Removed — HARMLS
- 2026-03-09 Listed $369,900 HARMLS
- 2026-02-11 Listing Removed — HARMLS
- 2026-02-11 Listed $379,900 HARMLS
- 2026-01-15 Listed $389,900 HARMLS
Cash-flow waterfall
monthlySold comps — $/sqft
last 12 mo · ≤1 miLoading sold comps…