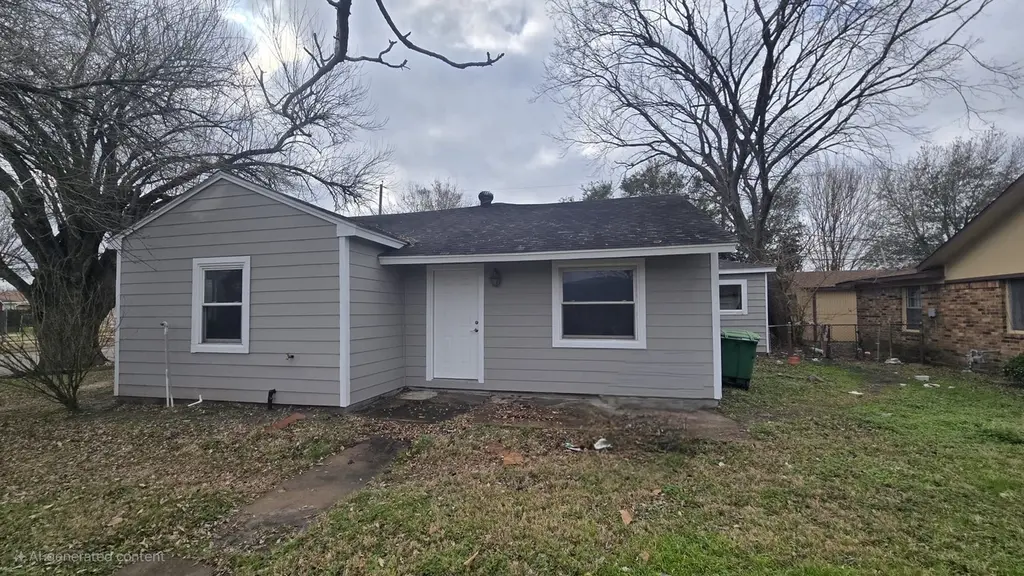
8654 Tilgham St · Houston, TX
Flood risk 6/10 · Moderate
- FEMA flood zone
- X (unshaded)
- Chance of flooding over 30 yrs
- 0.73%
- Est. flood insurance / yr
- $507 – $1,088
Fire risk 3/10 · Minor
- Est. fire insurance / yr
- $1,222 – $2,270
Heat risk 9/10 · Severe
- Hot days now (above 110°F)
- 7 days/yr
- Hot days in 30 yrs
- 24 days/yr
Wind risk 9/10 · Severe
- Chance of severe wind over 30 yrs
- 99.0%
Air-quality risk 3/10 · Minor
- Unhealthy air days now
- 2 days/yr
- Unhealthy air days in 30 yrs
- 3 days/yr
Risk factors via First Street. Map © Google.
Why this score? — see what drove the D grade
The composite is a weighted blend of 9 inputs, each scored 0–100. Each bar is that input's sub-score; the figure is the points it added to the 100-point composite (weight × sub-score).
- Appreciation +10.0/10.0
- ARV discount +7.8/15.0
- Cash flow +7.4/30.0
- Livability +3.7/5.0
- 1% rule +3.4/10.0
- Schools +2.7/10.0
- Rent growth +2.5/5.0
- Condition / age +2.5/5.0
- DSCR +1.6/10.0
$195,000
🖨 Deal sheet (PDF) 📄 Offer letter ✓ Due diligence
Listing remarks
Step into this beautifully remodeled 4-bedroom, 2-bathroom home, offering 1,656 sq. ft. of modern living space. Every detail has been thoughtfully updated, including stylish flooring, sleek bathrooms, and a contemporary kitchen with fresh finishes. Situated on a spacious corner lot (6,901 sq. ft. ), this property provides ample outdoor space for activities and entertaining. Conveniently located with easy access to major highways and downtown Houston, this home is perfect for families or investors looking for a move-in-ready property. Don’t miss your chance—schedule a showing today!
Key facts
- 6,899 sq ft lot
- Built 1955
- Listed 52 days
Property features AI
Exterior
- Utilities: Public water; Public sewer
- Home design: Residential property; Single-story (first floor entry)
- Construction: Built in 1955; Wood siding; Slab foundation; Composition roof
- Exterior features: Subdivision lot
Interior
- Kitchen: Kitchen (first floor)
- Bedrooms: Primary bedroom (first floor); Bedroom (first floor) — 12x10; Bedroom (first floor) — 12x10; Bedroom (first floor) — 10x14
- Bathrooms: 2 full bathrooms; Primary bathroom (first floor)
- Heating & cooling: Central heating (gas); Central air conditioning (gas)
- Interior features: Den; Living room
- Laundry & utility: Utility room (first floor)
Neighborhood map
What this means for you Summary
Snapshot
- This is a 4-bed/2.0-bath single-family listed at $195k.
Deal economics
- At list price, monthly cash flow is $-248 ($-3k/yr) — negative.
- To cash-flow at today's rent, offer at most $151k (22.4% below list).
- To meet the 1% rule (rent ≥ 1% of price), the offer needs to be $163k (16.3% below list).
- Recommended offer: $151k (22.4% below list) — sets the bar for cash-flow.
- Cap rate 4.8% vs local median 3.2% in Houston — top-decile yield for the area; either an underpriced asset or a hidden risk that comps aren't pricing in. Stress-test before assuming the spread holds.
Location & tenants
- Location reads 74/100 on livability (#184 in TX, #4,771 nationally) — a middle-class / working-renter tenant base. Strengths: amenities A+, cost of living A+, housing A+; Watch: crime F.
- Houston ISD (urban): math 27% / reading 35% proficiency, ranked #593 of 826 in TX (top 72%) — families likely to look elsewhere, expect single-tenant / working-renter base with shorter leases; 71% free/reduced lunch — lower-income household profile, screen leases tightly.
- Zoned schools: Pleasantville El (math 8% / reading 22%, grade F, #4,021 of 4,322 statewide, top 94%, 233 students, 97% FRL); Holland Middle (math 10% / reading 16%, grade F, #1,609 of 1,662 statewide, top 97%, 644 students, 98% FRL); Furr H S (math 8% / reading 25%, grade F, #1,497 of 1,632 statewide, top 92%, 1,173 students, 96% FRL) — zoned schools average 97% FRL vs 71% district-wide (26 pts higher); higher-poverty schools than district average — tighter screening recommended.
- Zoned-school proficiency averages 15% at this address vs 31% district-wide (-16 pts) — the specific schools serving this property underperform the Houston ISD average; the district grade overstates school quality for this exact location.
- Market conditions: 154 active listings in the ZIP; 6 comparable units currently listed for rent nearby; rentals lingering (median 46d on market — plan ~5-8 weeks vacancy on turnover, expect pricing pressure); 50% of comp listings sitting > 30 days — soft ceiling on asking rent; 29,883 units permitted in Harris County in 2024 (8,621 in 5+ unit buildings).
Forward outlook
- In year one you build about $21k of equity ($1k loan paydown + $20k appreciation (10.0% local appreciation)).
- Harris County population projected at +47% by 2050 — long-run rental-demand tailwind backs the buy-and-hold thesis.
- By year 2, paydown + projected appreciation supports a ~$34k cash-out refi (75% LTV) — recoverable capital for the next deal without selling this one.
Negotiation context
- It's been on market 52 days — a 3% lower offer ($189k) is reasonable based on typical stale-listing flexibility.
- 7 sale attempts since 2y ago with the ask held roughly flat each time — persistent listings suggest the price (not the market) is what's stuck; bring a comps-based counter.
Risks & watch-outs
- Watch-outs: property tax is 2.7% of price; built in 1955 — expect roof / HVAC / electrical / plumbing capex.
- Climate carrying-cost: major flood risk; severe wind risk, 99% chance of damaging wind over 30y; extreme-heat days projected 7→24/yr by 2055 (HVAC capex compounding) — expect insurance premiums to compound above CPI over the hold.
Questions for the listing agent
- What do current leases actually rent for vs. the listed asking? Can we see a recent rent roll and the last 12 months of T-12 income?
- It's been on market 52 days. Have you received any prior offers? Is the seller open to a 22% concession, seller financing, or rate buy-down credit?
- Built in 1955 — when were the roof, HVAC, electrical panel, plumbing, and water heater last replaced?
- Property tax is high relative to price — has the assessment been appealed recently, and will the sale trigger a re-assessment?
- Is there a deadline driving the sale (1031 exchange, divorce, estate, relocation)? That informs how much negotiation room exists.
- Schools are D-rated, which usually means shorter tenancies and higher turnover. Who's the typical renter profile here, and what's been the actual vacancy rate?
- Crime grade is F in this area — have there been break-ins, vandalism, or insurance claims at this property in the last 3 years? What carrier currently insures it and at what premium?
- The area grade is low — what's the realistic commute time and amenity access for the typical tenant pool here? Any planned neighborhood developments (good or bad) we should know about?
- What's the average days-on-market for RENTAL listings here right now (not sales)? A rising rental-DOM trend means longer vacancies and softer asking-rent achievability than the comps imply.
- What's the recent tenant-quality profile in this submarket — average credit score on applications, eviction rate, late-payment / NSF rate, and stable-employment percentage? A property-management company in the area should have these aggregated.
- How much new for-sale + rental construction is in the pipeline within 1–3 miles? Heavy new supply typically softens prices + rents 12–24 months out; constrained supply supports both.
Investment metrics
- 1% rule
- 0.84% ✗
- Cap rate
- 4.77%
- Cash-on-cash
- -5.44%
- DSCR
- 0.76
- GRM
- 10.0
CMA / ARV
- ARV (median comp)
- $196,373
- List price
- $195,000
- Delta
- -0.70%
- Verdict
- FAIR
- Comps
- 20 within 1.0 mi
Show comp detail 12 sales within ~0.75 mi
| Address | Dist | Beds/Ba | Sqft | Sold | Price | $/sf | Match |
|---|---|---|---|---|---|---|---|
| 8702 Josie St | 0.21mi | 4/2.0 | 1,602 (-3%) | 2mo | $208,000 | $130 | 83 |
| 8727 Othello St | 0.30mi | 4/2.0 | 1,627 (-2%) | 11mo | $164,999 | $101 | 74 |
| 8754 Guinevere St | 0.40mi | 3/2.0 (-1) | 1,620 (-2%) | 4mo | $234,900 | $145 | 70 |
| 8743 Pattibob St | 0.18mi | 3/2.0 (-1) | 1,576 (-5%) | 12mo | $208,000 | $132 | 68 |
| 8726 Tilgham St | 0.10mi | 4/2.0 | 1,456 (-12%) | 11mo | $189,990 | $130 | 66 |
| 8530 Guinevere St | 0.45mi | 3/2.0 (-1) | 1,597 (-4%) | 4mo | $229,900 | $144 | 65 |
| 1442 Silverdale St | 0.30mi | 3/3.0 (-1) | 1,747 (+6%) | 12mo | $140,000 | $80 | 57 |
| 1426 Laurentide St | 0.24mi | 3/1.5 (-1) | 1,500 (-9%) | 13mo | $153,450 | $102 | 55 |
| 8527 Bucroft St | 0.57mi | 4/2.0 | 1,504 (-9%) | 7mo | $189,900 | $126 | 52 |
| 1403 Pleasantville Dr | 0.33mi | 4/2.0 | 1,860 (+12%) | 15mo | $265,000 | $142 | 51 |
| 8522 Richcroft St | 0.65mi | 4/2.0 | 1,839 (+11%) | 10mo | $150,000 | $82 | 43 |
| 8766 Flossie Mae St | 0.33mi | 3/1.0 (-1) | 1,412 (-15%) | 12mo | $194,750 | $138 | 41 |
Match score weights: distance 35% · size 25% · config 20% · recency 20%. Top-matched comps best support the ARV.
Projected returns pro-forma
10.0% appreciation · 3.0% rent growth · sell at horizon
- IRR
- 20.4%
- Equity multiple
- 2.66×
- Total profit
- $90,566
- Equity at exit
- $175,671
- IRR
- 18.6%
- Equity multiple
- 6.12×
- Total profit
- $279,391
- Equity at exit
- $378,842
Cash invested: $54,600 (down + closing). Projections, not guarantees.
Landlord ↔ Tenant lean methodology
- Overall (STATE)
- 87 Strongly Landlord-Friendly
- State Texas
- 87 Strongly Landlord-Friendly · R+5
- County
- — inherits STATE
- City
- — inherits STATE
ZIP-level market 77029
- Home prices YoY
- 7.2%
- Active inventory
- 154
- Price-to-rent
- 10.0×
Monthly cashflow live
- Estimated rent
- $1,633 high interval (Pro) →
- Mortgage (P&I)
- −$1,023
- Tax from tax record
- −$434 /mo · $5,208/yr
- Insurance
- −$81
- HOA
- −$0
- Vacancy / Maint / Mgmt
- −$343
- Net cashflow
- $-248
Break-even live
Sensitivity live
| Price | -10% $-137 | -5% $-193 | +0% $-248 | +5% $-303 | +10% $-358 |
|---|---|---|---|---|---|
| Rent | -10% $-377 | -5% $-312 | +0% $-248 | +5% $-183 | +10% $-119 |
| Rate | -1.0pp $-150 | -0.5pp $-198 | base $-248 | +0.5pp $-298 | +1.0pp $-350 |
UW: 25.0% down · 7.5% · 30yr · 1.5% tax · 5.0% vac · 8.0% maint · 8.0% mgmt
Financing live
Cash to close
- Down payment
- $48,750
- Closing costs
- $5,850
- Reserves months
- —
- Total cash needed
- —
Loan-product check · same deal, 3 products live
Conventional
25% down · 7.5% · 30yr
- Down + closing
- —
- Monthly P&I
- —
- Monthly cashflow
- —
- DSCR
- —
- Eligible?
- —
Personal DTI + credit; lowest rate.
DSCR
20% down · 8.5% · 30yr
- Down + closing
- —
- Monthly P&I
- —
- Monthly cashflow
- —
- DSCR
- —
- Eligible?
- —
No personal income docs; deal must DSCR.
Hard money
10% down · 12.0% · 12mo
- Down + closing
- —
- Monthly P&I
- —
- Monthly cashflow
- —
- DSCR
- —
- Eligible?
- —
Short-term bridge; refi at stabilization.
Rent comps 6 comps
| Address | Beds | Baths | Sqft | Rent | $/sqft | DOM | Units | Dist |
|---|---|---|---|---|---|---|---|---|
| 8735 Cowart St Houston, TX | 3.0 | 1.0 | 1136 | $1,000 | $0.88 | 45d | 1 | 0.10mi |
| 1629 Demaree Ln Houston, TX | 4.0 | 2.0 | 1520 | $2,225 | $1.46 | 26d | 1 | 0.51mi |
| 9709 Cargill St Houston, TX | 3.0 | 2.0 | 1184 | $2,300 | $1.94 | 45d | 1 | 0.90mi |
| 2203 Pearl St Houston, TX | 3.0 | 2.0 | 1298 | $1,570 | $1.21 | 15d | 1 | 1.04mi |
| 9710 Tuffly St Houston, TX | 3.0 | 2.0 | 1275 | $1,795 | $1.41 | 26d | 1 | 1.04mi |
| 9821 Turnbow St Unit C Houston, TX | 3.0 | 2.0 | 1140 | $1,720 | $1.51 | 45d | 1 | 1.34mi |
Listing history 29 events
-
2026-06-21days on market $195,000 Active 52 DOM
-
2026-06-18days on market $195,000 Active 49 DOM
-
2026-06-17days on market $195,000 Active 48 DOM
-
2026-06-16days on market $195,000 Active 47 DOM
-
2026-06-15days on market $195,000 Active 46 DOM
-
2026-06-13days on market $195,000 Active 44 DOM
-
2026-06-10days on market $195,000 Active 40 DOM
-
2026-06-08days on market $195,000 Active 39 DOM
-
2026-06-07pricedays on market $195,000 Active 38 DOM
-
2026-06-04days on market $197,500 Active 35 DOM
-
2026-06-01days on market $197,500 Active 32 DOM
-
2026-05-31days on market $197,500 Active 31 DOM
-
2026-04-30$197,500 Active 599-char remark
-
2025-08-11historical
-
2025-08-04soldstatus
-
2025-07-16historical $1,650
-
2025-07-08$1,650
-
2025-07-06$238,500 Active
-
2025-06-30historical $1,650
-
2025-06-30historical
-
2025-05-17$1,650
-
2025-05-16historical $1,700
-
2025-05-03price $1,700
-
2025-04-08$1,800
-
2025-02-04$238,500 Active
-
2024-07-30historical
-
2024-06-06$238,500 Active
-
2023-05-04soldstatus
-
2001-11-15soldstatus
ⓘ Source: listings_history table (triggers on properties + properties_extension) + one-shot
backfill from property_details.listing_events for pre-trigger history.
Tax reassessment forecast TX · Resets to sale price
- Current annual tax
- $5,208 · $434/mo
- Projected year-2 tax
- $5,208 · $434/mo
- Expected delta
- $0/yr ($0/mo · 0.0%)
ⓘ Screening estimate from a state-policy table — verify with the county assessor before closing.
Climate risk First Street
- Flood 6/10 Major FEMA zone X (unshaded) · 73% chance over 30 yrs
- Wildfire 3/10 Moderate
- Heat 9/10 Extreme 7 d/yr ≥110°F today · 24 d/yr by 30 yrs out
- Wind 9/10 Extreme 99% chance of damaging wind over 30 yrs
- Air quality 3/10 Moderate 2 unhealthy d/yr today · 3 by 30 yrs out
Nearby sold comps map
Loading sold comps map…
Walkable amenities ~0.75 mi
Loading nearby amenities…
Taxation est. · year 1
- Rental income
- $19,597
- − Mortgage interest
- −$10,923
- − Property taxes
- −$5,208
- − Insurance
- −$975
- − Repairs & maintenance
- −$1,568
- − Management
- −$1,568
- − Depreciation
- −$5,673
- Taxable loss
- −$6,317
- Est. tax savings @ 24.0%
- +$1,516
- After-tax cash flow
- $-1,457/yr
For passive investors: Depreciation is non-cash, so a rental often shows a tax loss while cash-flowing — sheltering income. Rental losses are passive: they offset passive income freely, and up to $25,000/yr can offset ordinary (W-2) income if you actively participate and your MAGI is under $100k (phasing out to $0 by $150k); unused losses carry forward. On sale, claimed depreciation is recaptured at up to 25%, and gains may owe capital-gains tax (a 1031 exchange can defer both). Figures are a year-1 estimate at your 24.0% rate — not tax advice; consult a CPA.
Schools (NCES district)
- District
- Houston ISD
- NCES district ID
- 4823640
- Math proficiency
- 27% ▼ -18.00%
- Reading proficiency
- 35% ▼ -6.00%
- Median HH income
- $46,054
- Composite
- 26.63/100
- National rank
- #7173
- State rank
- #593 of 826 in TX
Livability — Houston
- Score
- 74/100
- State rank
- #184
- US rank
- #4771
Category grades
Schools grade is shown separately in the Schools card above.
Census & demographics
- Census place
- Houston, TX
- County
- Harris County · 4,702,590 people
- City population
- 3,226,434
- Metro
- Houston-The Woodlands-Sugar Land, TX
- Population (ZIP)
- 16,154
- Household income
- $48,279
- Rent vs Own
- Severe rent burden
- 457.0
Population outlook (Harris County) Hauer SSP2
- Today (2025)
- 5,571,493 people
- By 2030
- 6,089,821 · +9.3%
- By 2040
- 7,142,806 · +28.2%
- By 2050
- 8,185,864 · +46.9%
- By 2075
- 10,574,329 · +89.8%
- By 2100
- 12,109,958 · +117.4%
Race, ethnicity, and origin ACS 2023
- Neighborhood character
- Predominantly Hispanic (72%)
- Race & ethnicity
- Hispanic / Latino 72% Two or more races 32% Black 22% White 5%
- Hispanic origin (detail)
- Mexican 66%
- Foreign-born
- 31% · Canada
- Languages at home
- 39% English-only · Spanish 61%
Political lean MEDSL · Harris
- 2024 margin
- Lean D (+5.5) · D 52.0% · R 46.4% · Other 1.6%
- 2008→2024 swing
- +3.9pp toward D · 2008: 1.6pp · 2024: 5.5pp
- All cycles
- 2024: D+5.5 2020: D+13.3 2016: D+12.4 2012: D+0.1 2008: D+1.6
Not yet ingested
- Civics
- —
Market trends
- HPI YoY
- ▲ 18.53%
- Current HPI
- 276.1811
- Rent YoY
- —
- Metro
- Houston-The Woodlands-Sugar Land, TX
- State GDP YoY
- ▲ 3.95%
- F500 in state
- 110
Industry mix (Fortune 500 HQ in TX)
| Industry | F500 HQs | Revenue |
|---|---|---|
| Energy | 16 | $1,198B |
|
||
| Technology | 5 | $198B |
|
||
| Engineering / Construction | 4 | $72B |
|
||
| Energy Services | 3 | $60B |
|
||
| Utilities | 3 | $41B |
|
||
| Healthcare | 2 | $330B |
|
||
Price history
-18.2% since first listed18 events — show timeline
- 2026-06-05 Price Changed $195,000 HARMLS
- 2026-04-30 Listed $197,500 HARMLS
- 2025-08-11 Listing Removed — HARMLS
- 2025-08-04 Sold (Public Records) — Public Records
- 2025-07-16 Rental Removed $1,650 HARMLS
- 2025-07-08 Listed for Rent $1,650 HARMLS
- 2025-07-06 Listed $238,500 HARMLS
- 2025-06-30 Rental Removed $1,650 HARMLS
- 2025-06-30 Listing Removed — HARMLS
- 2025-05-17 Listed for Rent $1,650 HARMLS
- 2025-05-16 Rental Removed $1,700 HARMLS
- 2025-05-03 Price Changed $1,700 HARMLS
- 2025-04-08 Listed for Rent $1,800 HARMLS
- 2025-02-04 Listed $238,500 HARMLS
- 2024-07-30 Listing Removed — HARMLS
- 2024-06-06 Listed $238,500 HARMLS
- 2023-05-04 Sold (Public Records) — Public Records
- 2001-11-15 Sold (Public Records) — Public Records
Property tax history
+6.4%/yrLatest (2025): $5,208 · +71.6% YoY. Source: county tax records.
Cash-flow waterfall
monthlySold comps — $/sqft
last 12 mo · ≤1 miLoading sold comps…