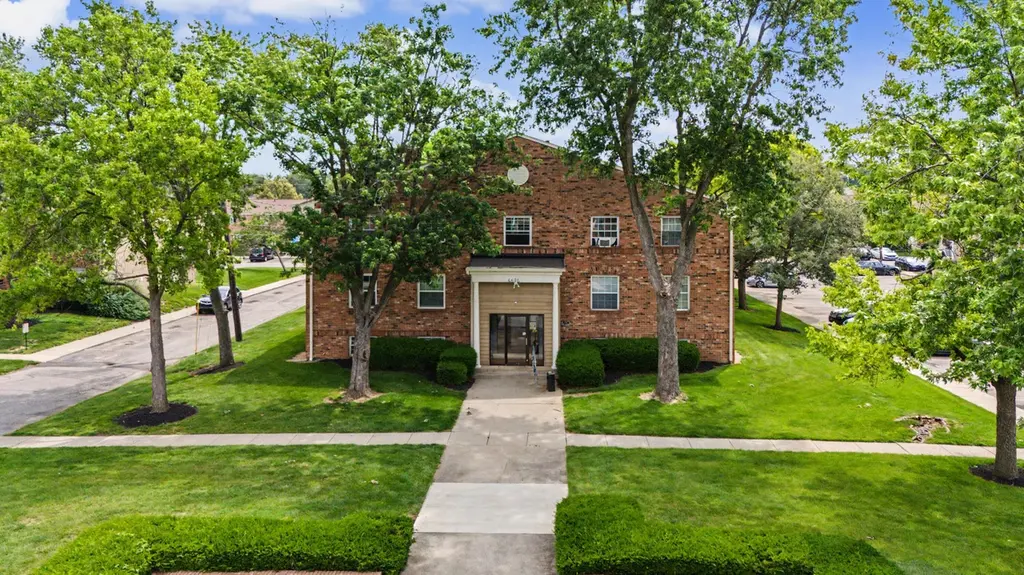
4696 Tarryton Ct S Unit 3H · Lincoln Village, OH
Flood risk 1/10 · Minimal
- FEMA flood zone
- X (unshaded)
- Chance of flooding over 30 yrs
- 0.0%
- Est. flood insurance / yr
- $507 – $1,088
Fire risk 1/10 · Minimal
- Est. fire insurance / yr
- $713 – $1,323
Heat risk 4/10 · Minor
- Hot days now (above 101°F)
- 7 days/yr
- Hot days in 30 yrs
- 18 days/yr
Wind risk 2/10 · Minimal
- Chance of severe wind over 30 yrs
- 1.0%
Air-quality risk 3/10 · Minor
- Unhealthy air days now
- 1 days/yr
- Unhealthy air days in 30 yrs
- 4 days/yr
Risk factors via First Street. Map © Google.
Why this score? — see what drove the D grade
The composite is a weighted blend of 9 inputs, each scored 0–100. Each bar is that input's sub-score; the figure is the points it added to the 100-point composite (weight × sub-score).
- Cash flow +12.1/30.0
- ARV discount +7.5/15.0
- 1% rule +4.8/10.0
- Livability +4.2/5.0
- Schools +3.8/10.0
- DSCR +3.6/10.0
- Condition / age +2.5/5.0
- Rent growth +2.3/5.0
- Appreciation +0.0/10.0
$110,000
🖨 Deal sheet 📄 Offer letter ✓ Due diligence
Listing remarks MLS
Looking for a cozy, very affordable condo to call your own? Then welcome home. This secure 3rd floor, 1 bedroom, 1 bath condo had new flooring and a new refrigerator in 2016, as well as a new water heater in 2015. Extra deep window sills give the rooms character, as well as a place to read a book or dream of summer and swimming in the pool next door. This complex also has a clubhouse, a playground, a basketball court and even a laundry on the ground floor. New carpet has been ordered for the living room and bedroom and will be installed prior to close. The HOA just painted the hallways and resurfaced the parking lot (and your reserved space!) You are just blocks away from shopping or jumping onto 270. What more could you need?
Key facts
- New ac unit
- Community amenities
- Updated interior
Tags
Property features AI
Finance
- Other: Home warranty included
- HOA & community: Homeowners association with monthly fee of $180; HOA covers lawn care, insurance, trash, and snow removal; Community amenities include pool, clubhouse, basketball court, and sidewalks
Exterior
- Parking: Assigned parking; One carport space
- Utilities: Public water; Public sewer
- Home design: Condominium; One story; Built in 1967; No shared common walls or has 2+ common walls (building configuration)
- Construction: Block foundation (1967)
- Exterior features: Block foundation
Interior
- Bedrooms: One main-level bedroom
- Flooring: Wood flooring; Laminate flooring; Carpet; Ceramic/porcelain tile
- Bathrooms: One full bathroom
- Heating & cooling: Baseboard heating; Hot water heating; Wall unit cooling
- Interior features: Open living area; 784 living area (as reported)
Neighborhood map
What this means for you Summary
Snapshot
- This is a 1-bed/1.0-bath condo listed at $110k.
Deal economics
- At list price, monthly cash flow is $-24 ($-292/yr) — negative.
- To cash-flow at today's rent, offer at most $106k (3.9% below list).
- To meet the 1% rule (rent ≥ 1% of price), the offer needs to be $108k (1.9% below list).
- Recommended offer: $106k (3.9% below list) — sets the bar for cash-flow.
- Cap rate 6.0% vs local median 4.0% in Lincoln Village — top-decile yield for the area; either an underpriced asset or a hidden risk that comps aren't pricing in. Stress-test before assuming the spread holds.
Location & tenants
- Location reads 85/100 on livability (#42 in OH, #549 nationally) — a professional / high-income tenant draw. Strengths: commute A+, cost of living A+, housing A+; Watch: employment C-.
- South-Western City (suburban): math 40% / reading 48% proficiency, ranked #500 of 656 in OH (top 76%) — families likely to look elsewhere, expect single-tenant / working-renter base with shorter leases.
- Market conditions: Rents soft (-0.6%/yr); 192 active listings in the ZIP; 16 comparable units currently listed for rent nearby; rentals at typical pace (median 24d on market — plan ~3-4 weeks tenant-placement turnaround); 44% of comp listings sitting > 30 days — soft ceiling on asking rent; 8,139 units permitted in Franklin County in 2024 (5,940 in 5+ unit buildings).
Forward outlook
- Local home prices are declining (-3.0%/yr); year-one equity from $761 of loan paydown is wiped out by about $3k of value loss. Plan a longer hold.
- Franklin County population projected at +34% by 2050 — long-run rental-demand tailwind backs the buy-and-hold thesis.
Negotiation context
- Only 6 days on market — expect competitive offers; lowballing is unlikely to land.
- 4 sale attempts since 19y ago with the ask held roughly flat each time — persistent listings suggest the price (not the market) is what's stuck; bring a comps-based counter.
- Current owner paid $50k; list at $110k implies a 120% gain — meaningful room to come down on a strong offer.
Questions for the listing agent
- What do current leases actually rent for vs. the listed asking? Can we see a recent rent roll and the last 12 months of T-12 income?
- Built in 1967 — when were the roof, HVAC, electrical panel, plumbing, and water heater last replaced?
- What does the HOA fee cover, when was the last increase, and are there any pending special assessments or reserve-fund shortfalls?
- Any open or pending special assessments — roof, HVAC, plumbing, elevator, façade? What's the per-unit balance and payoff schedule, and is the seller paying it off at close or rolling it to the buyer?
- Is there a deadline driving the sale (1031 exchange, divorce, estate, relocation)? That informs how much negotiation room exists.
- The area grade is low — what's the realistic commute time and amenity access for the typical tenant pool here? Any planned neighborhood developments (good or bad) we should know about?
- What's the average days-on-market for RENTAL listings here right now (not sales)? A rising rental-DOM trend means longer vacancies and softer asking-rent achievability than the comps imply.
- What's the recent tenant-quality profile in this submarket — average credit score on applications, eviction rate, late-payment / NSF rate, and stable-employment percentage? A property-management company in the area should have these aggregated.
- How much new apartment / multifamily construction is in the pipeline within 1–3 miles? Heavy new supply (>2% of stock underway) typically softens rents 12–24 months out; light construction supports rent growth.
Investment metrics
- 1% rule
- 0.98% ✗
- Cap rate
- 6.03%
- Cash-on-cash
- -0.95%
- DSCR
- 0.96
- GRM
- 8.5
CMA / ARV
No comps found within radius.
Projected returns pro-forma
-3.0% appreciation · 0.0% rent growth · sell at horizon
- IRR
- -21.7%
- Equity multiple
- 0.27×
- Total profit
- $-22,447
- Equity at exit
- $16,401
- IRR
- -27.2%
- Equity multiple
- -0.08×
- Total profit
- $-33,405
- Equity at exit
- $9,511
Cash invested: $30,800 (down + closing). Projections, not guarantees.
Landlord ↔ Tenant lean methodology
- Overall (STATE)
- 73 Landlord-Friendly
- State Ohio
- 73 Landlord-Friendly · R+6
- County
- — inherits STATE
- City
- — inherits STATE
ZIP-level market 43228
- Rents YoY
- -0.6%
- Active inventory
- 192
- Price-to-rent
- 8.5×
Monthly cashflow live
- Estimated rent
- $1,079 high interval (Pro) →
- Mortgage (P&I)
- −$577
- Tax from tax record
- −$74 /mo · $891/yr
- Insurance
- −$46
- HOA
- −$180
- Vacancy / Maint / Mgmt
- −$227
- Net cashflow
- $-24
Break-even live
UW: 25.0% down · 7.5% · 30yr · 1.5% tax · 5.0% vac · 8.0% maint · 8.0% mgmt
Financing live
Cash to close
- Down payment
- $27,500
- Closing costs
- $3,300
- Reserves months
- —
- Total cash needed
- —
Loan-product check · same deal, 3 products live
Conventional
25% down · 7.5% · 30yr
- Down + closing
- —
- Monthly P&I
- —
- Monthly cashflow
- —
- DSCR
- —
- Eligible?
- —
Personal DTI + credit; lowest rate.
DSCR
20% down · 8.5% · 30yr
- Down + closing
- —
- Monthly P&I
- —
- Monthly cashflow
- —
- DSCR
- —
- Eligible?
- —
No personal income docs; deal must DSCR.
Hard money
10% down · 12.0% · 12mo
- Down + closing
- —
- Monthly P&I
- —
- Monthly cashflow
- —
- DSCR
- —
- Eligible?
- —
Short-term bridge; refi at stabilization.
Rent comps 16 comps
| Address | Beds | Baths | Sqft | Rent | $/sqft | DOM | Units | Dist |
|---|---|---|---|---|---|---|---|---|
| 4696 Tarryton Ct S Columbus, OH | 2.0 | 1.0 | 852 | $949 | $1.11 | 23d | 1 | 0.00mi |
| 4696 Tarryton Ct S Columbus, OH | 1.0–2.0 | 1.0 | 818 | $900 | $1.10 | 43d | 2 | 0.00mi |
| 80 Tarryton Ct E Unit 80 Columbus, OH | 2.0 | 1.5 | 992 | $1,650 | $1.66 | 43d | 1 | 0.05mi |
| 4688 Hilton Ave Unit B Columbus, OH | 2.0 | 1.0 | 800 | $1,025 | $1.28 | 43d | 1 | 0.26mi |
| 4707 Hilton Ave Columbus, OH | 1.0 | 1.0 | 550 | $850 | $1.55 | 43d | 1 | 0.29mi |
| 4651 Hilton Ave Unit B Columbus, OH | 2.0 | 1.0 | 900 | $945 | $1.05 | 43d | 1 | 0.31mi |
| 4436 Westport Rd Columbus, OH | 2.0 | 1.0 | 866 | $1,004 | $1.16 | 21d | 7 | 0.88mi |
| 4573 Westport Rd Unit 670-201 Columbus, OH | 2.0 | 1.5 | 919 | $1,226 | $1.33 | 43d | 1 | 0.98mi |
| 4573 Westport Rd Unit 670-205 Columbus, OH | 2.0 | 1.5 | 919 | $1,471 | $1.60 | 12d | 1 | 0.98mi |
| 4573 Westport Rd Unit 690-205 Columbus, OH | 2.0 | 1.5 | 919 | $1,471 | $1.60 | 43d | 1 | 0.98mi |
| 5591 Rustling Way LN Galloway, OH | 1.0–3.0 | 1.0–2.5 | 962 | $1,205 | $1.25 | 1d | 8 | 1.18mi |
| 550 Brandenbush Ln Columbus, OH | 2.0 | 1.0 | 878 | $1,060 | $1.21 | 3d | 7 | 1.27mi |
| 71 Gaspar CIR Columbus, OH | 1.0–2.0 | 1.0–2.0 | 918 | $1,100 | $1.20 | 10d | 20 | 1.28mi |
| 5605 W Broad St Columbus, OH | 1.0–2.0 | 1.0–2.0 | 823 | $1,170 | $1.42 | 1d | 30 | 1.33mi |
| 5445 Eaglecrest Dr Galloway, OH | 1.0–2.0 | 1.0–2.0 | 800 | $930 | $1.16 | 14d | 7 | 1.42mi |
| 5500 Floral Cir S Columbus, OH | 1.0–3.0 | 1.0–2.0 | 762 | $884 | $1.16 | 3d | 22 | 1.49mi |
HOA detail condo
- Monthly dues
- $180 · $2,160/yr
- Likely covers
- waterpool
- Assessments
- None detected in remarks — confirm with the listing agent.
Listing history 6 events
-
2026-06-18days on market $110,000 Active 6 DOM
-
2026-06-17days on market $110,000 Active 5 DOM
-
2026-06-16days on market $110,000 Active 4 DOM
-
2026-06-15days on market $110,000 Active 3 DOM
-
2026-06-13remarks 699-char remark
-
2026-06-13$110,000 Active 1 DOM
ⓘ Source: listings_history table (triggers on properties + properties_extension) + one-shot
backfill from property_details.listing_events for pre-trigger history.
Tax reassessment forecast OH · Partial reset (capped growth)
- Current annual tax
- $891 · $74/mo
- Projected year-2 tax
- $1,304 · $109/mo
- Expected delta
- +$412/yr (+$34/mo · 46.2%)
ⓘ Screening estimate from a state-policy table — verify with the county assessor before closing.
Climate risk First Street
- Flood 1/10 Low FEMA zone X (unshaded) · 0% chance over 30 yrs
- Wildfire 1/10 Low
- Heat 4/10 Moderate 7 d/yr ≥101°F today · 18 d/yr by 30 yrs out
- Wind 2/10 Low 100% chance of damaging wind over 30 yrs
- Air quality 3/10 Moderate 1 unhealthy d/yr today · 4 by 30 yrs out
Nearby sold comps map
Loading sold comps map…
Walkable amenities ~0.75 mi
Loading nearby amenities…
Taxation est. · year 1
- Rental income
- $12,952
- − Mortgage interest
- −$6,162
- − Property taxes
- −$891
- − Insurance
- −$550
- − Repairs & maintenance
- −$1,036
- − Management
- −$1,036
- − HOA
- −$2,160
- − Depreciation
- −$3,200
- Taxable loss
- −$2,083
- Est. tax savings @ 24.0%
- +$500
- After-tax cash flow
- $209/yr
For passive investors: Depreciation is non-cash, so a rental often shows a tax loss while cash-flowing — sheltering income. Rental losses are passive: they offset passive income freely, and up to $25,000/yr can offset ordinary (W-2) income if you actively participate and your MAGI is under $100k (phasing out to $0 by $150k); unused losses carry forward. On sale, claimed depreciation is recaptured at up to 25%, and gains may owe capital-gains tax (a 1031 exchange can defer both). Figures are a year-1 estimate at your 24.0% rate — not tax advice; consult a CPA.
Schools (NCES district)
- District
- South-Western City
- NCES district ID
- 3904480
- Math proficiency
- 40% ▼ -18.00%
- Reading proficiency
- 48% ▼ -10.00%
- Median HH income
- $51,689
- Composite
- 37.95/100
- National rank
- #4305
- State rank
- #500 of 656 in OH
Livability — Lincoln Village
- Score
- 85/100
- State rank
- #42
- US rank
- #549
Category grades
Schools grade is shown separately in the Schools card above.
Census & demographics
- Census place
- Lincoln Village, OH
- County
- Franklin County · 1,351,780 people
- City population
- 59,077
- Metro
- Columbus, OH
- Population (ZIP)
- 59,077
- Household income
- $61,713
- Rent vs Own
- Severe rent burden
- 3284.0
Population outlook (Franklin County) Hauer SSP2
- Today (2025)
- 1,456,139 people
- By 2030
- 1,556,890 · +6.9%
- By 2040
- 1,757,349 · +20.7%
- By 2050
- 1,950,539 · +34.0%
- By 2075
- 2,376,171 · +63.2%
- By 2100
- 2,636,796 · +81.1%
Race, ethnicity, and origin ACS 2023
- Neighborhood character
- Diverse neighborhood (Simpson 0.64)
- Race & ethnicity
- White 54% Black 23% Hispanic / Latino 14% Two or more races 11% Asian 3%
- Hispanic origin (detail)
- Mexican 8% Dominican 1%
- Common ancestry
- Slovak 2% Italian 1% Romanian 1%
- Foreign-born
- 19% · Canada, Jamaica
- Languages at home
- 74% English-only · Spanish 12% Other Indo-European 1% Other Asian/Pacific 1%
Political lean MEDSL · Franklin
- 2024 margin
- Strong D (+28.4) · D 63.7% · R 35.3% · Other 1.0%
- 2008→2024 swing
- +7.7pp toward D · 2008: 20.7pp · 2024: 28.4pp
- All cycles
- 2024: D+28.4 2020: D+31.4 2016: D+25.9 2012: D+21.7 2008: D+20.7
Not yet ingested
- Civics
- —
Market trends
- HPI YoY
- ▼ -245.97%
- Current HPI
- 234.1992
- Rent YoY
- ▼ -0.63%
- Metro
- Columbus, OH
- State GDP YoY
- ▲ 1.98%
- F500 in state
- 48
Industry mix (Fortune 500 HQ in OH)
| Industry | F500 HQs | Revenue |
|---|---|---|
| Insurance | 3 | $145B |
|
||
| Industrial Machinery | 3 | $49B |
|
||
| Financial Services | 3 | $24B |
|
||
| Consumer Goods | 2 | $93B |
|
||
| Aerospace / Defense | 2 | $47B |
|
||
| Utilities | 2 | $33B |
|
||
Price history
+746.2% since first listed17 events — show timeline
- 2026-06-12 Listed $110,000 CBRMLS
- 2022-11-16 Sold (Public Records) $50,000 Public Records
- 2020-02-06 Sold (Public Records) $24,000 Public Records
- 2018-03-30 Sold (Public Records) $24,000 Public Records
- 2018-03-28 Sold (MLS) $24,000 CBRMLS
- 2018-03-16 Contingent — CBRMLS
- 2017-11-13 Listed $28,000 CBRMLS
- 2016-06-03 Sold (Public Records) $15,000 Public Records
- 2009-02-26 Sold (Public Records) $24,000 Public Records
- 2009-02-04 Listing Removed — CBRMLS
- 2008-02-18 Listed $27,000 CBRMLS
- 2007-05-31 Sold (Public Records) $24,000 Public Records
- 2007-05-25 Sold (MLS) $24,000 CBRMLS
- 2007-05-10 Listing Removed — CBRMLS
- 2007-04-21 Listed $24,900 CBRMLS
- 2004-02-24 Sold (Public Records) $19,000 Public Records
- 1997-08-20 Sold (Public Records) $13,000 Public Records
Property tax history
+5.8%/yrLatest (2024): $891 · -14.3% YoY. Source: county tax records.
Cash-flow waterfall
monthlySold comps — $/sqft
last 12 mo · ≤1 miLoading sold comps…