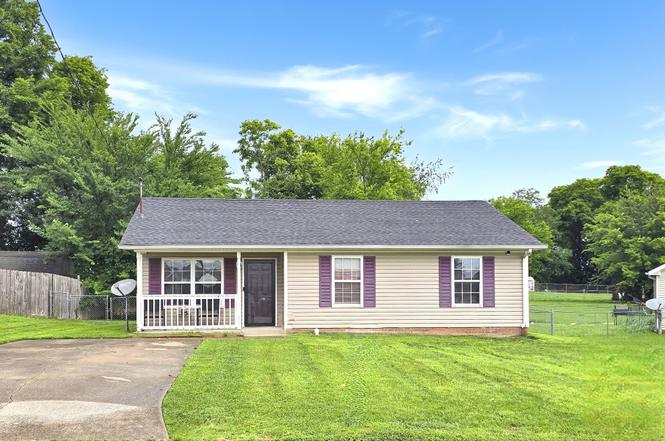
1645 Hannibal Dr · Oak Grove, KY
Flood risk 1/10 · Minimal
- FEMA flood zone
- X (unshaded)
- Chance of flooding over 30 yrs
- 0.0%
- Est. flood insurance / yr
- $507 – $1,088
Fire risk 1/10 · Minimal
- Est. fire insurance / yr
- $839 – $1,559
Heat risk 5/10 · Moderate
- Hot days now (above 107°F)
- 7 days/yr
- Hot days in 30 yrs
- 20 days/yr
Wind risk 4/10 · Minor
- Chance of severe wind over 30 yrs
- 10.0%
Air-quality risk 2/10 · Minimal
- Unhealthy air days now
- 1 days/yr
- Unhealthy air days in 30 yrs
- 1 days/yr
Risk factors via First Street. Map © Google.
Why this score? — see what drove the D grade
The composite is a weighted blend of 9 inputs, each scored 0–100. Each bar is that input's sub-score; the figure is the points it added to the 100-point composite (weight × sub-score).
- Cash flow +12.0/30.0
- ARV discount +10.9/15.0
- Appreciation +5.4/10.0
- DSCR +3.5/10.0
- Livability +2.9/5.0
- Schools +2.7/10.0
- Rent growth +2.5/5.0
- Condition / age +2.5/5.0
- 1% rule +2.4/10.0
$175,000
🖨 Deal sheet (PDF) 📄 Offer letter ✓ Due diligence
Listing remarks MLS
Welcome Home! Sitting on a quite dead end street with a wonderful fenced yard backing up to a empty field. All appliance convey along with the sheds. Level yard and wonderful patio for outside entertaining. This home is a must see. Did I mention there will be new wood laminate flooring in the livingroom and carpet in the bedooms? Come take a look.
Key facts
- New hvac
- Front porch
- Great location
Tags
Property features AI
Finance
- Other: Lot size approximately 0.22 acres
Exterior
- Parking: No designated covered parking; No recorded total parking spaces
- Utilities: Public water; Public sewer; Electricity available
- Home design: Single-family residence; One story
- Construction: Vinyl siding; Shingle roof; Existing structure
- Exterior features: Covered porch; Patio; Chain link fencing
Interior
- Kitchen: Electric oven; Electric range; Dishwasher; Microwave; Refrigerator
- Bedrooms: Three bedrooms (all on the main level); Bedroom sizes: 12 x 14, 11 x 13, 10 x 10
- Flooring: Carpet; Laminate; Vinyl
- Bathrooms: One full bathroom
- Heating & cooling: Central heating (electric); Central air conditioning (electric)
- Interior features: Eat-in kitchen; Great room; Crawl space basement
- Laundry & utility: Washer hookup; Electric dryer hookup
Neighborhood map
What this means for you Summary
Snapshot
- This is a 3-bed/1.0-bath single-family listed at $175k.
Deal economics
- At list price, monthly cash flow is $-42 ($-502/yr) — negative.
- To cash-flow at today's rent, offer at most $168k (4.2% below list).
- To meet the 1% rule (rent ≥ 1% of price), the offer needs to be $129k (26.4% below list).
- Recommended offer: $129k (26.4% below list) — sets the bar for 1% rule.
- Cap rate 6.0% vs local median 3.5% in Oak Grove — top-decile yield for the area; either an underpriced asset or a hidden risk that comps aren't pricing in. Stress-test before assuming the spread holds.
Location & tenants
- Location reads 57/100 on livability (#445 in KY) — a working-class tenant base; expect higher turnover. Strengths: cost of living A+, housing A+; Watch: crime C-, amenities F, commute F.
- Christian County (town): math 30% / reading 34% proficiency, ranked #93 of 165 in KY (top 56%) — families likely to look elsewhere, expect single-tenant / working-renter base with shorter leases; 61% free/reduced lunch — lower-income household profile, screen leases tightly.
- Zoned schools: Pembroke Elementary School (math 36% / reading 39%, grade F, #251 of 676 statewide, top 37%, 660 students, 64% FRL); Hopkinsville Middle School (math 32% / reading 36%, grade F, #103 of 217 statewide, top 48%, 549 students, 67% FRL); Hopkinsville High School (math 27% / reading 32%, grade F, #127 of 254 statewide, top 58%, 962 students, 60% FRL) — zoned schools at 64% FRL track the district average.
- Market conditions: Rents flat; 87 active listings in the ZIP; 40 comparable units currently listed for rent nearby; rentals at typical pace (median 23d on market — plan ~3-4 weeks tenant-placement turnaround); 193 units permitted in Christian County in 2024 (66 in 5+ unit buildings).
Forward outlook
- In year one you build about $3k of equity ($1k loan paydown + $2k appreciation (0.9% local appreciation)).
- Christian County population projected at -20% by 2050 — secular population decline; favor cash flow + early exit over multi-decade hold.
Negotiation context
- Only 4 days on market — expect competitive offers; lowballing is unlikely to land.
- 2 sale attempts since 8y ago with the ask held roughly flat each time — persistent listings suggest the price (not the market) is what's stuck; bring a comps-based counter.
- Current owner paid $80k; list at $175k implies a 119% gain — meaningful room to come down on a strong offer.
Risks & watch-outs
- Climate carrying-cost: extreme-heat days projected 7→20/yr by 2055 (HVAC capex compounding) — expect insurance premiums to compound above CPI over the hold.
Questions for the listing agent
- What do current leases actually rent for vs. the listed asking? Can we see a recent rent roll and the last 12 months of T-12 income?
- Is there a deadline driving the sale (1031 exchange, divorce, estate, relocation)? That informs how much negotiation room exists.
- Schools are F-rated, which usually means shorter tenancies and higher turnover. Who's the typical renter profile here, and what's been the actual vacancy rate?
- The area grade is low — what's the realistic commute time and amenity access for the typical tenant pool here? Any planned neighborhood developments (good or bad) we should know about?
- What's the average days-on-market for RENTAL listings here right now (not sales)? A rising rental-DOM trend means longer vacancies and softer asking-rent achievability than the comps imply.
- What's the recent tenant-quality profile in this submarket — average credit score on applications, eviction rate, late-payment / NSF rate, and stable-employment percentage? A property-management company in the area should have these aggregated.
- How much new for-sale + rental construction is in the pipeline within 1–3 miles? Heavy new supply typically softens prices + rents 12–24 months out; constrained supply supports both.
Investment metrics
- 1% rule
- 0.74% ✗
- Cap rate
- 6.01%
- Cash-on-cash
- -1.02%
- DSCR
- 0.95
- GRM
- 11.3
CMA / ARV
- ARV (on-the-fly)
- $189,440
- Comps found
- 12
Show comp detail 12 sales within ~0.75 mi
| Address | Dist | Beds/Ba | Sqft | Sold | Price | $/sf | Match |
|---|---|---|---|---|---|---|---|
| 1646 Hannibal Dr | 0.03mi | 3/1.0 | 1,087 (+6%) | 1mo | $140,000 | $129 | 87 |
| 1957 Timberline Cir | 0.09mi | 3/2.0 | 1,050 (+2%) | 1mo | $180,000 | $171 | 87 |
| 1905 Timberline Cir | 0.20mi | 3/2.0 | 1,020 (-0%) | 5mo | $170,000 | $167 | 81 |
| 2009 Timberline Cir | 0.21mi | 3/2.0 | 1,000 (-2%) | 3mo | $185,500 | $186 | 80 |
| 1637 Hannibal Dr | 0.08mi | 2/2.0 (-1) | 968 (-6%) | 6mo | $130,900 | $135 | 74 |
| 414 Pacific Ave | 0.67mi | 3/1.0 | 1,000 (-2%) | 0mo | $185,000 | $185 | 65 |
| 213 Bob White Trl | 0.30mi | 3/2.0 | 1,120 (+9%) | 3mo | $205,000 | $183 | 64 |
| 930 Arrow Cir | 0.48mi | 3/1.5 | 1,100 (+7%) | 0mo | $229,900 | $209 | 63 |
| 121 Oak Tree Dr | 0.45mi | 3/2.0 | 1,125 (+10%) | 0mo | $212,500 | $189 | 58 |
| 102 Pappy Dr | 0.56mi | 3/2.0 | 1,104 (+8%) | 3mo | $219,500 | $199 | 54 |
| 202 Ruf Dr | 0.56mi | 3/2.0 | 1,120 (+9%) | 0mo | $179,900 | $161 | 54 |
| 300 Hunter Owens Ct | 0.62mi | 3/2.0 | 1,150 (+12%) | 3mo | $225,000 | $196 | 44 |
Match score weights: distance 35% · size 25% · config 20% · recency 20%. Top-matched comps best support the ARV.
Projected returns pro-forma
0.88% appreciation · 0.03% rent growth · sell at horizon
- IRR
- -1.8%
- Equity multiple
- 0.91×
- Total profit
- $-4,237
- Equity at exit
- $58,640
- IRR
- 1.7%
- Equity multiple
- 1.20×
- Total profit
- $9,727
- Equity at exit
- $77,081
Cash invested: $49,000 (down + closing). Projections, not guarantees.
Landlord ↔ Tenant lean methodology
- Overall (STATE)
- 83 Strongly Landlord-Friendly
- State Kentucky
- 83 Strongly Landlord-Friendly · R+16
- County
- — inherits STATE
- City
- — inherits STATE
ZIP-level market 42262
- Home prices YoY
- 0.3%
- Rents YoY
- 0.0%
- Active inventory
- 87
- Price-to-rent
- 11.3×
Monthly cashflow live
- Estimated rent
- $1,288 high interval (Pro) →
- Mortgage (P&I)
- −$918
- Tax from tax record
- −$68 /mo · $822/yr
- Insurance
- −$73
- HOA
- −$0
- Vacancy / Maint / Mgmt
- −$270
- Net cashflow
- $-42
Break-even live
Sensitivity live
| Price | -10% $57 | -5% $8 | +0% $-42 | +5% $-91 | +10% $-141 |
|---|---|---|---|---|---|
| Rent | -10% $-144 | -5% $-93 | +0% $-42 | +5% $9 | +10% $60 |
| Rate | -1.0pp $46 | -0.5pp $3 | base $-42 | +0.5pp $-87 | +1.0pp $-133 |
UW: 25.0% down · 7.5% · 30yr · 1.5% tax · 5.0% vac · 8.0% maint · 8.0% mgmt
Financing live
Cash to close
- Down payment
- $43,750
- Closing costs
- $5,250
- Reserves months
- —
- Total cash needed
- —
Loan-product check · same deal, 3 products live
Conventional
25% down · 7.5% · 30yr
- Down + closing
- —
- Monthly P&I
- —
- Monthly cashflow
- —
- DSCR
- —
- Eligible?
- —
Personal DTI + credit; lowest rate.
DSCR
20% down · 8.5% · 30yr
- Down + closing
- —
- Monthly P&I
- —
- Monthly cashflow
- —
- DSCR
- —
- Eligible?
- —
No personal income docs; deal must DSCR.
Hard money
10% down · 12.0% · 12mo
- Down + closing
- —
- Monthly P&I
- —
- Monthly cashflow
- —
- DSCR
- —
- Eligible?
- —
Short-term bridge; refi at stabilization.
Rent comps 40 comps
| Address | Beds | Baths | Sqft | Rent | $/sqft | DOM | Units | Dist |
|---|---|---|---|---|---|---|---|---|
| 1005 Poppy Seed Dr Oak Grove, KY | 2.0 | 1.0 | 1000 | $1,125 | $1.12 | 15d | 1 | 0.07mi |
| 1808 Harbor Dr Oak Grove, KY | 3.0 | 2.0 | 1056 | $1,250 | $1.18 | 23d | 1 | 0.19mi |
| 1331 Hugh Hunter Rd Oak Grove, KY | 3.0 | 2.0 | 900 | $1,295 | $1.44 | 45d | 1 | 0.27mi |
| 1539 Hugh Hunter Rd Oak Grove, KY | 2.0 | 1.0 | 775 | $900 | $1.16 | 45d | 1 | 0.33mi |
| 307 Pappy Dr Oak Grove, KY | 3.0 | 2.0 | 1153 | $1,450 | $1.26 | 23d | 1 | 0.55mi |
| 307 Pappy Dr Oak Grove, KY | 3.0 | 2.0 | 1153 | $1,450 | $1.26 | 15d | 1 | 0.55mi |
| 104 Pepper Ct Oak Grove, KY | 3.0 | 2.0 | 1000 | $1,285 | $1.28 | 45d | 1 | 0.55mi |
| 907 Desota Ln Oak Grove, KY | 4.0 | 2.0 | 1423 | $1,895 | $1.33 | 15d | 1 | 0.59mi |
| 907 Desota Ln Oak Grove, KY | 4.0 | 2.0 | 1423 | $1,895 | $1.33 | 45d | 1 | 0.59mi |
| 136 New Gritton Ave Oak Grove, KY | 3.0 | 1.0 | 1060 | $1,000 | $0.94 | 23d | 1 | 0.60mi |
| 110 Brandi Ct Oak Grove, KY | 3.0 | 2.5 | 1467 | $1,425 | $0.97 | 23d | 1 | 0.71mi |
| 1037 Summerhaven Rd Clarksville, TN | 3.0 | 2.5 | 1480 | $1,850 | $1.25 | 15d | 1 | 0.74mi |
| 326 Atlantic Ave Oak Grove, KY | 3.0 | 2.0 | 1080 | $1,325 | $1.23 | 15d | 1 | 0.78mi |
| 323 Atlantic Ave Oak Grove, KY | 3.0 | 2.0 | 1099 | $1,400 | $1.27 | 45d | 1 | 0.79mi |
| 323 Atlantic Ave Oak Grove, KY | 3.0 | 2.0 | 1099 | $1,400 | $1.27 | 15d | 1 | 0.79mi |
| 925 Tiny Town Rd Clarksville, TN | 2.0 | 1.0–1.5 | 1052 | $1,250 | $1.19 | 15d | 1 | 0.79mi |
| 1088 Pembroke Oak Grove Rd Unit 21 Oak Grove, KY | 2.0 | 1.5 | 1000 | $850 | $0.85 | 45d | 1 | 0.85mi |
| 1108 Pembroke Oak Grove Rd Apt 19 Oak Grove, KY | 2.0 | 1.5 | 1000 | $1,245 | $1.25 | 45d | 1 | 0.85mi |
| 607 Kerri Ln Oak Grove, KY | 3.0 | 2.0 | 1120 | $900 | $0.80 | 45d | 1 | 0.91mi |
| 615 Kerri Ln Oak Grove, KY | 3.0 | 2.0 | 1120 | $825 | $0.74 | 45d | 1 | 0.92mi |
| 551 Syracuse Dr Unit B Clarksville, TN | 2.0 | 1.5 | 1000 | $1,100 | $1.10 | 23d | 1 | 0.94mi |
| 3301 Royster Ln Clarksville, TN | 2.0 | 1.0 | 900 | $950 | $1.06 | 23d | 1 | 0.94mi |
| 703 Trevor Ln Oak Grove, KY | 3.0 | 2.0 | 1120 | $850 | $0.76 | 23d | 1 | 0.95mi |
| 611 Artic Ave Oak Grove, KY | 3.0 | 1.0 | 950 | $1,200 | $1.26 | 15d | 1 | 0.96mi |
| 276 Hugh Hunter Rd Oak Grove, KY | 3.0 | 2.0 | 1040 | $1,600 | $1.54 | 23d | 1 | 0.96mi |
| 721 Trevor Ln Oak Grove, KY | 3.0 | 2.0 | 1020 | $925 | $0.91 | 23d | 1 | 0.96mi |
| 102 Meadow Ln Unit A Oak Grove, KY | 2.0 | 1.5 | 1100 | $1,100 | $1.00 | 23d | 1 | 0.97mi |
| 205 Anthony Ln Unit 21 Oak Grove, KY | 2.0 | 1.0 | 1000 | $825 | $0.82 | 15d | 1 | 0.97mi |
| 822 Monroe Ln Oak Grove, KY | 3.0 | 2.0 | 1000 | $875 | $0.88 | 23d | 1 | 0.99mi |
| 38 Patricia Ln Unit 38 Oak Grove, KY | 2.0 | 1.0 | 1000 | $825 | $0.82 | 23d | 1 | 1.00mi |
| 621 Tiny Town Rd Clarksville, TN | 2.0 | 1.0 | 950 | $1,516 | $1.60 | 15d | 1 | 1.00mi |
| 268 Golden Pond Ave Oak Grove, KY | 3.0 | 2.0 | 1137 | $1,475 | $1.30 | 45d | 1 | 1.00mi |
| 630 Artic Ave Oak Grove, KY | 3.0 | 2.0 | 1080 | $1,275 | $1.18 | 45d | 1 | 1.00mi |
| 815 Monroe Ln Oak Grove, KY | 3.0 | 2.0 | 1120 | $875 | $0.78 | 15d | 1 | 1.01mi |
| 3415 Oak Lawn Dr Unit 1234446P Clarksville, TN | 3.0 | 2.0 | 1022 | $2,685 | $2.63 | 23d | 1 | 1.02mi |
| 615 Tiny Town Rd Clarksville, TN | 2.0 | 2.5 | 1100 | $1,400 | $1.27 | 15d | 3 | 1.04mi |
| 1140 Timothy Ave Oak Grove, KY | 3.0 | 2.0 | 968 | $1,610 | $1.66 | 23d | 1 | 1.07mi |
| 558 Oakmont Dr Clarksville, TN | 3.0 | 2.0 | 1104 | $1,450 | $1.31 | 23d | 1 | 1.10mi |
| 551 Fox Trot Dr Clarksville, TN | 3.0 | 2.5 | 1310 | $1,550 | $1.18 | 15d | 1 | 1.11mi |
| 556 Oakmont Dr Clarksville, TN | 3.0 | 2.0 | 1080 | $2,399 | $2.22 | 23d | 1 | 1.12mi |
Listing history 3 events
-
2026-06-21days on market $175,000 Active 4 DOM
-
2026-06-17remarks 695-char remark
-
2026-06-17$175,000 Active 1 DOM
ⓘ Source: listings_history table (triggers on properties + properties_extension) + one-shot
backfill from property_details.listing_events for pre-trigger history.
Tax reassessment forecast KY · Resets to sale price
- Current annual tax
- $822 · $68/mo
- Projected year-2 tax
- $1,505 · $125/mo
- Expected delta
- +$683/yr (+$57/mo · 83.1%)
ⓘ Screening estimate from a state-policy table — verify with the county assessor before closing.
Climate risk First Street
- Flood 1/10 Low FEMA zone X (unshaded) · 0% chance over 30 yrs
- Wildfire 1/10 Low
- Heat 5/10 Major 7 d/yr ≥107°F today · 20 d/yr by 30 yrs out
- Wind 4/10 Moderate 10% chance of damaging wind over 30 yrs
- Air quality 2/10 Low 1 unhealthy d/yr today · 1 by 30 yrs out
Nearby sold comps map
Loading sold comps map…
Walkable amenities ~0.75 mi
Loading nearby amenities…
Taxation est. · year 1
- Rental income
- $15,453
- − Mortgage interest
- −$9,803
- − Property taxes
- −$822
- − Insurance
- −$875
- − Repairs & maintenance
- −$1,236
- − Management
- −$1,236
- − Depreciation
- −$5,091
- Taxable loss
- −$3,610
- Est. tax savings @ 24.0%
- +$866
- After-tax cash flow
- $365/yr
For passive investors: Depreciation is non-cash, so a rental often shows a tax loss while cash-flowing — sheltering income. Rental losses are passive: they offset passive income freely, and up to $25,000/yr can offset ordinary (W-2) income if you actively participate and your MAGI is under $100k (phasing out to $0 by $150k); unused losses carry forward. On sale, claimed depreciation is recaptured at up to 25%, and gains may owe capital-gains tax (a 1031 exchange can defer both). Figures are a year-1 estimate at your 24.0% rate — not tax advice; consult a CPA.
Schools (NCES district)
- District
- Christian County
- NCES district ID
- 2101150
- Math proficiency
- 30% ▼ -9.00%
- Reading proficiency
- 34% ▼ -10.00%
- Median HH income
- $38,961
- Composite
- 26.8/100
- National rank
- #7118
- State rank
- #93 of 165 in KY
Livability — Oak Grove
- Score
- 57/100
- State rank
- #445
- US rank
- #21938
Category grades
Schools grade is shown separately in the Schools card above.
Census & demographics
- Census place
- Oak Grove, KY
- County
- Christian County · 51,080 people
- City population
- 9,665
- Metro
- Clarksville, TN-KY
- Population (ZIP)
- 9,665
- Household income
- $51,975
- Rent vs Own
- Severe rent burden
- 485.0
Population outlook (Christian County) Hauer SSP2
- Today (2025)
- 67,861 people
- By 2030
- 65,808 · -3.0%
- By 2040
- 60,090 · -11.5%
- By 2050
- 54,561 · -19.6%
- By 2075
- 45,859 · -32.4%
- By 2100
- 38,310 · -43.5%
Race, ethnicity, and origin ACS 2023
- Neighborhood character
- Diverse neighborhood (Simpson 0.58)
- Race & ethnicity
- White 61% Black 19% Two or more races 15% Hispanic / Latino 12% Asian 2%
- Hispanic origin (detail)
- Mexican 8% Puerto Rican 3%
- Common ancestry
- Italian 4% Polish 4% Lithuanian 1%
- Foreign-born
- 3% · Canada
- Languages at home
- 84% English-only · German/W. Germanic 10% Spanish 4% Other Asian/Pacific 1%
Political lean MEDSL · Christian
- 2024 margin
- Solid R (+33.6) · D 32.6% · R 66.1% · Other 1.3%
- 2008→2024 swing
- -12.4pp toward R · 2008: -21.2pp · 2024: -33.6pp
- All cycles
- 2024: R+33.6 2020: R+28.4 2016: R+31.4 2012: R+23.8 2008: R+21.2
Not yet ingested
- Civics
- —
Market trends
- HPI YoY
- ▲ 0.88%
- Current HPI
- 264.8628
- Rent YoY
- ▬ 0.03%
- Metro
- Clarksville, TN-KY
- State GDP YoY
- ▲ 1.81%
- F500 in state
- 4
Industry mix (Fortune 500 HQ in KY)
| Industry | F500 HQs | Revenue |
|---|---|---|
| Healthcare | 1 | $118B |
|
||
| Food / Beverage | 1 | $7B |
|
||
Price history
+113.4% since first listed5 events — show timeline
- 2026-06-17 Listed $175,000 REALTRACS as Distributed by MLS Grid
- 2019-01-07 Sold (Public Records) $80,000 Public Records
- 2019-01-02 Sold (MLS) $80,000 REALTRACS as Distributed by MLS Grid
- 2018-07-20 Listed $78,000 REALTRACS as Distributed by MLS Grid
- 2008-05-16 Sold (Public Records) $82,000 Public Records
Property tax history
+2.0%/yrLatest (2025): $822 · -3.9% YoY. Source: county tax records.
Cash-flow waterfall
monthlySold comps — $/sqft
last 12 mo · ≤1 miLoading sold comps…